
How to Value Stocks in Transition Using Tesla as a Case Study
6 mins ago

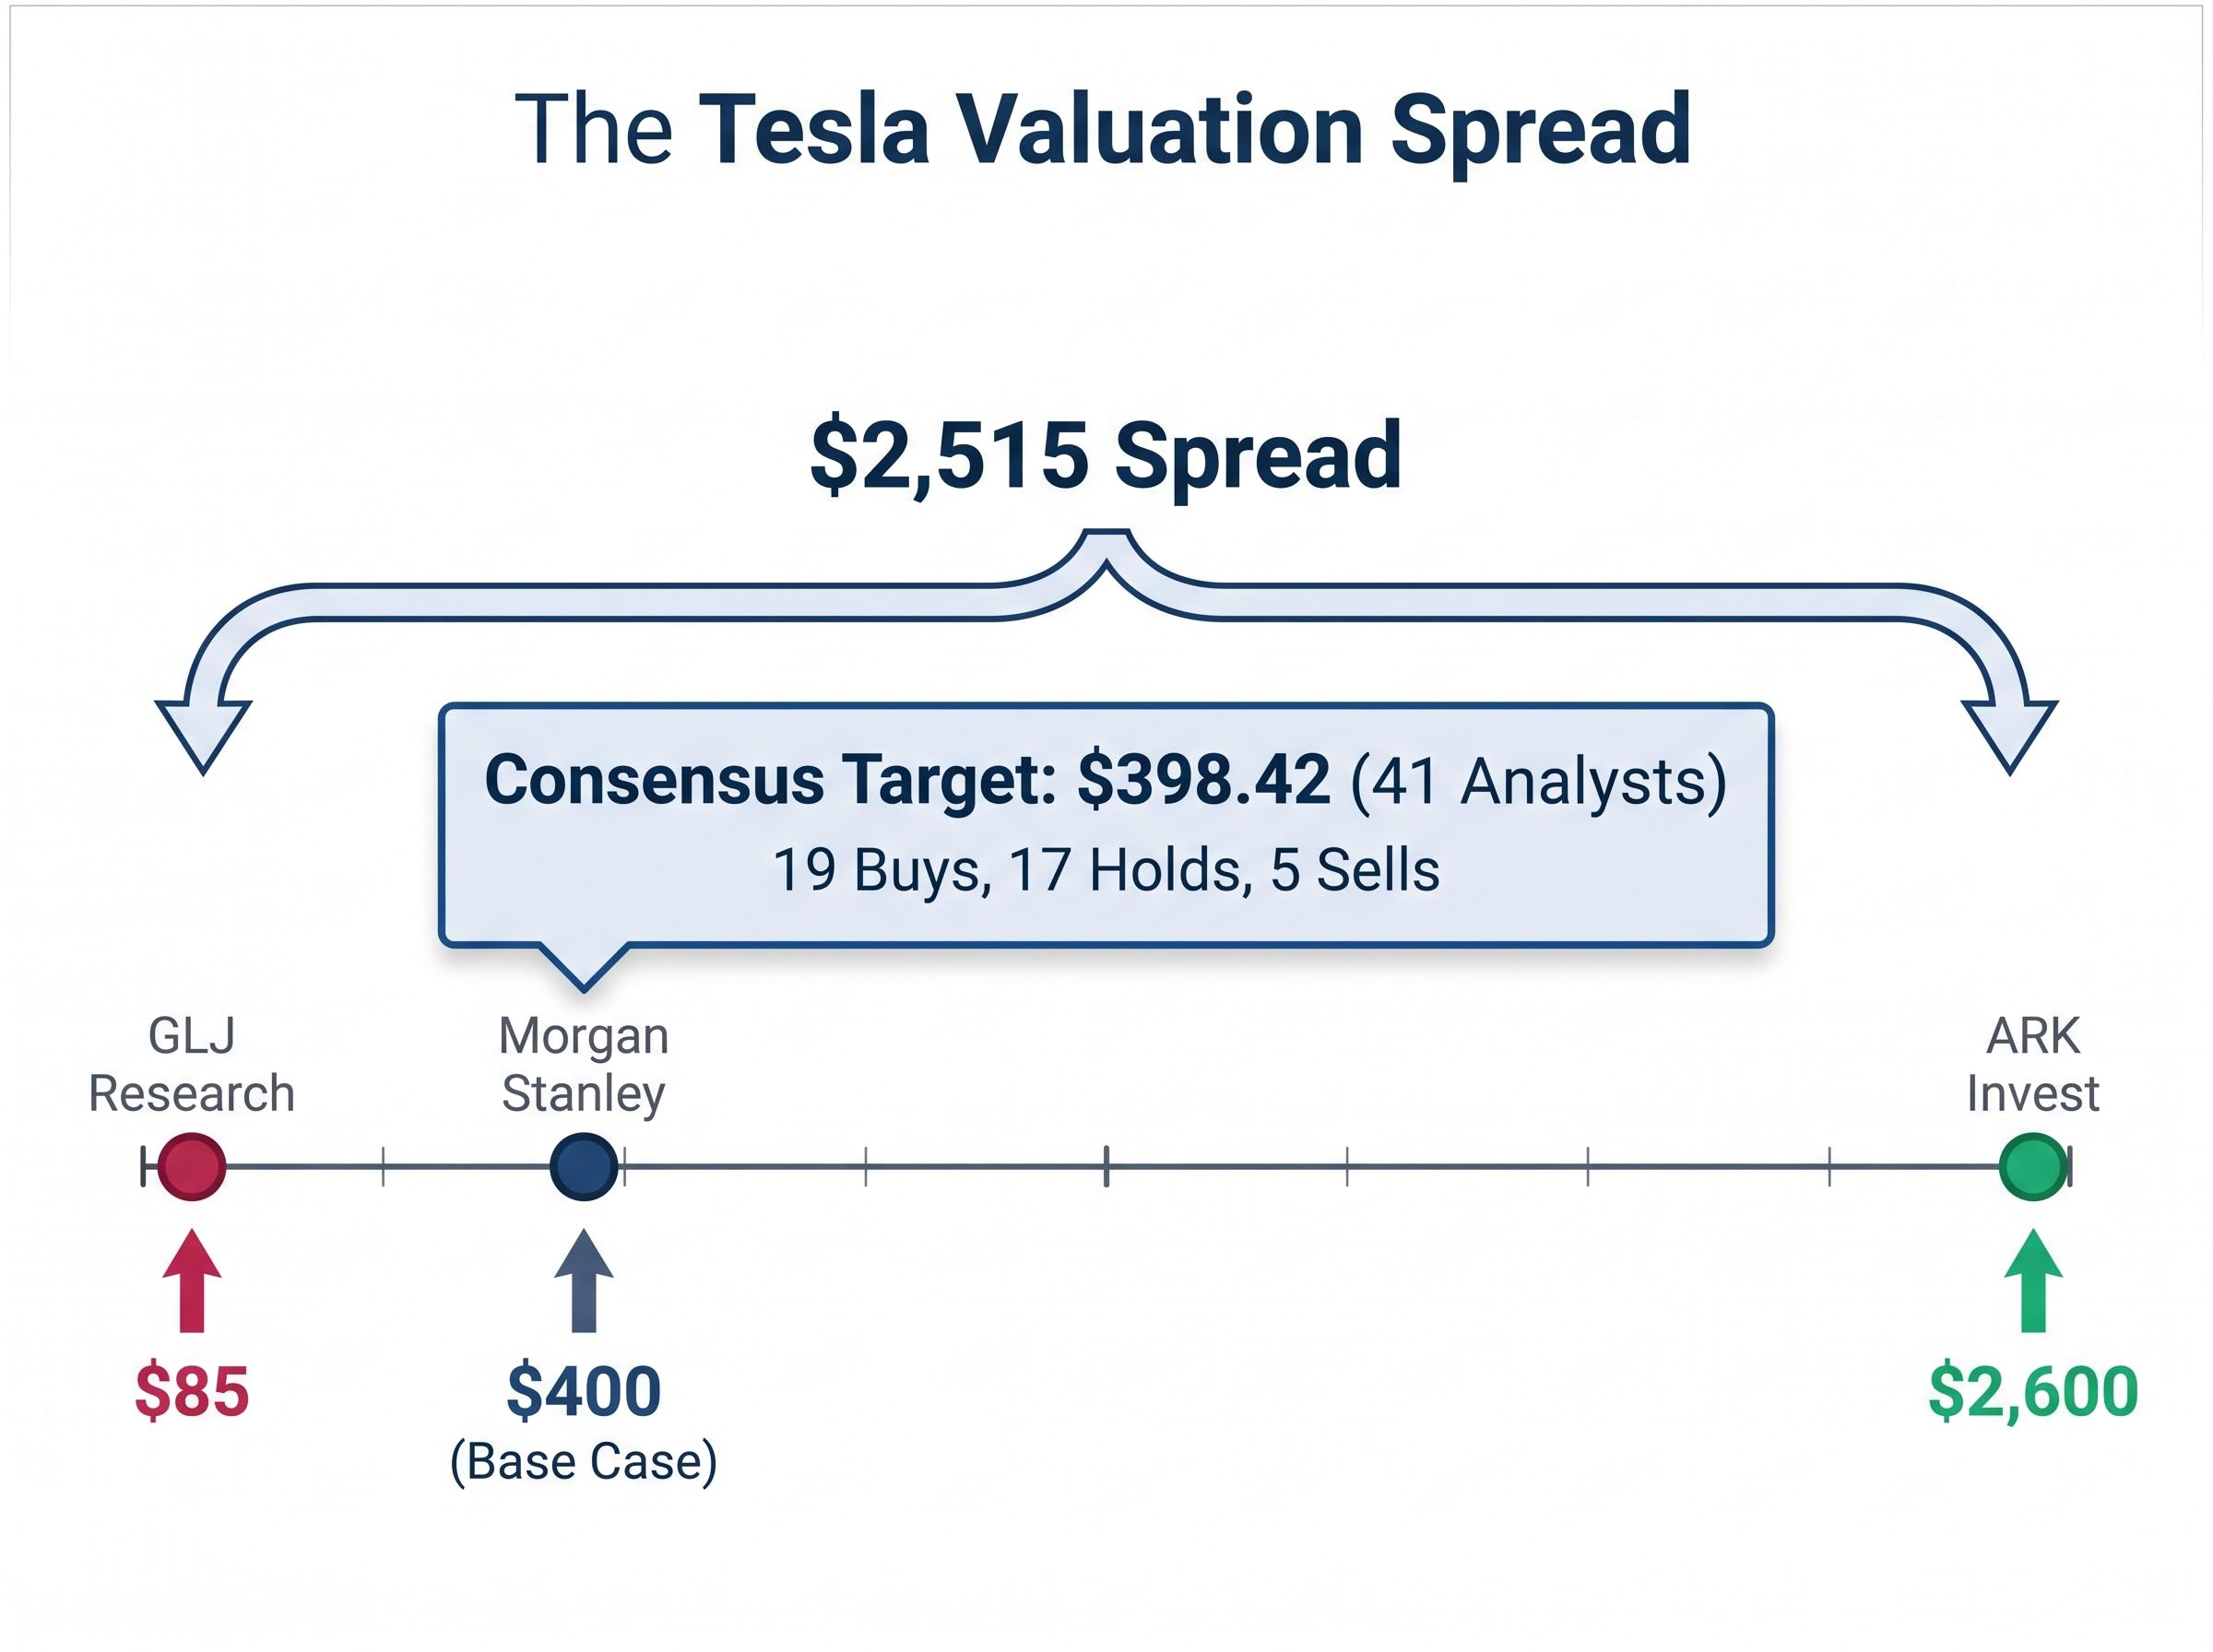
Tesla’s 41-analyst consensus price target sits at $398.42. GLJ Research says $85. ARK Invest says $2,600. The same company, the same financial statements, and a spread of nearly $2,500 between the lowest and highest legitimate analyst target. That range is not noise. It is the stock valuation analysis problem in its purest form: when a company is priced not for what it earns today but for what it might become, standard shortcuts collapse. Tesla’s Q1 2026 earnings beat (revenue of $22.4 billion, gross margin of 21.7% against a 17% forecast) did not resolve the debate. It sharpened it. The stock now trades at a forward P/E between 185x and 217x, a number that only makes rational sense if specific futures materialise on specific timelines. This guide uses Tesla’s current valuation as a working case study to teach a transferable analytical process: how to construct bull and bear scenarios, how to choose appropriate multiples for each, and why the price paid at entry may be the single most consequential variable in whether any scenario produces an acceptable return.
A single price target feels precise. It gives the impression of resolution. One number, one answer, decision made.
The problem is what that number conceals. Tesla’s 41-analyst consensus averages out to $398.42, composed of 19 Buys, 17 Holds, and 5 Sells. That average blends analysts who believe the company is worth $85 with analysts who believe it is worth $2,600. The resulting figure looks like agreement. It is the opposite.
The spread in one number: GLJ Research’s $85 price target and ARK Invest’s $2,600 target sit $2,515 apart, both derived from the same public financial data and both produced by professional analysts with published methodologies.
Three distinct analytical camps drive that range:
A single consensus target implicitly weights one of these scenarios near 100% and suppresses the alternatives. For a company trading at 185-217x forward earnings, that suppression is where the analytical risk lives. The forward P/E itself is evidence that the market has already embedded a specific scenario, not a neutral assessment. The research task, then, is not to find the “right” number. It is to identify which scenario the current price is paying for and whether that probability weighting holds up under scrutiny.
Every scenario-based valuation rests on four inputs. Each is a distinct lever, and the gap between bull and bear cases traces directly back to where analysts set each one.
The four inputs are:
For companies with multiple business segments at different stages of maturity, a sum-of-the-parts (SOTP) framework is the dominant approach. SOTP values each segment separately, applying a multiple appropriate to that segment’s growth profile and risk, then adds the results together. This is especially relevant for Tesla, where the automotive segment operates as a manufacturing business with established margins while the AI, robotics, and autonomy segments remain pre-revenue or early-revenue ventures requiring entirely different valuation assumptions.
The table below illustrates how the four inputs diverge across the analyst spectrum:
| Input | Bear Case (GLJ Research) | Base Case (Morgan Stanley) | Bull Case (ARK Invest) |
|---|---|---|---|
| Revenue growth | 6-12% | 15-20% | 20-35% |
| Net profit margin | 8-14% | 15-20% | 20-30% |
| Valuation multiple | 18-22x earnings | Auto 12x sales; AI/robotics 25x | 25-35x earnings; robotaxi at 150x revenue |
| AI/robotics weight | 15% success probability | ~40% of enterprise value | ~60% of enterprise value |
A practical valuation process follows four steps:
The point of laying these inputs out side by side is clarity: bull and bear cases are not disagreements about facts. They are disagreements about probabilities and the discount rates applied to uncertain futures. Every number in the table above is a bet, and the analyst’s job is to make that bet explicit rather than hide it inside a single target.
The bear case is not a prediction that Tesla fails. It is the outcome of treating Tesla as an automotive company without assigning material value to unproven AI and robotics segments. The assumptions are, by traditional automaker standards, generous.
A 6-12% revenue growth midpoint of roughly 9% exceeds the historical growth rate of both Ford and GM. Net margins of 8-14% sit above the industry average for volume manufacturers. The applied multiples of 18-22x earnings reflect a premium to legacy automakers, acknowledging Tesla’s brand, margin structure, and energy business.
Tesla’s Q1 2026 results actually strengthen the bear case’s starting position. The reported gross margin of 21.7% comfortably exceeded the pre-earnings analyst forecast of 17%, meaning the automotive business is performing better than even bearish analysts anticipated.
Yet at approximately $375-$428 per share (the range covering recent trading levels), every projected return outcome under the bear scenario was negative over a 10-year horizon.
Sum-of-parts decomposition from Goldman Sachs, Morgan Stanley, and Wedbush places Tesla’s core automotive business at $200-$250 per share, which means 42-54% of the current price rests entirely on AI and robotics execution, a figure that makes the bear case’s negative return projections easier to interpret: the automotive floor is not where the current share price sits.
At the current share price, every bear case return projection is negative. The stock embeds zero margin of safety for an automotive-only scenario, meaning the entire valuation rests on AI and robotics execution.
This result carries a direct implication for how investors size their positions.
If the bear case, built on assumptions that still grant Tesla above-average performance relative to the broader auto industry, produces negative returns at today’s entry price, then every dollar invested is implicitly a bet on the bull scenario materialising. There is no automotive floor beneath the current price.
This is a legitimate investment approach. Growth investors routinely accept binary risk profiles. The discipline it requires, however, is an explicit probability view. An investor holding Tesla at $428 should be able to state the probability they assign to the AI and robotics thesis succeeding and confirm that the expected value, weighted across all scenarios, justifies the position size. Vague optimism about the company’s long-term direction does not substitute for that calculation.
The bull case is internally coherent, and the upside is substantial. Under assumptions of 20-35% revenue growth, 20-30% net margins, and 25-35x earnings multiples, projected annualised returns over 10 years range from roughly 11% to 35%. ARK Invest’s $2,600 price target assigns approximately 30% of enterprise value to the robotaxi business (at a 150x revenue multiple) and another 30% to Optimus robotics (at 200x on projected $1 billion in 2028 revenue).
The estimated probability of this full bull case materialising, even among moderately optimistic analysts, sits at roughly 5-10%.
Three conditions must be met near-simultaneously for these returns to materialise:
The NHTSA investigation EA25002, escalated to an Engineering Analysis on March 18, 2026 and covering more than 3.2 million vehicles, centres on whether Tesla’s Full Self-Driving system failed to recognise reduced-visibility conditions, a finding that would directly affect the regulatory pathway required for unsupervised commercial deployment.
The competitive gap in autonomous mobility is quantifiable. Waymo operates approximately 3,000 vehicles across Phoenix, San Francisco, Los Angeles, and Austin. It has completed more than 20 million cumulative paid trips and generates an estimated $350 million in annual revenue. It holds full commercial driverless permits in its operating cities.
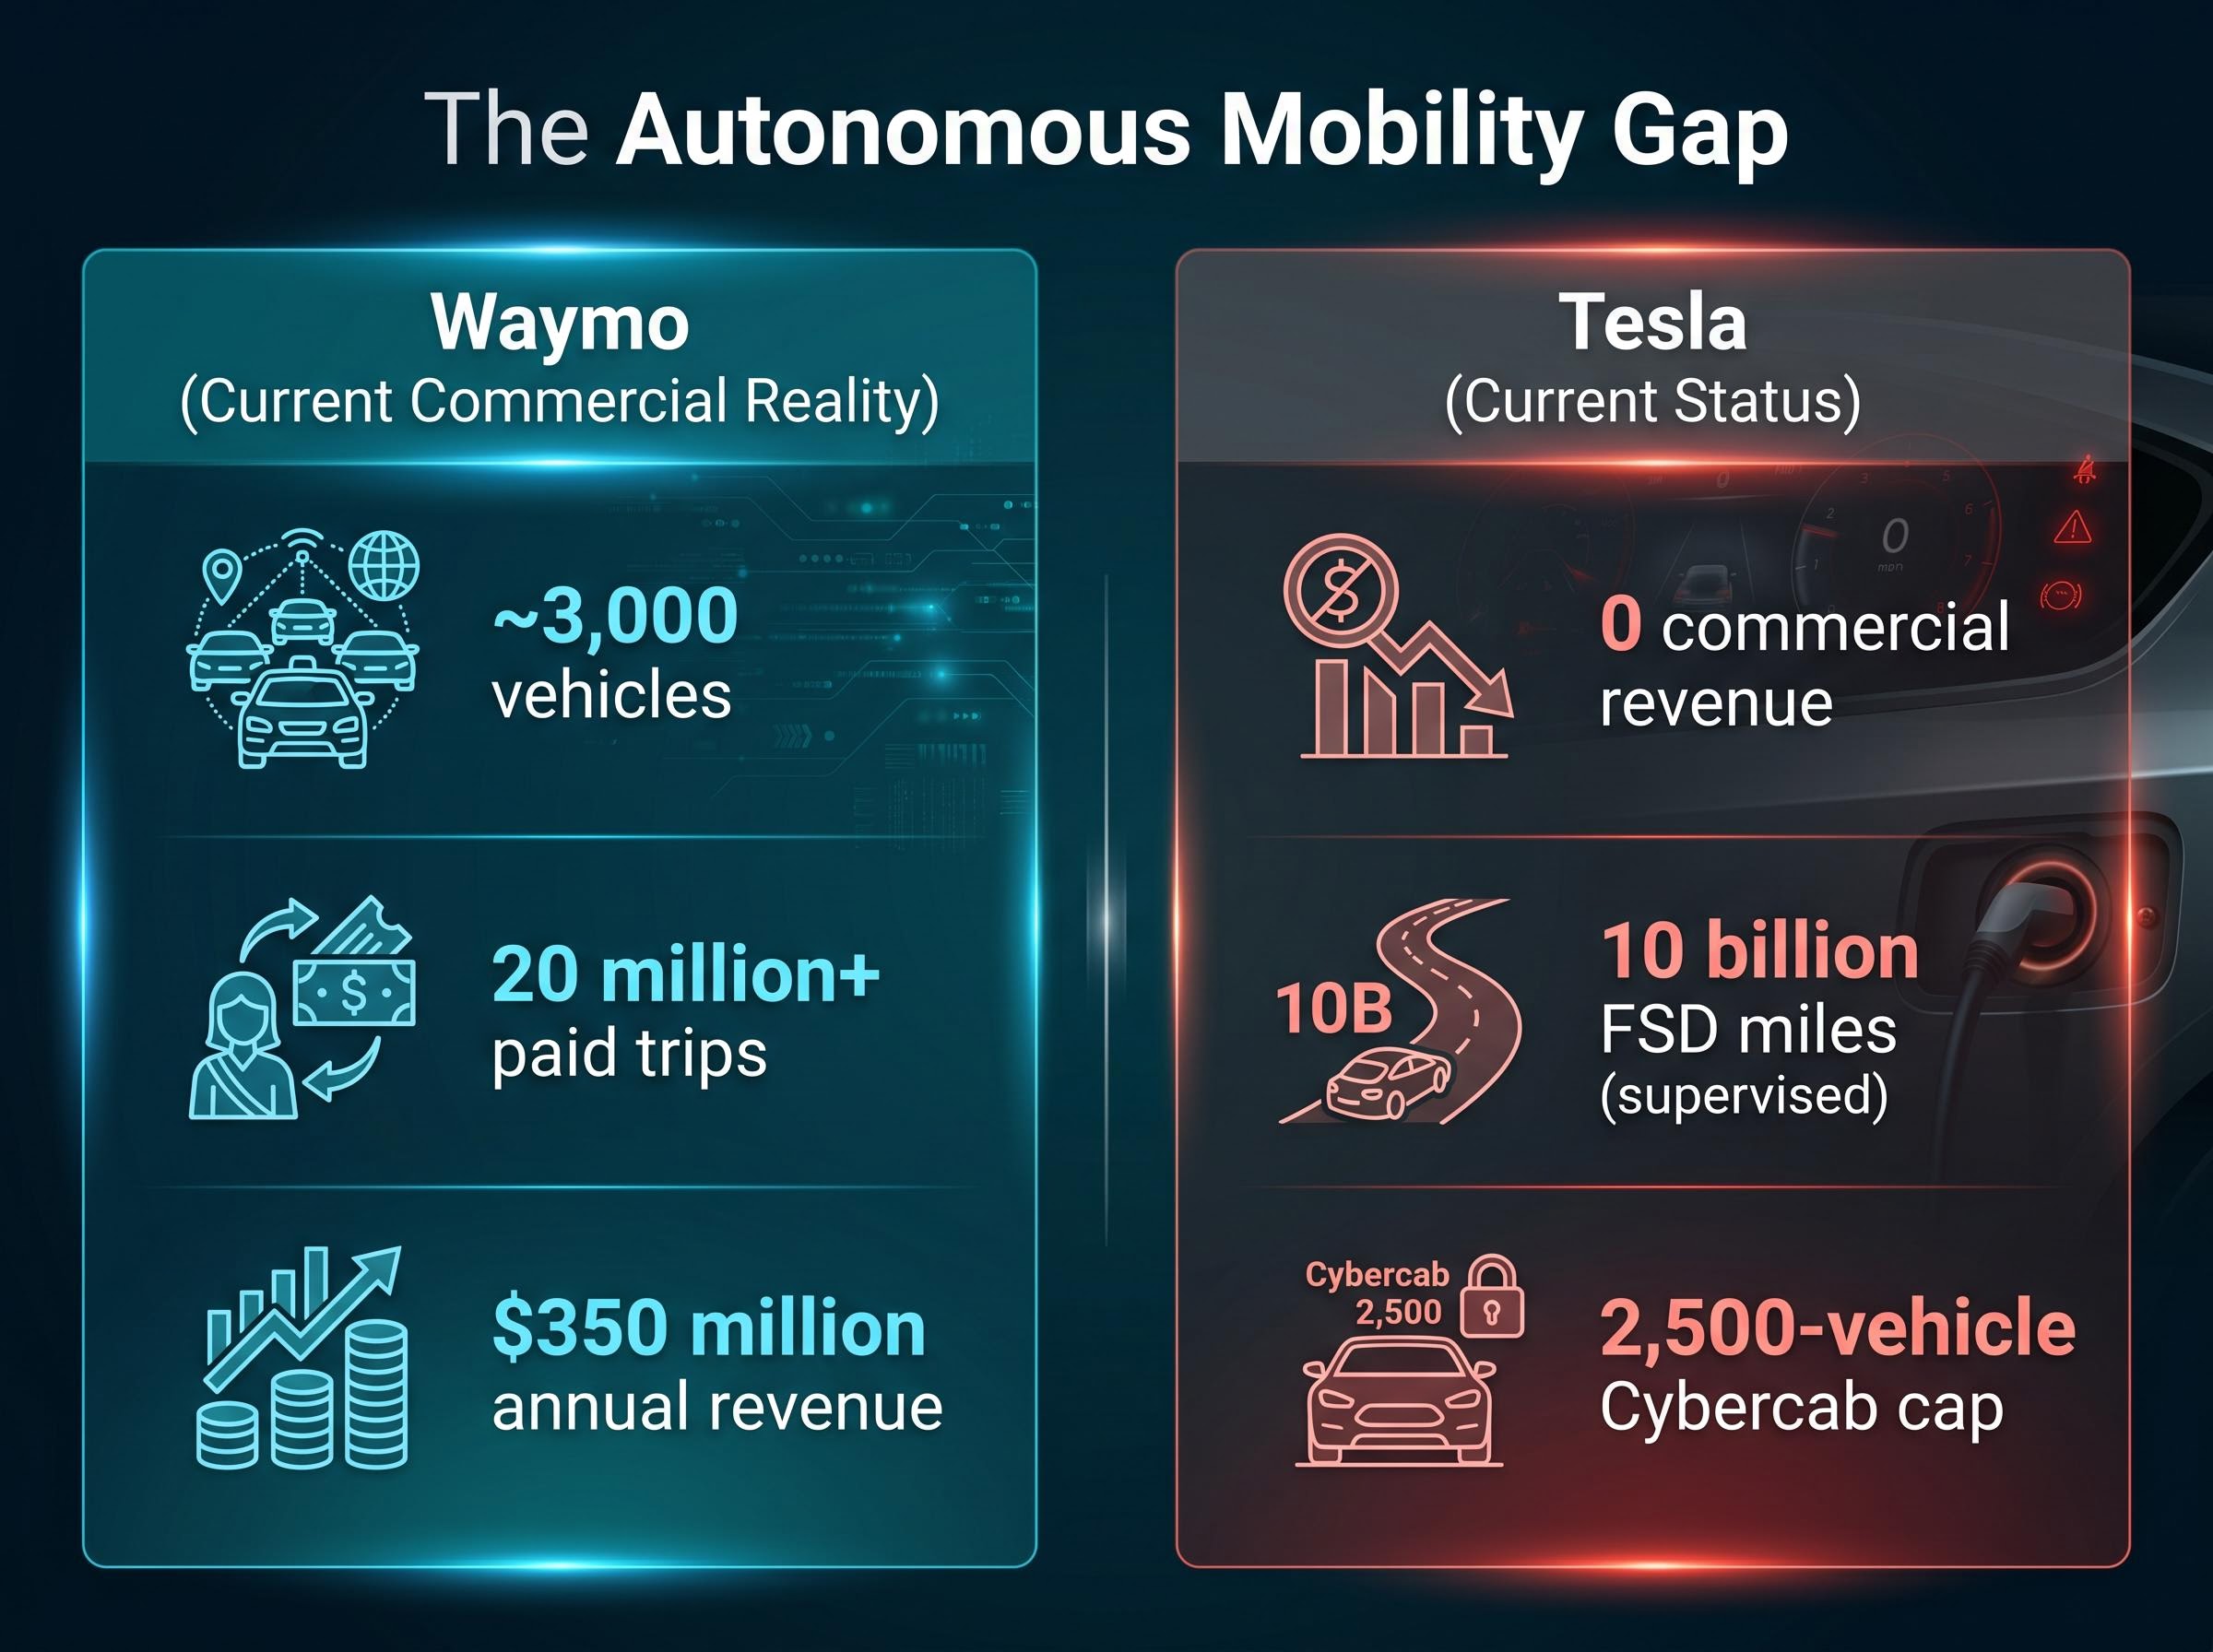
Tesla, by contrast, has accumulated 10 billion FSD miles in supervised mode, a data advantage in training terms, but has completed zero paid commercial robotaxi rides.
The framing here is not that Tesla will lose the autonomy race. It is that the bull case requires Tesla to close this operational and regulatory gap faster than Waymo extends it. Every quarter of delay narrows the window in which the bull case multiples remain justifiable.
Tesla’s capital expenditure pressure compounds the timeline risk: the CFO’s guidance of over $25 billion in 2026 capex is expected to produce negative free cash flow, creating funding requirements at precisely the moment execution proof on robotaxi and Optimus is most critical to maintaining the premium multiple.
Elon Musk’s timeline record introduces a structural dimension to this risk. He claimed full autonomy hardware capability in 2016, projected one million robotaxis by 2020, and stated Optimus would be deployed by 2022. The pattern is one of ultimate delivery but chronic delay, a distinction that matters enormously when the bull case valuation depends on specific revenue arriving within specific years. Tesla’s projected $25 billion+ in 2026 capital expenditure, meanwhile, is expected to generate substantial negative free cash flow, adding financial pressure to the timeline.
The question “will Tesla succeed?” is incomplete. The question that determines investment returns is “will Tesla succeed enough, fast enough, to justify the price paid today?”
At approximately $100 per share, available as recently as a few years ago, nearly every scenario, bull, base, and bear, produced positive long-term returns. At $428 (the recent close) or the $498.83 52-week high, the maths changes entirely.
| Entry Price | Required Scenario to Break Even | Est. Annualised Return (Full Bull Case) | Est. Annualised Return (Base Case) |
|---|---|---|---|
| ~$100 | Bear case sufficient | 25-35% | 12-18% |
| ~$375-$428 | Base case required at minimum | 11-20% | Low single digits |
| ~$499 (52-week high) | Bull case required | 8-15% | Near zero or negative |
Morgan Stanley’s $400 price target, one of the more optimistic institutional views, implies only modest single-digit annualised returns from the current price level. Even a broadly correct directional call on Tesla’s AI future may not translate into adequate investment returns at this entry point.
At a forward P/E of 185-217x, any timeline delay or earnings miss on the AI thesis triggers disproportionate downside through multiple compression (where the market assigns a lower valuation ratio to the same earnings, reducing the share price even as the business grows). Analyst EPS estimates declined more than 90% from their peak before recovering in forward projections that embed autonomy contributions. If those contributions arrive late, the recovery in projected EPS unwinds, and the multiple contracts simultaneously.
A reverse DCF works backwards from the current share price to determine what revenue growth and margin assumptions the market has already embedded, producing a fundamentals-based midpoint valuation of approximately $185-$200 for Tesla at $428 per share and making the gap between that figure and the market price a concrete measure of the execution risk investors are accepting.
Entry price discipline is not a secondary consideration for growth stock investors. At stretched multiples, it is the primary variable separating adequate returns from poor ones, even when the underlying thesis is broadly correct.
Tesla’s valuation debate is specific, but the analytical process it illustrates applies to any company where the market price embeds a business model transition that has not yet occurred. The transferable framework is straightforward.
For investors who want to build an ongoing evidence-based update process around these scenarios, our dedicated guide to monitoring triggers for transitional stocks covers the specific auto gross margin thresholds, Cybercab permitting milestones, Optimus production targets, and CapEx efficiency ratios that should prompt a probability revision rather than a reactive trade on quarterly earnings.
Tesla’s bull case is coherent and the upside is real. The company’s 10 billion FSD miles, its manufacturing scale, and its brand position in both EVs and AI represent genuine competitive advantages. The bear case is equally coherent: the stock embeds near-full execution on unproven bets at a 185-217x forward multiple, with a well-funded competitor already generating commercial revenue in the market the bull case depends on most. The question is never simply “is this a great company?” It is “is this a great company at this price, given this scenario distribution?”
This article is for informational purposes only and should not be considered financial advice. Investors should conduct their own research and consult with financial professionals before making investment decisions. Past performance does not guarantee future results. Financial projections are subject to market conditions and various risk factors.
Scenario-based stock valuation analysis involves building separate bull, base, and bear cases for a company, each with explicit assumptions for revenue growth, profit margins, valuation multiples, and time horizon, then comparing the projected value under each scenario to the current market price.
Analysts assign different probabilities and discount rates to uncertain future outcomes, such as whether a company will successfully launch a new business segment. For Tesla, the gap between an $85 bear target and a $2,600 bull target reflects disagreement over the likelihood of robotaxi, Optimus robotics, and FSD regulatory approval materialising on specific timelines, not disagreement over current financial data.
A sum-of-the-parts valuation values each business segment of a company separately using a multiple appropriate to that segment's growth and risk profile, then adds the results together. It is most useful when a company operates multiple segments at different stages of maturity, such as Tesla's established automotive business alongside its pre-revenue AI and robotics divisions.
At stretched multiples, the entry price determines whether even a broadly correct thesis produces acceptable returns. Tesla's analyst consensus implies only modest single-digit annualised returns from around $375-$428 per share, meaning investors who entered near $100 had positive return prospects under nearly every scenario, while buyers at current prices require the base case or full bull case to materialise just to avoid losses.
A reverse DCF works backwards from the current share price to identify the revenue growth and margin assumptions already embedded in the market price, producing a fundamentals-based valuation midpoint that makes the gap between implied expectations and realistic outcomes a concrete, measurable figure rather than an abstract concern.


