
How to Value Stocks in Transition Using Tesla as a Case Study
5 mins ago

Tesla trades at roughly $410 per share in May 2026. That price makes sense only if a company currently earning $0.41 per share transforms into an AI and robotics platform within a decade. The stock is priced for a future that has not yet materialised, and the gap between what the business earns today and what the market expects it to become is where stock valuation analysis begins.
Q1 2026 results offered a mixed signal. Revenue reached $22.4 billion, adjusted earnings per share of $0.41 beat consensus estimates by as much as 17%, and gross margin held at approximately 21%. By most near-term measures, Tesla executed well. Yet the consensus analyst price target sits at $398-$406, implying flat-to-negative returns from current levels. Strong quarterly results and ambiguous forward value coexisting in the same stock is not a contradiction; it is the signature of a company in transition.
This article uses Tesla’s bull and bear valuation scenarios as a teaching framework for a skill that applies to any company mid-pivot: how to evaluate what a stock price already reflects, why scenario-based thinking produces better decisions than single-point forecasts, and why the price paid at entry is one of the most consequential variables in any investment.
Bull and bear case valuation scenarios are not optimistic versus pessimistic guesses. They are structured tests of which business model materialises, each with its own internally consistent assumptions about revenue growth, margin expansion, and the valuation multiple applied at the analysis horizon.
Three levers determine scenario outputs. The first is projected revenue growth rate, which compounds annually over the analysis period. The second is net profit margin at maturity, the percentage of that revenue the company converts into earnings once the business model stabilises. The third is the valuation multiple applied to those mature earnings, which itself depends on the assumed business model: a company earning software-like margins at scale deserves a higher multiple than a capital-intensive manufacturer.
A 10-year horizon is standard for growth companies where near-term metrics do not reflect long-term potential. What makes scenario analysis more honest than a single DCF or P/E calculation is that the three levers move together within each scenario.
The mechanics behind scenario-based stock valuation rest on three adjustable inputs: revenue growth, net profit margin, and exit multiple, each of which must be internally consistent with the others or the scenario loses its analytical integrity.
| Lever | Bear Case Range | Bull Case Range |
|---|---|---|
| Revenue Growth Rate | 6-12% | 20-35% |
| Net Profit Margin | 8-14% | 20-30% |
| Valuation Multiple | 18-22x | 25-35x |
In the bull case, all three levers compound in the investor’s favour simultaneously: faster revenue growth, higher margins on that revenue, and a richer multiple applied to those earnings. This is why the return spread between scenarios is so wide, and why single-point forecasts obscure the actual distribution of outcomes.
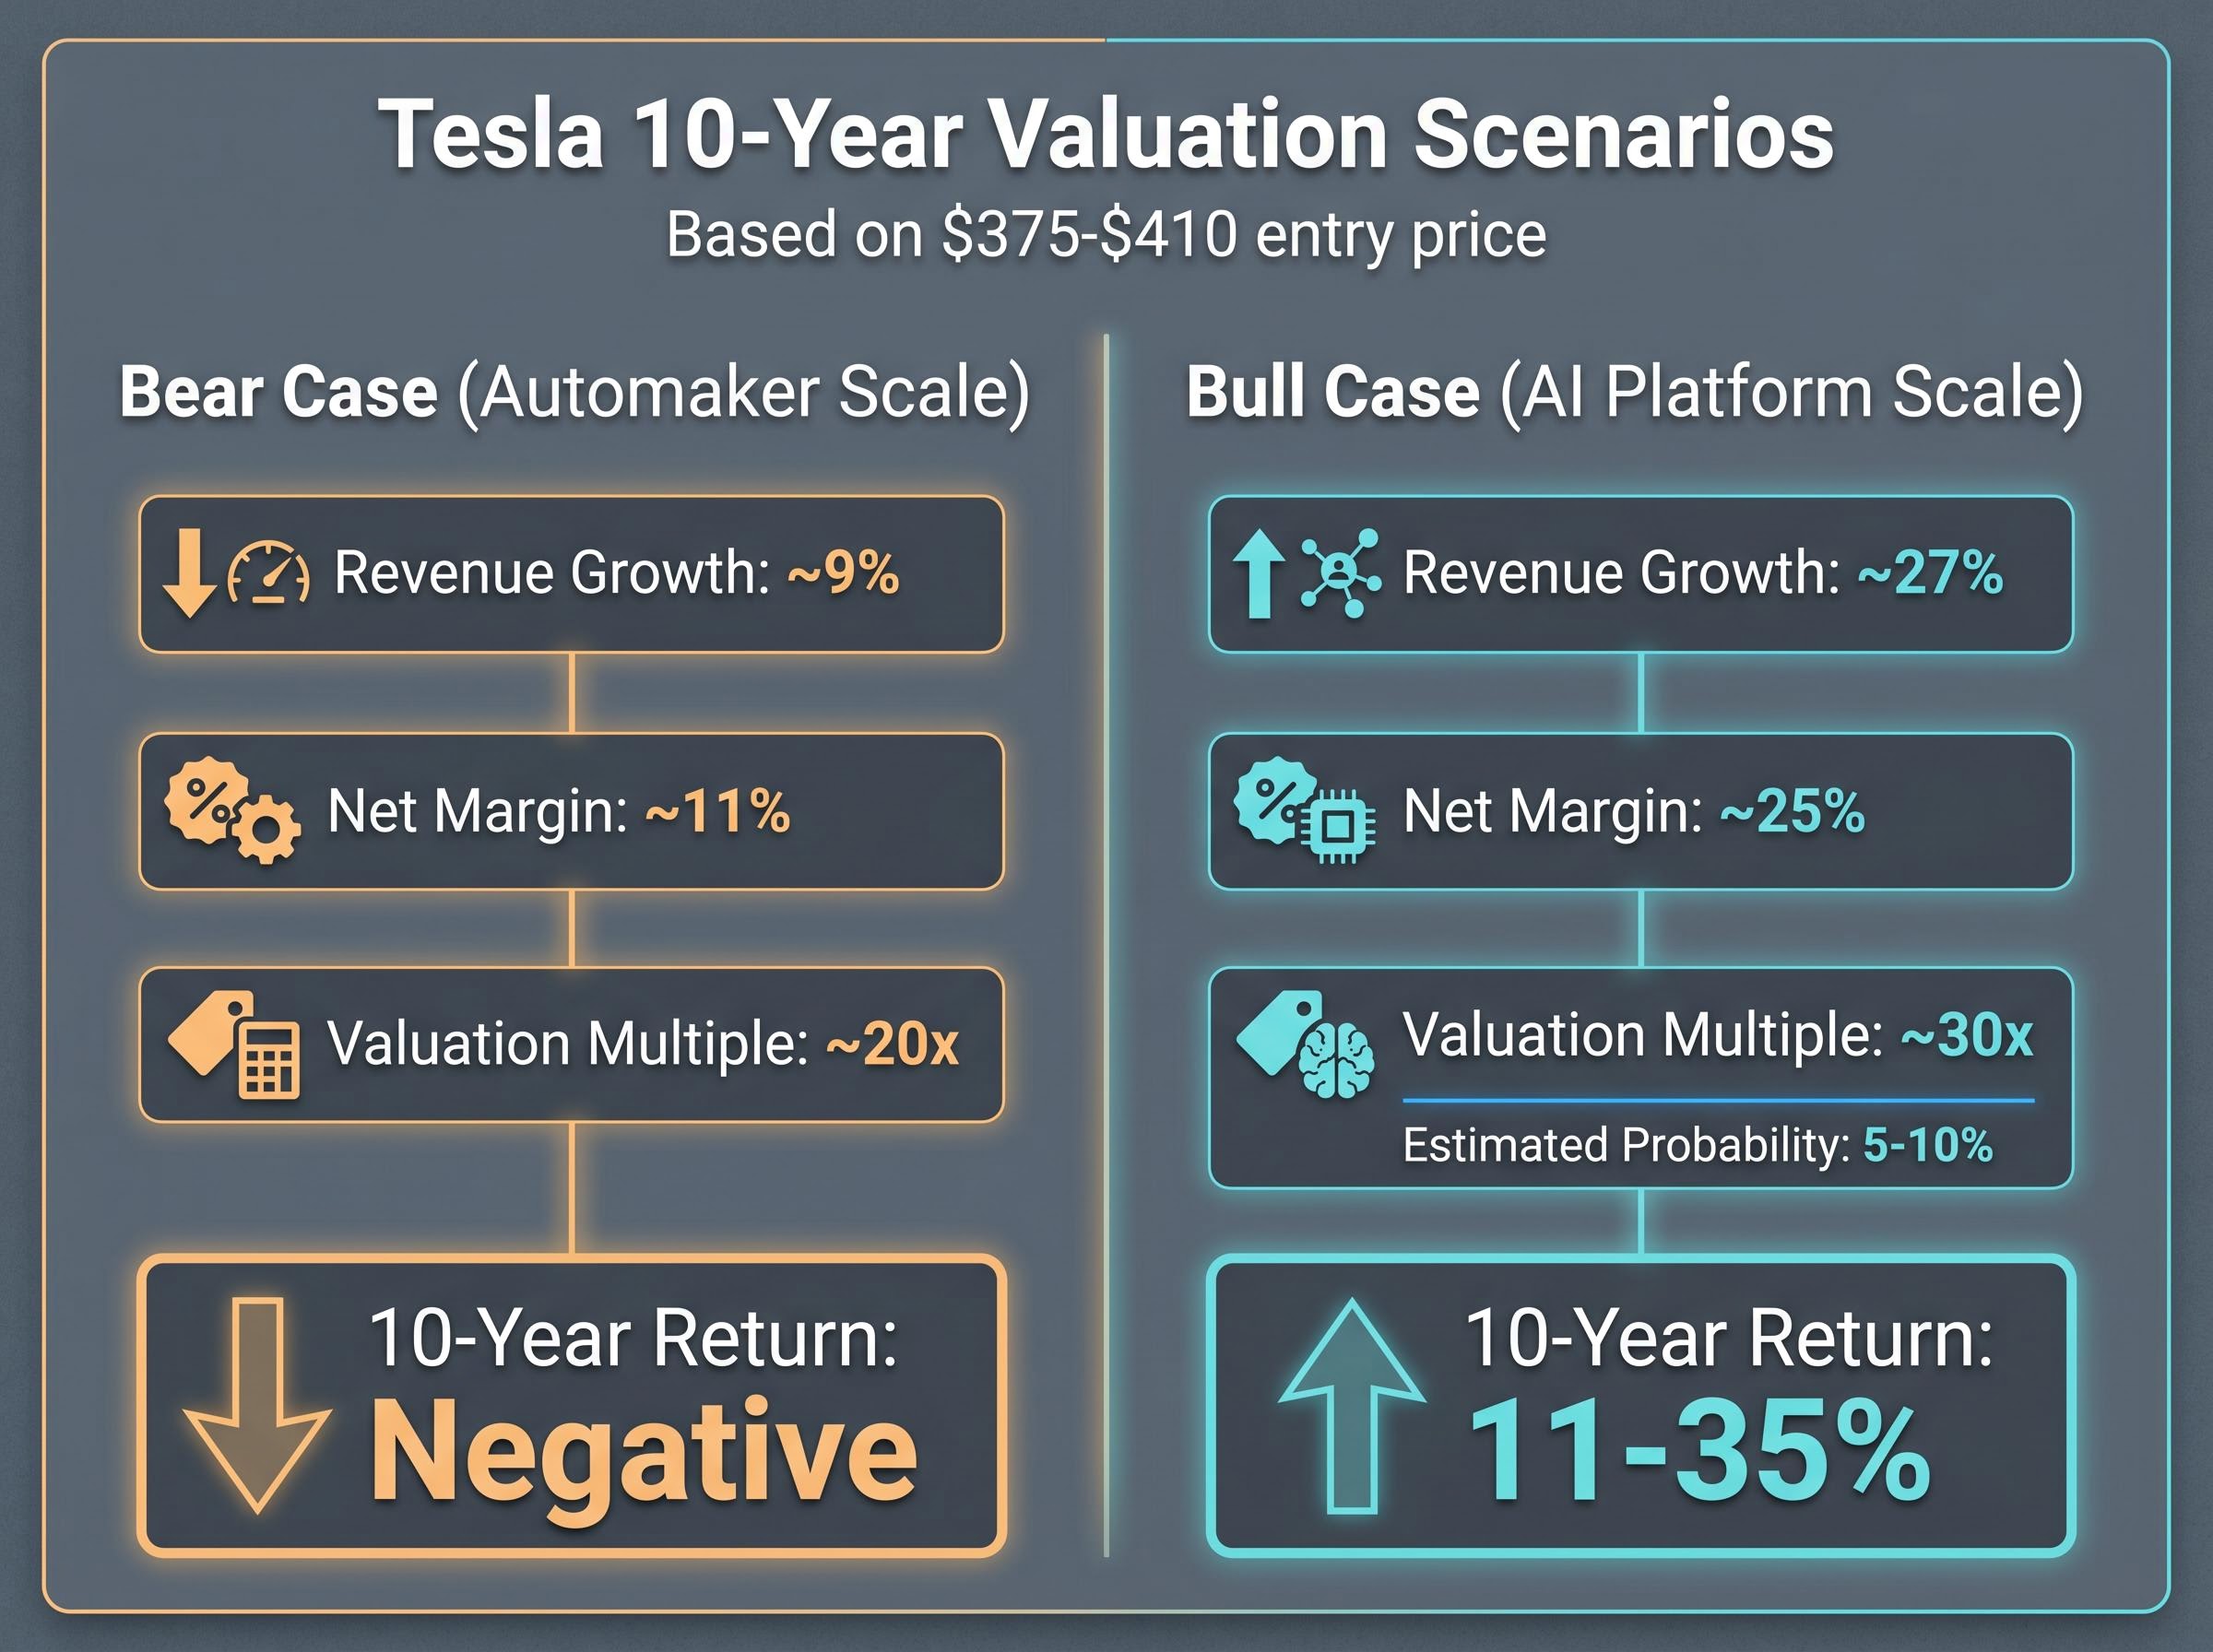
The bull case assumes revenue growth of 20-35% (midpoint approximately 27%), net profit margins of 20-30%, and a valuation multiple of 25-35x. Under these inputs, projected annualised returns over 10 years range from 11% to 35%, depending on where within the range assumptions land. The TIKR mid-case price target of approximately $1,746 represents an extreme bull outlier, embedding full AI platform economics. Mainstream Wall Street consensus of $398-$406 sits far below, anchored to near-term earnings.
The bear case assumes revenue growth of 6-12% (midpoint 9%), net profit margins of 8-14%, and a valuation multiple of 18-22x. At an entry price of approximately $375-$410 per share, every projected return outcome under the bear case is negative.
| Assumption | Bear Case | Bull Case |
|---|---|---|
| Revenue Growth (midpoint) | ~9% | ~27% |
| Net Profit Margin (midpoint) | ~11% | ~25% |
| Valuation Multiple (midpoint) | ~20x | ~30x |
| Projected 10-Year Annualised Return | Negative | 11-35% |
The gap is explained by what drives each scenario. In the bear case, Tesla is a strong EV company with above-average automotive margins (better than Ford or GM), but it is valued as a tech platform. The multiple it deserves contracts sharply toward its actual business model, compressing returns even with decent earnings growth. Operating margin currently sits at 4.2%; the bull case requires net margins of 20-30%, illustrating the scale of transformation needed.
At current prices, every bear-case return outcome is negative. The price contains no compensation for the risk that the transformation does not happen.
Standard valuation methods were designed for businesses with relatively predictable earnings trajectories. Price-to-earnings ratios assume a stable relationship between current earnings and future growth. Discounted cash flow models require assumptions about future cash flows that, for a stable business, fall within a reasonable range. Apply either method to a company actively shedding one identity for another, and the outputs diverge wildly depending on which business model the analyst assumes.
Tesla sits at the centre of this problem. Depending on the analyst’s framework, the company is classified as consumer discretionary or as a technology and AI platform. That disagreement is not a classification error. It is a genuine reflection of the business model ambiguity investors must price. When a stock’s current price embeds a transformation that has not yet happened, the investor is not simply buying today’s business but taking a position on the probability that a different, higher-margin business replaces it on a specific timeline.
Three conditions signal a company is in genuine transition:
Tesla meets all three. Operating margin has compressed to approximately 4.2%, down from a prior peak of approximately 11%, reflecting competitive pressure on the automotive business. BYD has surpassed Tesla as the world’s largest EV producer by volume, a concrete signal that the core business faces structural headwinds. Analyst EPS estimates for Tesla declined more than 90% from their peak before recovering in forward projections, and that recovery incorporates expected AI and autonomy contributions that have not yet generated material revenue.
Traditional automakers trade at 18-22x earnings. Software and AI platforms command 25-35x and above. Tesla’s price implies the market is assigning it the higher multiple. Elon Musk explicitly frames Tesla as an AI and robotics enterprise, not an automaker, and that framing is not merely rhetorical. It is the entire basis for the premium valuation. If Tesla is an automaker, it is among the most expensive in history. If it is an AI platform, the price may prove a bargain. The investor’s first task is deciding which classification to accept.
Automotive sector valuation multiples have historically averaged around 17x earnings, making the gap between what Tesla would be worth as a car company and what the market currently assigns it one of the most concrete illustrations of transformation premium in the equity market.
The bull case depends on specific milestones that either confirm or deny the transformation timeline. Robotaxi service has expanded to Dallas and Houston, with plans for approximately a dozen states by year-end 2026. Active Full Self-Driving (FSD) subscriptions, the number of paying users of Tesla’s advanced driver-assistance software, reached 1.28 million as of Q1 2026, a record quarter. California, one of the most strategically significant markets, has seen no commercial autonomous vehicle service permits filed as of May 2026.
The California DMV autonomous vehicle deployment program establishes the permit requirements manufacturers must satisfy before operating commercially in the state, which is why the absence of any Tesla filing under this framework as of May 2026 is a concrete, trackable data point rather than a qualitative assertion about regulatory readiness.
Execution timelines on transformational promises carry historical risk in Tesla’s case specifically. Musk’s 2016 full self-driving hardware claim, his 2019 prediction of one million robotaxis by 2020, and the 2021 Optimus deployment-by-2022 claim all illustrate a pattern worth calibrating against.
Musk’s innovations have historically materialised, but at lesser scale and later timing than announced. This pattern does not invalidate the thesis; it does, however, widen the confidence interval around any stated timeline.
Competitive dynamics further complicate the timeline. Waymo operates approximately 6,000-7,000 cars across approximately 20 cities commercially in 2026. Chinese manufacturers represent a growing competitive threat in both EV and humanoid robotics. The window for Tesla to establish a durable competitive position is not indefinitely open.
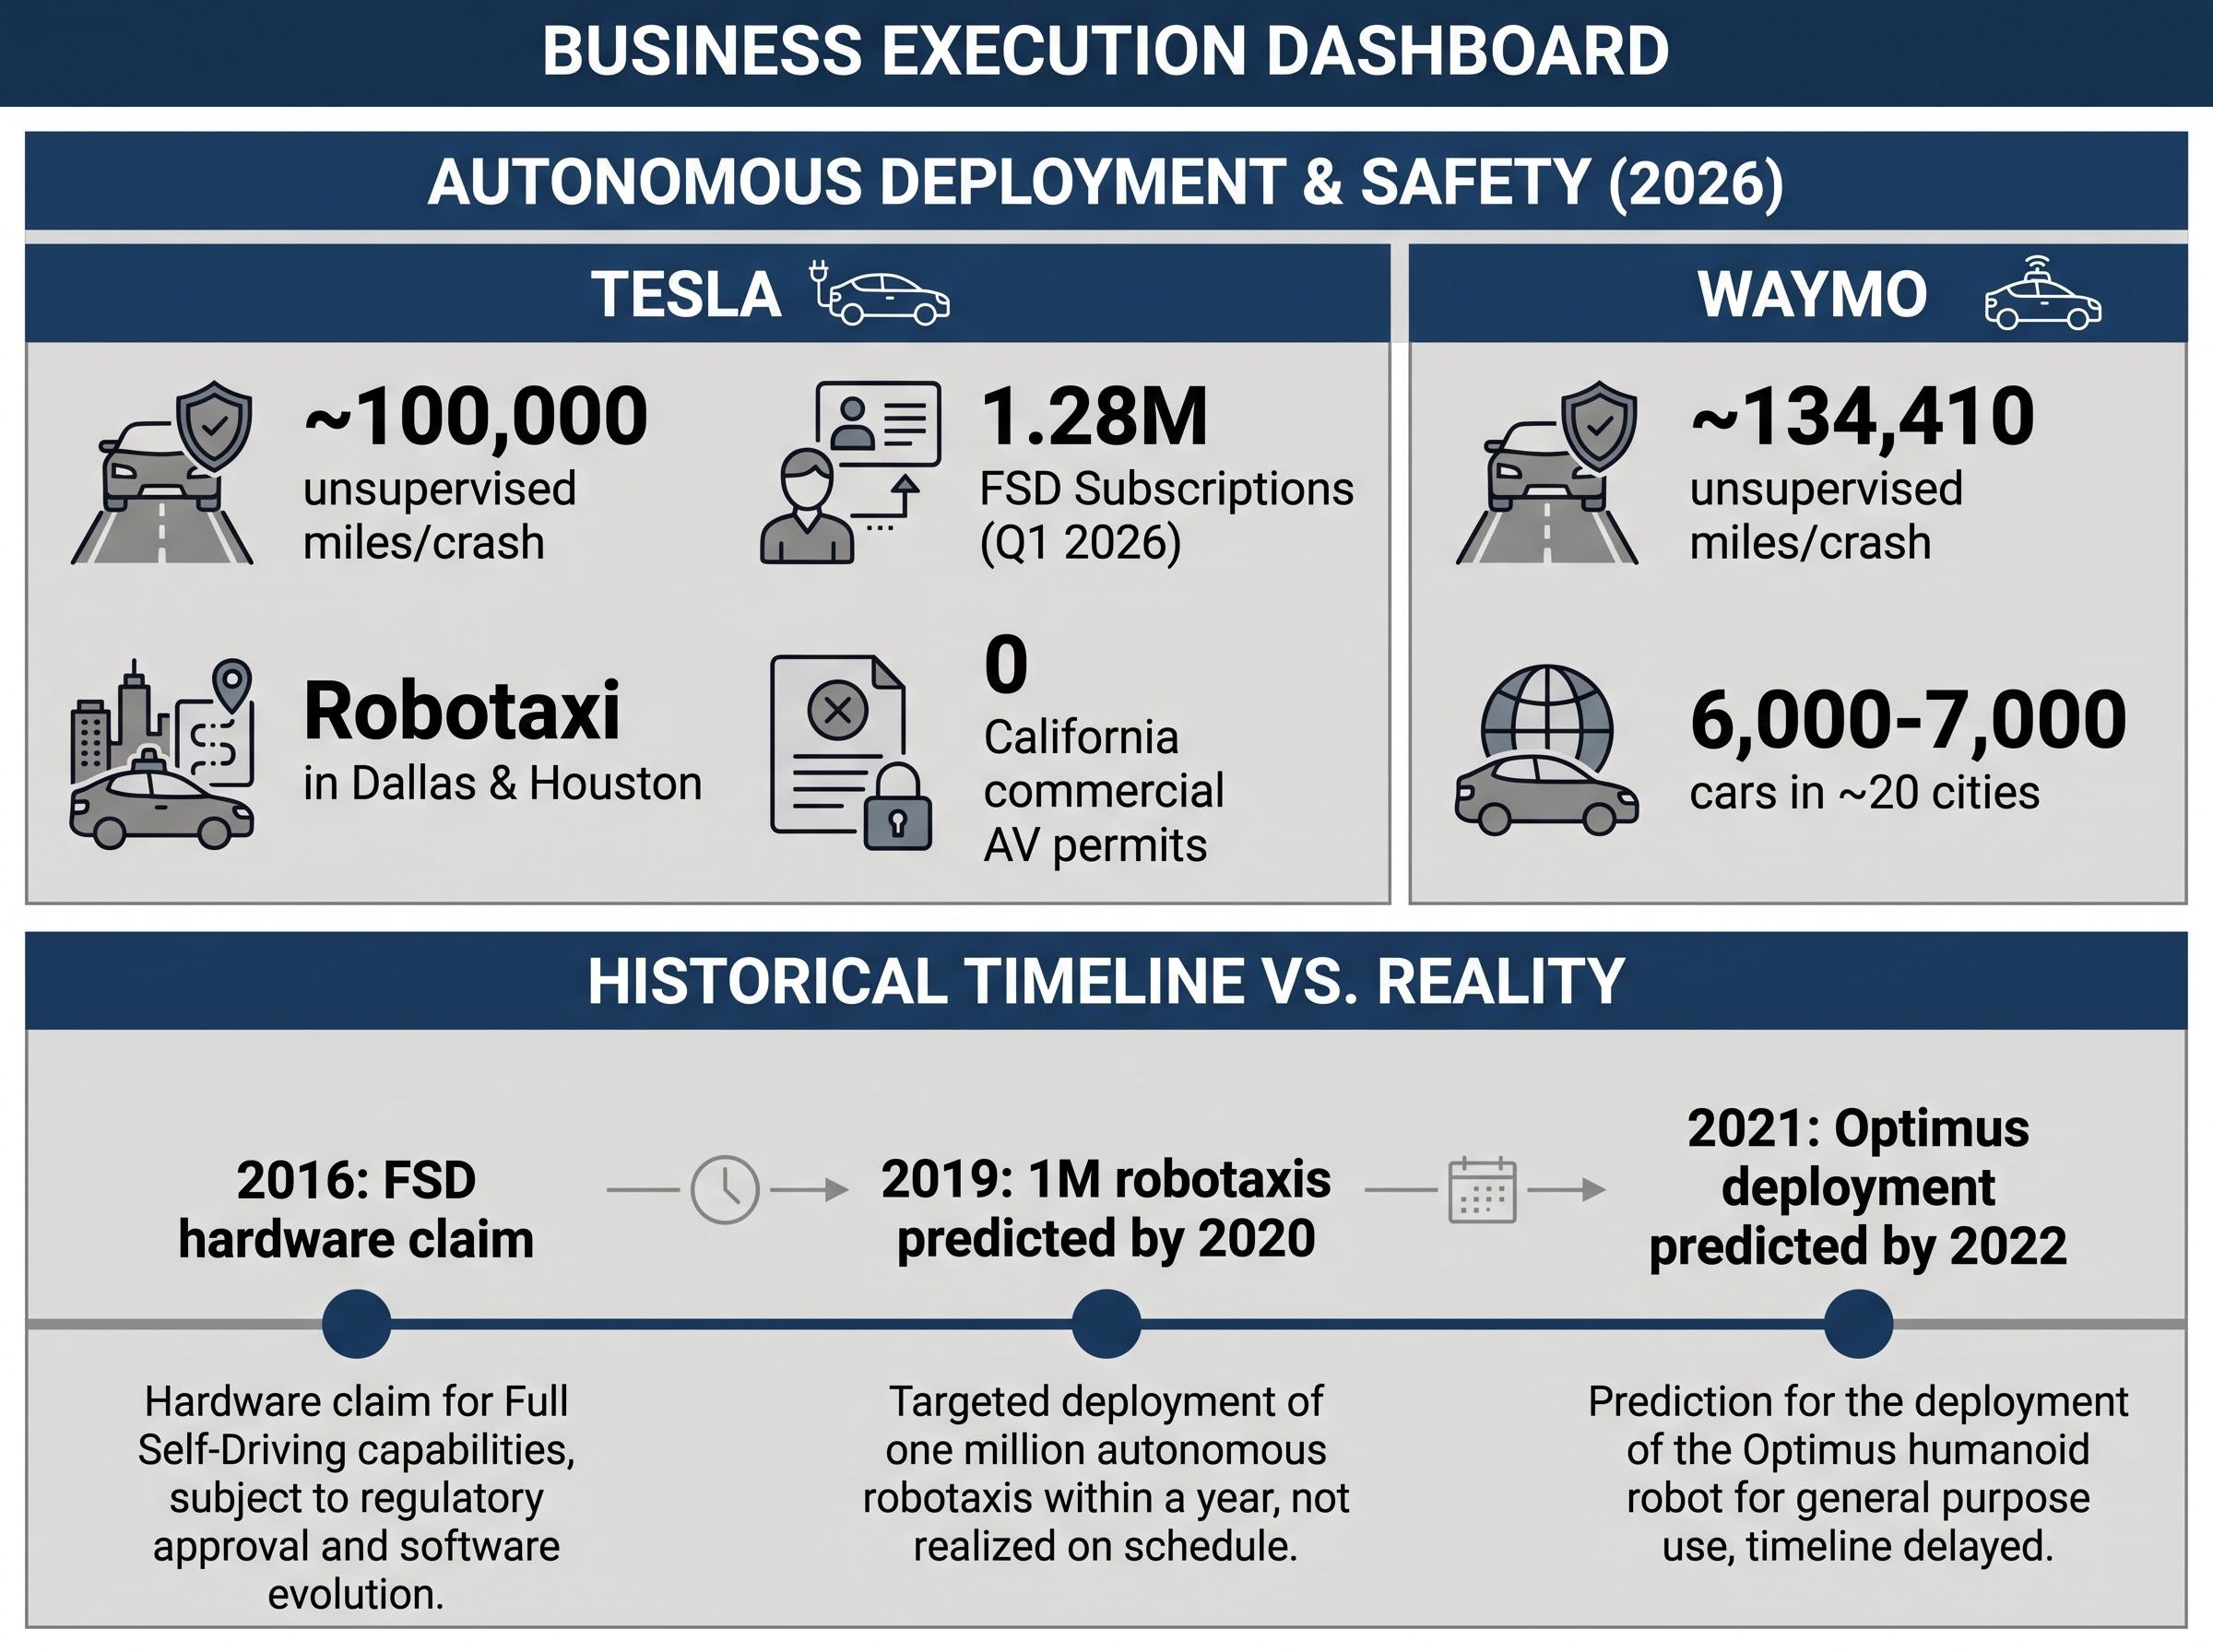
Tesla’s safety metrics show progress: approximately 100,000 unsupervised miles per crash versus Waymo’s approximately 134,410, demonstrating improvement without confirming commercial parity. The $25 billion+ CapEx commitment represents the scale of investment that must generate future returns to justify current valuation.
Four specific metrics to monitor quarterly to track bull case progress:
A stock is priced for perfection when its current market price can only be justified if the most optimistic assumptions about its future business model are correct and executed on time. This is not a vague market phrase. It describes a specific mathematical condition: the entry price is high enough that the bull case is required to produce even a reasonable return, and any outcome short of the bull case produces underperformance or losses.
Entry price is the mechanism that makes this concrete. Two investors who buy the same asset at different prices own the same business, but their return outcomes diverge because the price paid determines how much future growth has already been paid for versus how much remains available as return. Tesla shares were available at approximately $100 per share a few years prior to the analysis period. At approximately $410 in May 2026, the investor at today’s price has already paid for years of earnings growth that the $100 buyer captured as return.
Forward analyst estimates project EPS growing more than 5x from current levels, but that projection already incorporates autonomy and AI contributions, which generate no material revenue in 2026. Tesla’s $25 billion+ 2026 capital expenditure commitment is expected to produce negative free cash flow for the full year, meaning the future earnings those projections rely on require the capital investment to generate the expected returns. The growth is not free; it is being purchased at significant cost to near-term cash generation.
Three questions investors should answer before committing capital to any transitional company:
Calculating a probability-weighted expected return converts three narrative scenarios into a single number that can be tested directly against a required rate of return, making the investment decision explicit rather than leaving it to whichever scenario the investor finds most compelling.
Expected value thinking changes how headline return numbers should be interpreted. If the bull case offers 35% annualised returns but carries only a 5-10% probability of materialising, and the bear case offers negative returns with a much higher probability, the probability-weighted expected return may be negative even though the bull case headline number looks attractive. The research explicitly characterises the full bull case, complete AI platform transition, as low-probability in the 5-10% range. That base-rate information should anchor the analysis before the headline return figure captures attention.
The framework used throughout this analysis transfers to any company where current earnings do not explain current price, from biotech to AI infrastructure to clean energy. The core methodology follows five steps:
For investors who want to understand why small errors in each of the three scenario inputs multiply dramatically over a ten-year horizon, our deep-dive into compounding valuation errors examines how simultaneous misestimates of revenue growth, margin, and exit multiple interact across the full modelling period, with worked examples using Tesla’s Q1 2026 base figures.
Consensus analyst targets, $398-$406 in Tesla’s case, serve as a market-calibration anchor rather than a valuation conclusion. They reflect near-term earnings estimates rather than scenario-based long-horizon modelling. If the bear case offers negative returns and the bull case offers 11-35% with low probability, the investor must evaluate whether the probability-weighted return justifies holding the stock over simply holding the index.
The tax dimension matters for US investors. Long-term capital gains rates of 0-20% depending on income bracket affect after-tax return calculations, which is relevant when comparing scenario-based projected returns against benchmark alternatives.
IRS Topic 409 capital gains rates set the long-term rates at 0%, 15%, or 20% depending on taxable income, meaning a US investor comparing a scenario-projected 11% annualised return against an index alternative should apply the relevant bracket to both sides of that comparison before treating the nominal difference as a true advantage.
Three primary research sources support this methodology. SEC EDGAR provides 10-K (annual) and 10-Q (quarterly) filings with verified financials; Tesla’s Q1 2026 filing (tsla-20260422) is a concrete starting point. Earnings call transcripts offer management guidance on CapEx and margin trajectory. Financial data platforms such as Bloomberg and Yahoo Finance provide consensus analyst estimates and peer P/E comparisons for benchmarking.
Management guidance should be evaluated in the context of historical accuracy. Tesla’s CapEx guidance of $25 billion+ and negative full-year free cash flow are management’s own projections, not analyst estimates, and may represent a floor rather than a ceiling for capital intensity.
Q1 2026 confirmed near-term execution: $22.4 billion in revenue, $0.41 adjusted EPS representing 52% year-on-year growth from $0.27, and gross margin of approximately 21%. The consensus analyst price target of $398-$406 implies that this execution is already fully priced at current levels near $410.
For investors who assign high probability to the full AI platform transition, Tesla at $410 may offer compelling long-term returns. For investors who assign high probability to the bear scenario, where Tesla remains a strong EV company without material AI or robotics revenue, the stock offers negative projected returns with no margin of safety built into the price. The most likely outcome, based on the research synthesis, may be partial execution: an intermediate scenario between full bull and bear that itself may not justify the current multiple.
The goal of scenario-based valuation is not to predict which scenario will happen, but to know precisely what you are betting on before committing capital, and to price that bet honestly against the alternatives available.
This article is for informational purposes only and should not be considered financial advice. Investors should conduct their own research and consult with financial professionals before making investment decisions. Past performance does not guarantee future results. Financial projections are subject to market conditions and various risk factors.
Stock valuation scenario analysis is a structured method of evaluating a company by building multiple internally consistent models, each combining a revenue growth rate, net profit margin, and valuation multiple, to test what range of outcomes a current share price already reflects rather than relying on a single forecast.
The three levers are projected revenue growth rate, net profit margin at maturity, and the valuation multiple applied to those mature earnings; all three must be internally consistent with each other or the scenario loses its analytical integrity.
Entry price determines how much future growth has already been paid for versus how much remains available as return, meaning two investors who buy the same stock at different prices will experience meaningfully different outcomes even if the underlying business performs identically.
Three conditions signal genuine transition: the company operates in one sector but is valued as though it belongs to another, different analyst research desks assign it to different sectors or peer groups, and current operating metrics diverge sharply from the forward projections embedded in the share price.
Each scenario should be assigned a probability based on historical base rates, management track record, and competitive dynamics, and the probability-weighted expected return should then be compared against a benchmark alternative such as the S&P 500 to determine whether the risk-adjusted opportunity justifies the position.


