
How to Value a Stock When the P/E Ratio Is Meaningless
13 mins ago

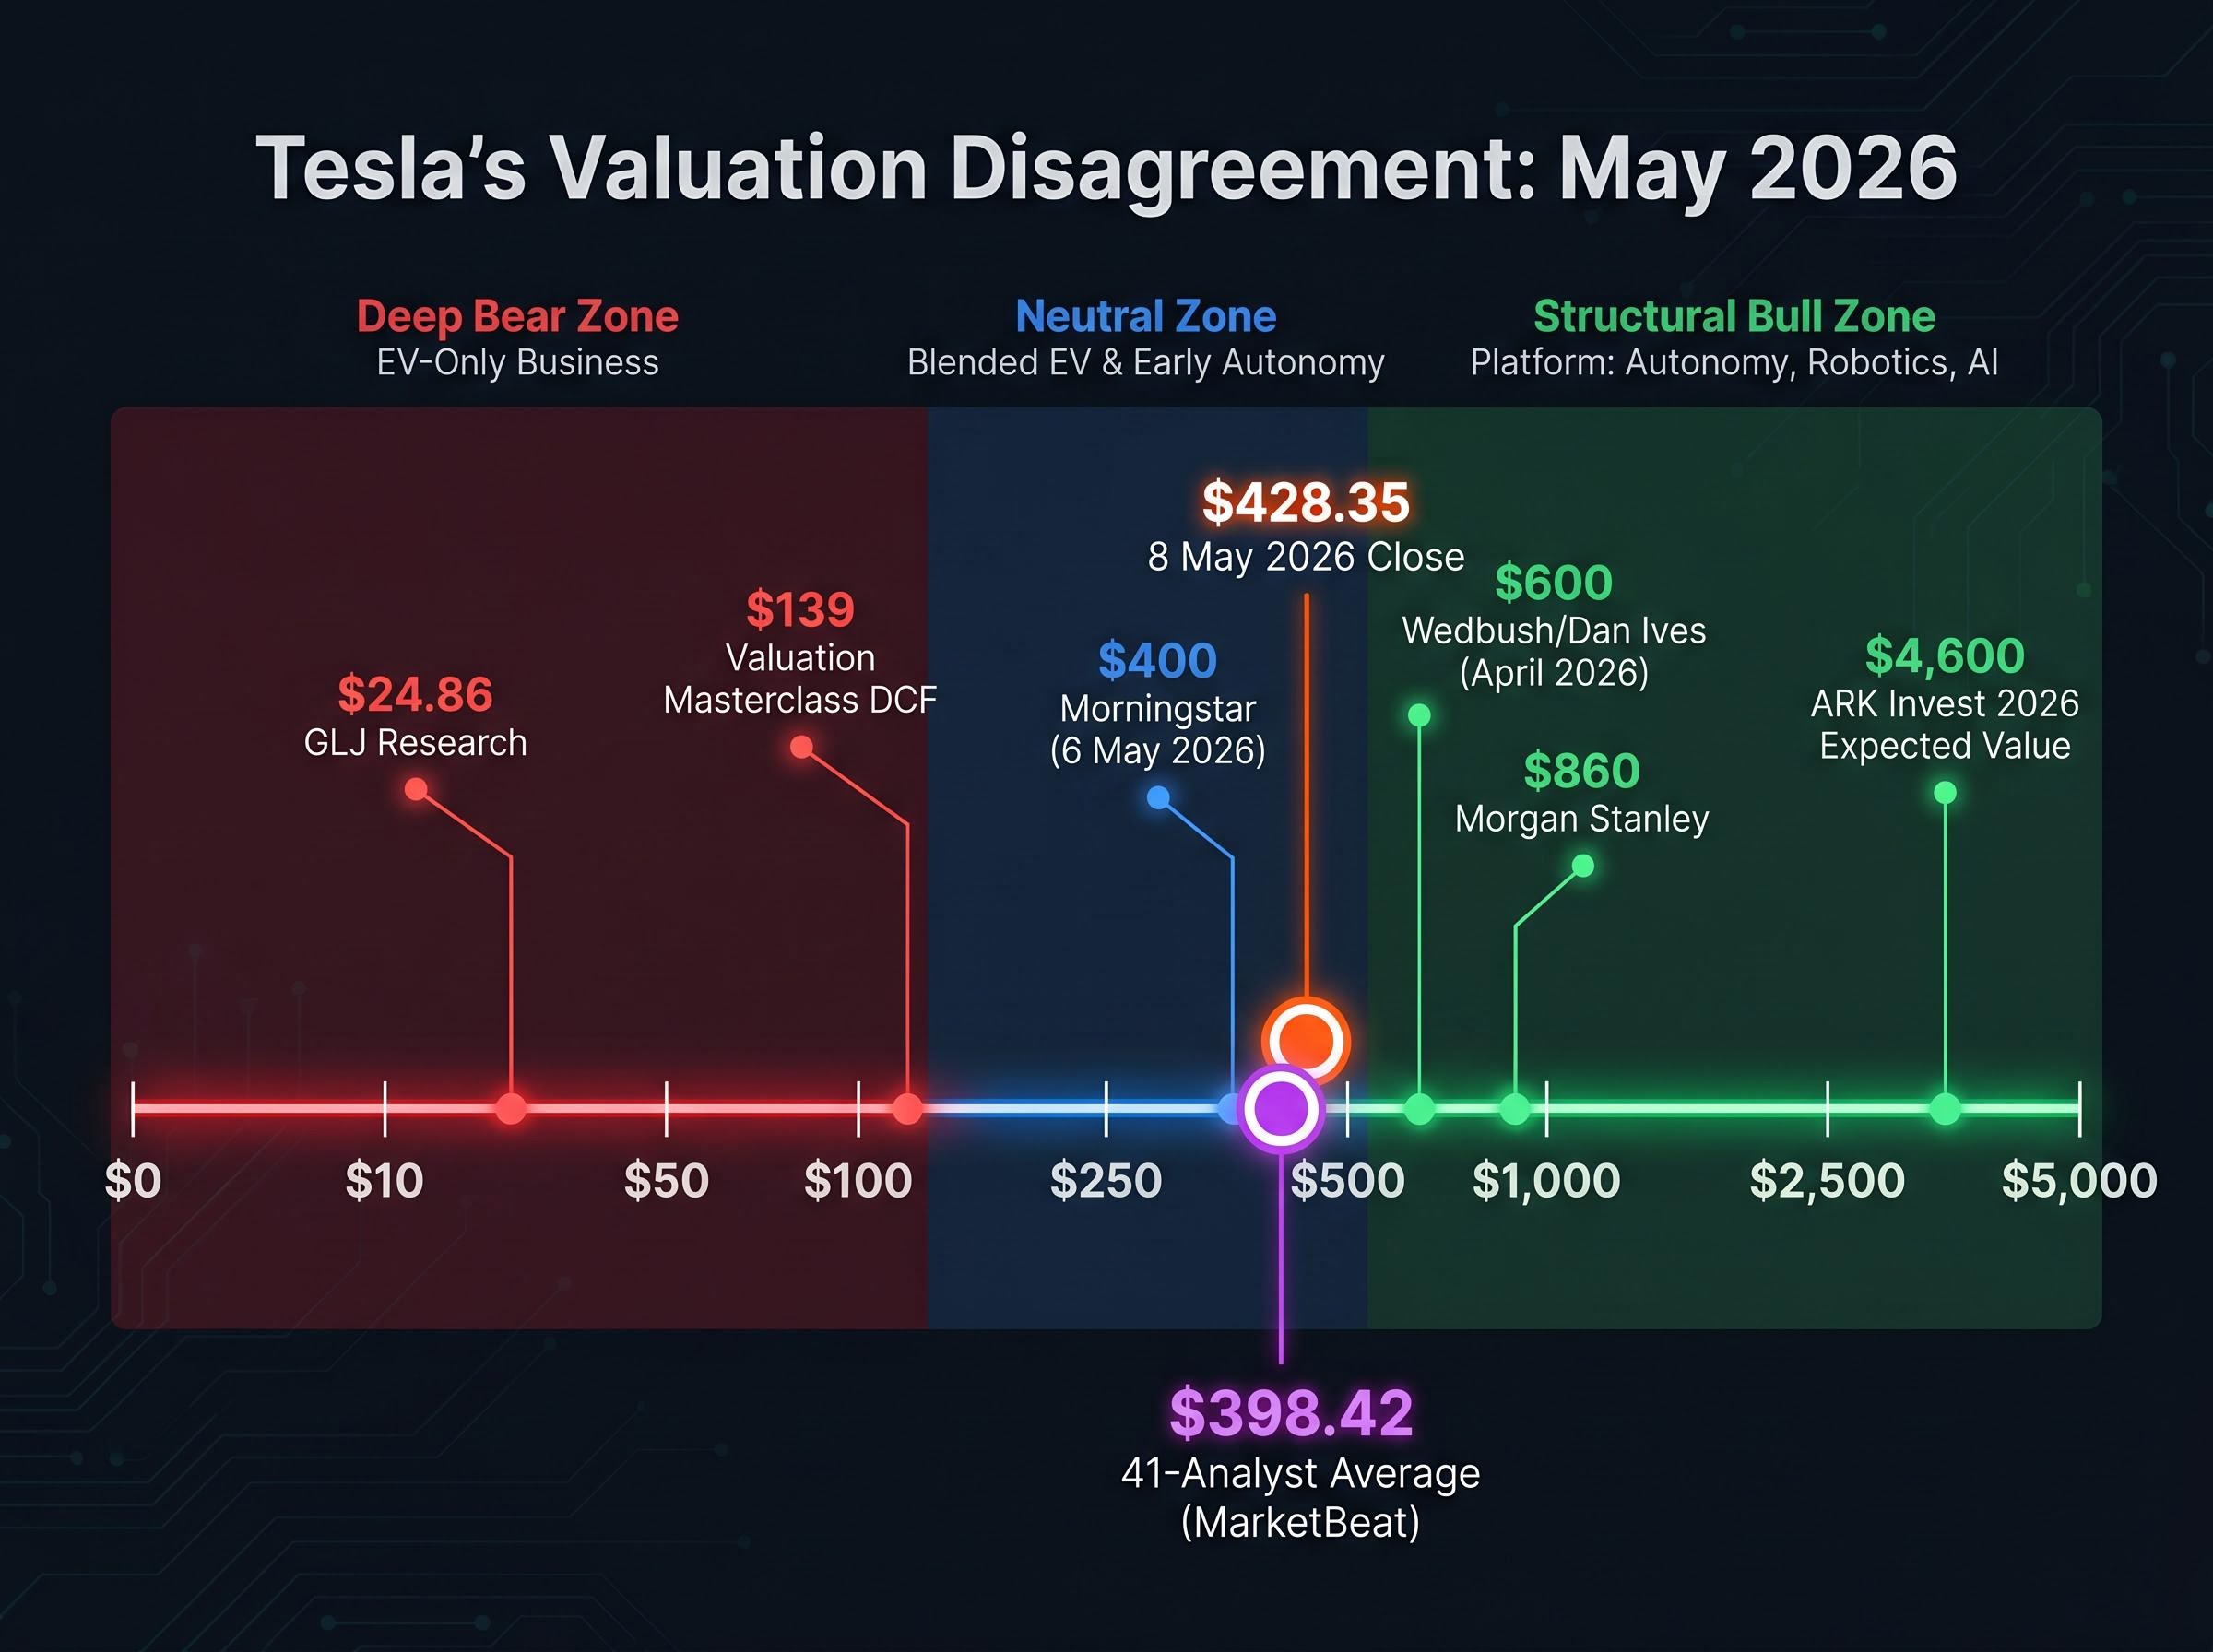
Tesla shares closed at $428.35 on 8 May 2026. Analyst price targets for the same stock span from $24.86 to $4,600. That is not a measurement error. It is a map of the entire intellectual problem investors face when a company’s valuation depends less on what it earns today than on what it might become. Tesla’s Q1 2026 earnings beat, with revenue of $22.4 billion and gross margins of 21.7% against a 17% consensus expectation, did not resolve the question at the heart of the disagreement: is this an electric vehicle manufacturer or an AI and robotics platform? When the answer is genuinely unknown, standard single-point analysis breaks down. This guide uses Tesla’s bull and bear case numbers as a live teaching instrument to show how to construct scenario-based stock valuation analysis, why entry price is one of the most consequential variables in that framework, and how to think clearly about risk when the market is pricing a transformation that has not yet happened.
Traditional discounted cash flow (DCF) analysis, a method that estimates a company’s value by projecting its future cash flows and discounting them back to today’s dollars, assumes a relatively stable business trajectory. That assumption becomes unreliable when a company is simultaneously operating an existing business and betting on an unproven one. The valuation outcome becomes more sensitive to the assumed business model than to any individual financial input.
Tesla is an extreme but instructive version of this problem. As of 8 May 2026, 41 analysts covering the stock produce an average price target of $398.42, according to MarketBeat. The range runs from $24.86 (GLJ Research, which treats Tesla as an EV business facing margin compression) to $4,600 (ARK Invest’s 2026 expected value, which prices full AI and autonomy scaling). The $139 DCF fair value from Valuation Masterclass, using a 10.6% weighted average cost of capital, sits squarely in the EV-only camp.
“The wide analyst dispersion ($24.86 to $4,600) is not noise. It reflects a genuine disagreement about whether Tesla should be valued as an EV manufacturer or as an AI and autonomy platform.”
The three distinct analyst camps break down along these lines:
The concept that connects these camps is “story probability,” the idea that investors must assign an explicit likelihood to whether the transformation thesis materialises, not just model the outcome if it does. Understanding why analyst dispersion this wide is intellectually coherent, rather than chaotic, is the prerequisite for using scenario analysis correctly.
A reverse DCF methodology complements the forward scenario approach by working backwards from the current share price to reveal what earnings growth rate the market is implicitly demanding, a calculation that often makes the bull case requirements uncomfortably concrete.
A scenario-based DCF rests on three core inputs, each mapping to a different part of the business thesis. Revenue growth rate reflects a view on market size and competitive positioning. Net profit margin captures operating leverage and cost discipline. The terminal valuation multiple (how much the market will pay per dollar of earnings at the end of the forecast period) encodes a judgment about the company’s long-term quality.
Each input functions as a dial. Turning one changes the output. Turning all three in the same direction creates the spread between scenarios. The discipline is in choosing those inputs deliberately rather than defaulting to consensus.
Damodaran’s probabilistic approaches in valuation lay out precisely this distinction: sensitivity analysis and scenario analysis are structured methods for making uncertainty explicit rather than hiding it inside a single-point forecast, and the discipline of assigning explicit probabilities to each scenario is what separates rigorous analysis from optimistic storytelling.
A practical three-scenario structure for a company like Tesla might use the following inputs:
| Scenario | Revenue Growth Rate | Net Profit Margin | Valuation Multiple |
|---|---|---|---|
| Bear | ~10% | ~12% | 18-22x earnings |
| Base | ~15% | 18-22% | 22-28x earnings |
| Bull | 30%+ | 25%+ | 25-35x earnings |
Each scenario should represent a coherent, internally consistent story about the business. The bear case is not simply the base case with lower numbers. It is a different thesis: Tesla as an EV company facing margin pressure. The bull case is not optimism dialled up. It is a platform thesis where autonomy and robotics generate revenue streams that do not yet exist at commercial scale.
The weighted average cost of capital (WACC), the rate used to discount future cash flows back to present value, sits between 9% and 14% for a company like Tesla, depending on the risk assumptions applied. Aswath Damodaran of NYU Stern (pages.stern.nyu.edu/~adamodar), a leading academic advocate for explicit probability assignment in transition-company valuations, has stressed that WACC selection is among the most consequential choices an analyst makes.
A higher WACC compresses the present value of far-future cash flows disproportionately. Bull cases, where most of the value concentrates in years seven through ten of the forecast, are especially sensitive. A 2-percentage-point WACC change can shift a DCF output by 20-30% for long-duration growth companies, making the discount rate one of the most powerful inputs an analyst controls.
The bear case is not pessimism for its own sake. It is a disciplined attempt to price the business that actually exists today, separate from the one that might exist in 2030.
Start with the EV-only business. BYD has overtaken Tesla in global EV volume. Margins have compressed from prior peak levels. The global competitive field continues to intensify. Under these conditions, the bear scenario assigns Tesla a revenue growth rate of 6-12% (a 9% midpoint), net profit margins of 8-14%, and a valuation multiple of 18-22x earnings.
Anchoring those inputs to Tesla’s Q1 2026 actual gross margin of 21.7%, the bear case implies a regression toward 8-14% as competition erodes pricing power. The resulting price targets sit well below the current share price: GLJ Research’s $24.86 and the Valuation Masterclass DCF’s $139 represent the range of this scenario’s outputs.
The bear case’s three risk assumptions carry specific weight:
The $25 billion+ in projected 2026 capital expenditure, referenced by Tesla’s CFO during the Q1 2026 earnings call, compounds the cash flow risk under this scenario. Heavy investment spending with limited near-term autonomy revenue creates a drag that the EV business must absorb alone.
At approximately $375-$428 per share, all projected 10-year return outcomes under bear case assumptions were negative. The current price embeds a substantial AI and robotics premium that the EV business alone cannot justify.
The transferable skill here is stripping out unproven optionality to find the floor value of the existing business. That floor is what an investor is buying at minimum, regardless of how the transformation plays out.
The bull case is not speculation. It is a legitimate, internally consistent investment thesis built on three transformation pillars present in Tesla’s Q1 2026 earnings narrative.
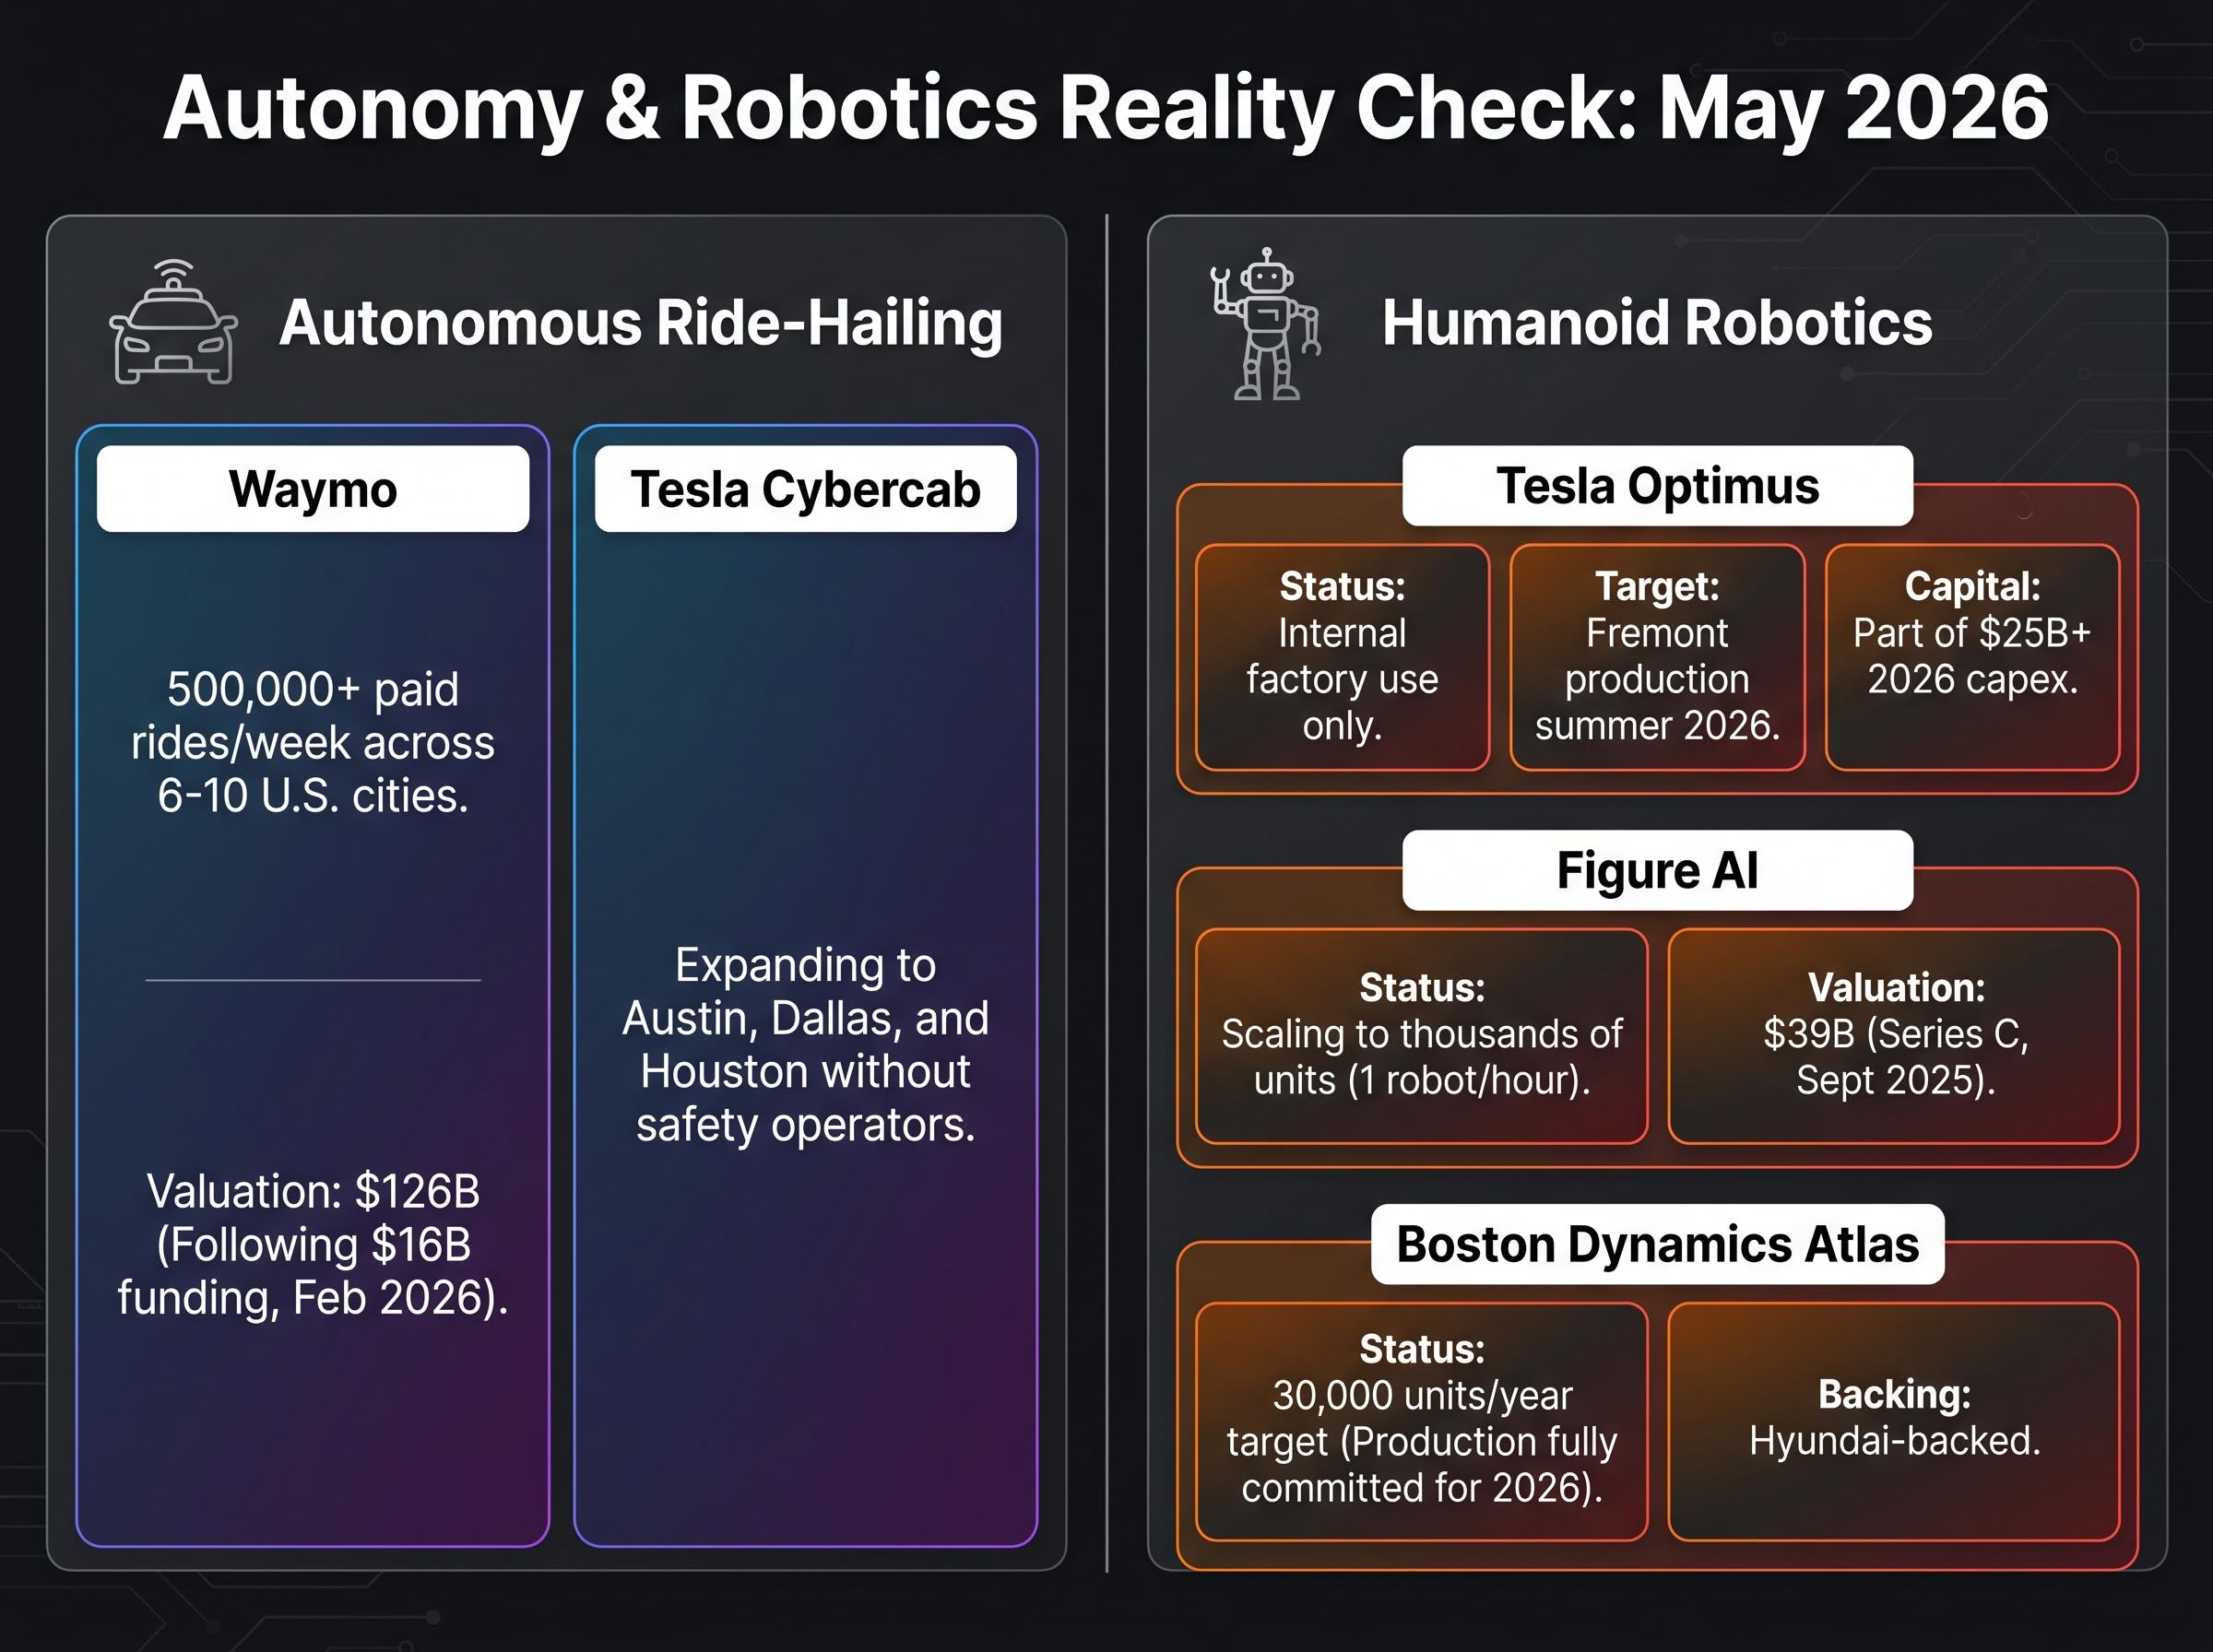
Cybercab, the autonomous ride-hailing service, is expanding to Austin, Dallas, and Houston without safety operators. Optimus, the humanoid robot programme, has a Fremont factory conversion targeting summer 2026 production start. The AI5 chip development programme aims to underpin both initiatives with proprietary hardware.
Under bull assumptions, revenue growth reaches 20-35% (a 27% midpoint), net profit margins expand to 20-30%, and the market assigns a 25-35x earnings multiple reflecting platform economics. These inputs produce 11-35% annualised 10-year returns, a genuinely attractive range for a large-cap investment. Analyst targets in this camp include Wedbush’s $600 (Outperform, reiterated April 2026 by Dan Ives), Morgan Stanley’s bull case up to $860, and ARK Invest’s $4,600 2026 expected value.
The execution gaps, however, are substantial. Waymo’s competitive position illustrates the distance Tesla must close: 500,000+ paid rides per week, a $126 billion valuation, and operations across multiple U.S. cities. In humanoid robotics, Tesla Optimus has no confirmed external commercial deployments as of early 2026.
| Company | Deployment Status (May 2026) | Capital/Valuation Milestone |
|---|---|---|
| Tesla Optimus | Internal factory use only; Fremont production targeting summer 2026 | Part of Tesla’s $25B+ 2026 capex allocation |
| Figure AI | Scaling to thousands of units; one robot per hour production rate | $39B valuation (Series C, September 2025) |
| Boston Dynamics Atlas | Production fully committed for all of 2026; 30,000 units/year target | Hyundai-backed; tens of thousands of deployments planned |
Elon Musk’s own timeline track record adds a calibration data point. In 2016, he claimed full self-driving hardware readiness. In 2019, he projected one million robotaxis by the end of 2020. In 2021, he claimed Optimus deployment-readiness by 2022. Each deadline was missed.
Practitioner consensus referenced in the research places the probability of the full bull case materialising at approximately 5-10%. This number changes everything.
Buying at a price that embeds the bull case while assigning it only a 5-10% probability produces a negative expected value, regardless of how attractive the bull outcome looks in isolation. The arithmetic is straightforward: expected value equals (probability of bull outcome multiplied by bull return) plus (probability of bear outcome multiplied by bear return). When the bear outcome carries a 90-95% probability weight and produces negative returns at the current price, the maths works against the investor even when the bull scenario is genuinely compelling.
The question is not “could this happen?” It is “how likely is this, and what am I paying for that probability?”
An investor who purchased Tesla shares at approximately $100 per share, a price available a few years prior to the analysis date, faces a structurally different risk profile than an investor considering entry at $428.35 today. The views on Tesla’s long-term future may be identical. The investment proposition is not.
At $100, the bear case floor still delivers a positive or break-even outcome. The investor has paid a price low enough that even the EV-only scenario does not produce catastrophic losses. At $428.35, the bear case produces negative 10-year returns across all projected outcomes. The margin of safety has been entirely consumed by the price appreciation.
The mathematical relationship is direct: a higher entry price forces the investor to assign a higher probability to the bull outcome just to achieve the same expected return. At $428.35, the stock already trades above the $398.42 analyst consensus price target. Forward earnings estimates project more than 5x EPS growth, which already incorporates autonomy and AI assumptions. The question for U.S. retail investors evaluating Tesla today is not whether the AI and robotics thesis is intellectually compelling, but whether the current price already embeds too much of that probability to offer adequate compensation for the risk of being wrong.
“Buying at $100 and buying at $428 are not the same bet, even if you believe exactly the same story about where Tesla ends up.”
A three-step entry-price evaluation process applies to any transition-stage company:
The Tesla case study distils into a five-step scenario valuation process that applies to any company where the market is pricing an unproven future:
The base case for Tesla, reflecting blended EV plus early autonomy, produces a price target range of approximately $350-$425, consistent with Morningstar’s $400 fair value (issued 6 May 2026) and the $398.42 analyst consensus. At $428.35, the current price implies the market is assigning a meaningful probability to outcomes above this base case.
Sum-of-the-parts valuation offers a structural alternative to single-scenario DCF for companies like Tesla, separating the mature EV business from speculative autonomy and robotics segments and applying a distinct discount rate to each, which produces a more defensible intrinsic value range than blending incompatible risk profiles into one model.
As Damodaran’s work consistently emphasises, the most dangerous analytical error for companies in transition is treating the bull case as the base case because it is the most exciting story.
This framework is not Tesla-specific. Cloud transition companies migrating from licence revenue to subscription models face the same dual-story problem. Biopharma pipeline companies whose entire valuation rests on a Phase III readout present the same probability calibration challenge. Platform businesses entering adjacent verticals, where the core business is profitable but the new venture is unproven, require the same separation of existing value from optionality.
The central discipline is probability calibration. The bull case is not a reason to buy. The probability-adjusted expected value at the current price is the only basis for an informed decision.
For investors wanting to extend this framework into a more rigorous risk monitoring process, our deep-dive into transition-stage risk variables examines the four specific factors most likely to break a bull case, covering regulatory delay, execution risk on capital-intensive programmes, multiple compression, and management timeline slippage, with guidance on which data points to track each quarter.
The $24.86-to-$4,600 analyst spread is not confusion. It is clarity. Each number is internally coherent given its assumptions. The investor’s job is to assess those assumptions rather than pick a target to follow.
Two questions should be answerable before buying any transition-stage stock. What is the bear-case floor? And what probability does the current price imply for the bull case?
For Tesla as of May 2026, the context is specific. The stock sits at $428.35, above the $398.42 average analyst consensus, implying the market already prices in better-than-base-case execution. Q1 2026 financials were strong: $22.4 billion in revenue (16% growth), $0.40 adjusted EPS versus $0.35 consensus, and 21.7% gross margins versus the 17% expected. Strong current fundamentals do not resolve the valuation question. They sharpen it.
The forward variable that will test which scenario is gaining probability weight over the next four quarters is the $25 billion+ in 2026 capital expenditure guidance. Where that capital flows, and what returns it produces, will shift the story probabilities in real time.
“The goal is not to predict which Tesla scenario wins. It is to understand what price you are paying for each scenario’s probability, and whether that is a trade you want to make.”
This article is for informational purposes only and should not be considered financial advice. Investors should conduct their own research and consult with financial professionals before making investment decisions. Past performance does not guarantee future results. Financial projections are subject to market conditions and various risk factors.
Scenario-based stock valuation analysis is a method where investors build separate financial models for distinct business outcomes, such as a bear case and a bull case, assign explicit probabilities to each, and compute a probability-weighted expected value to compare against the current market price.
Tesla analyst price targets range from $24.86 to $4,600 because analysts fundamentally disagree on whether Tesla should be valued as an EV manufacturer facing margin compression or as an AI and autonomy platform with exponential growth potential, producing coherent but vastly different valuation outputs.
A higher entry price forces an investor to assign a higher probability to the bull case just to achieve the same expected return; at Tesla's $428.35 price, the bear case produces negative 10-year returns, while an earlier entry around $100 would have preserved a margin of safety even under conservative assumptions.
The weighted average cost of capital (WACC) is the discount rate applied to future cash flows to convert them into present value; for a growth company like Tesla, a 2-percentage-point change in WACC can shift the DCF output by 20-30%, making it one of the most consequential inputs in any valuation model.
Identify the competing business model stories, assign distinct revenue growth, margin, and multiple inputs to each scenario, run independent DCF calculations, assign explicit story probabilities based on execution risk and competitive positioning, then compare the probability-weighted expected value to the current share price to determine whether adequate compensation exists for the downside risk.


