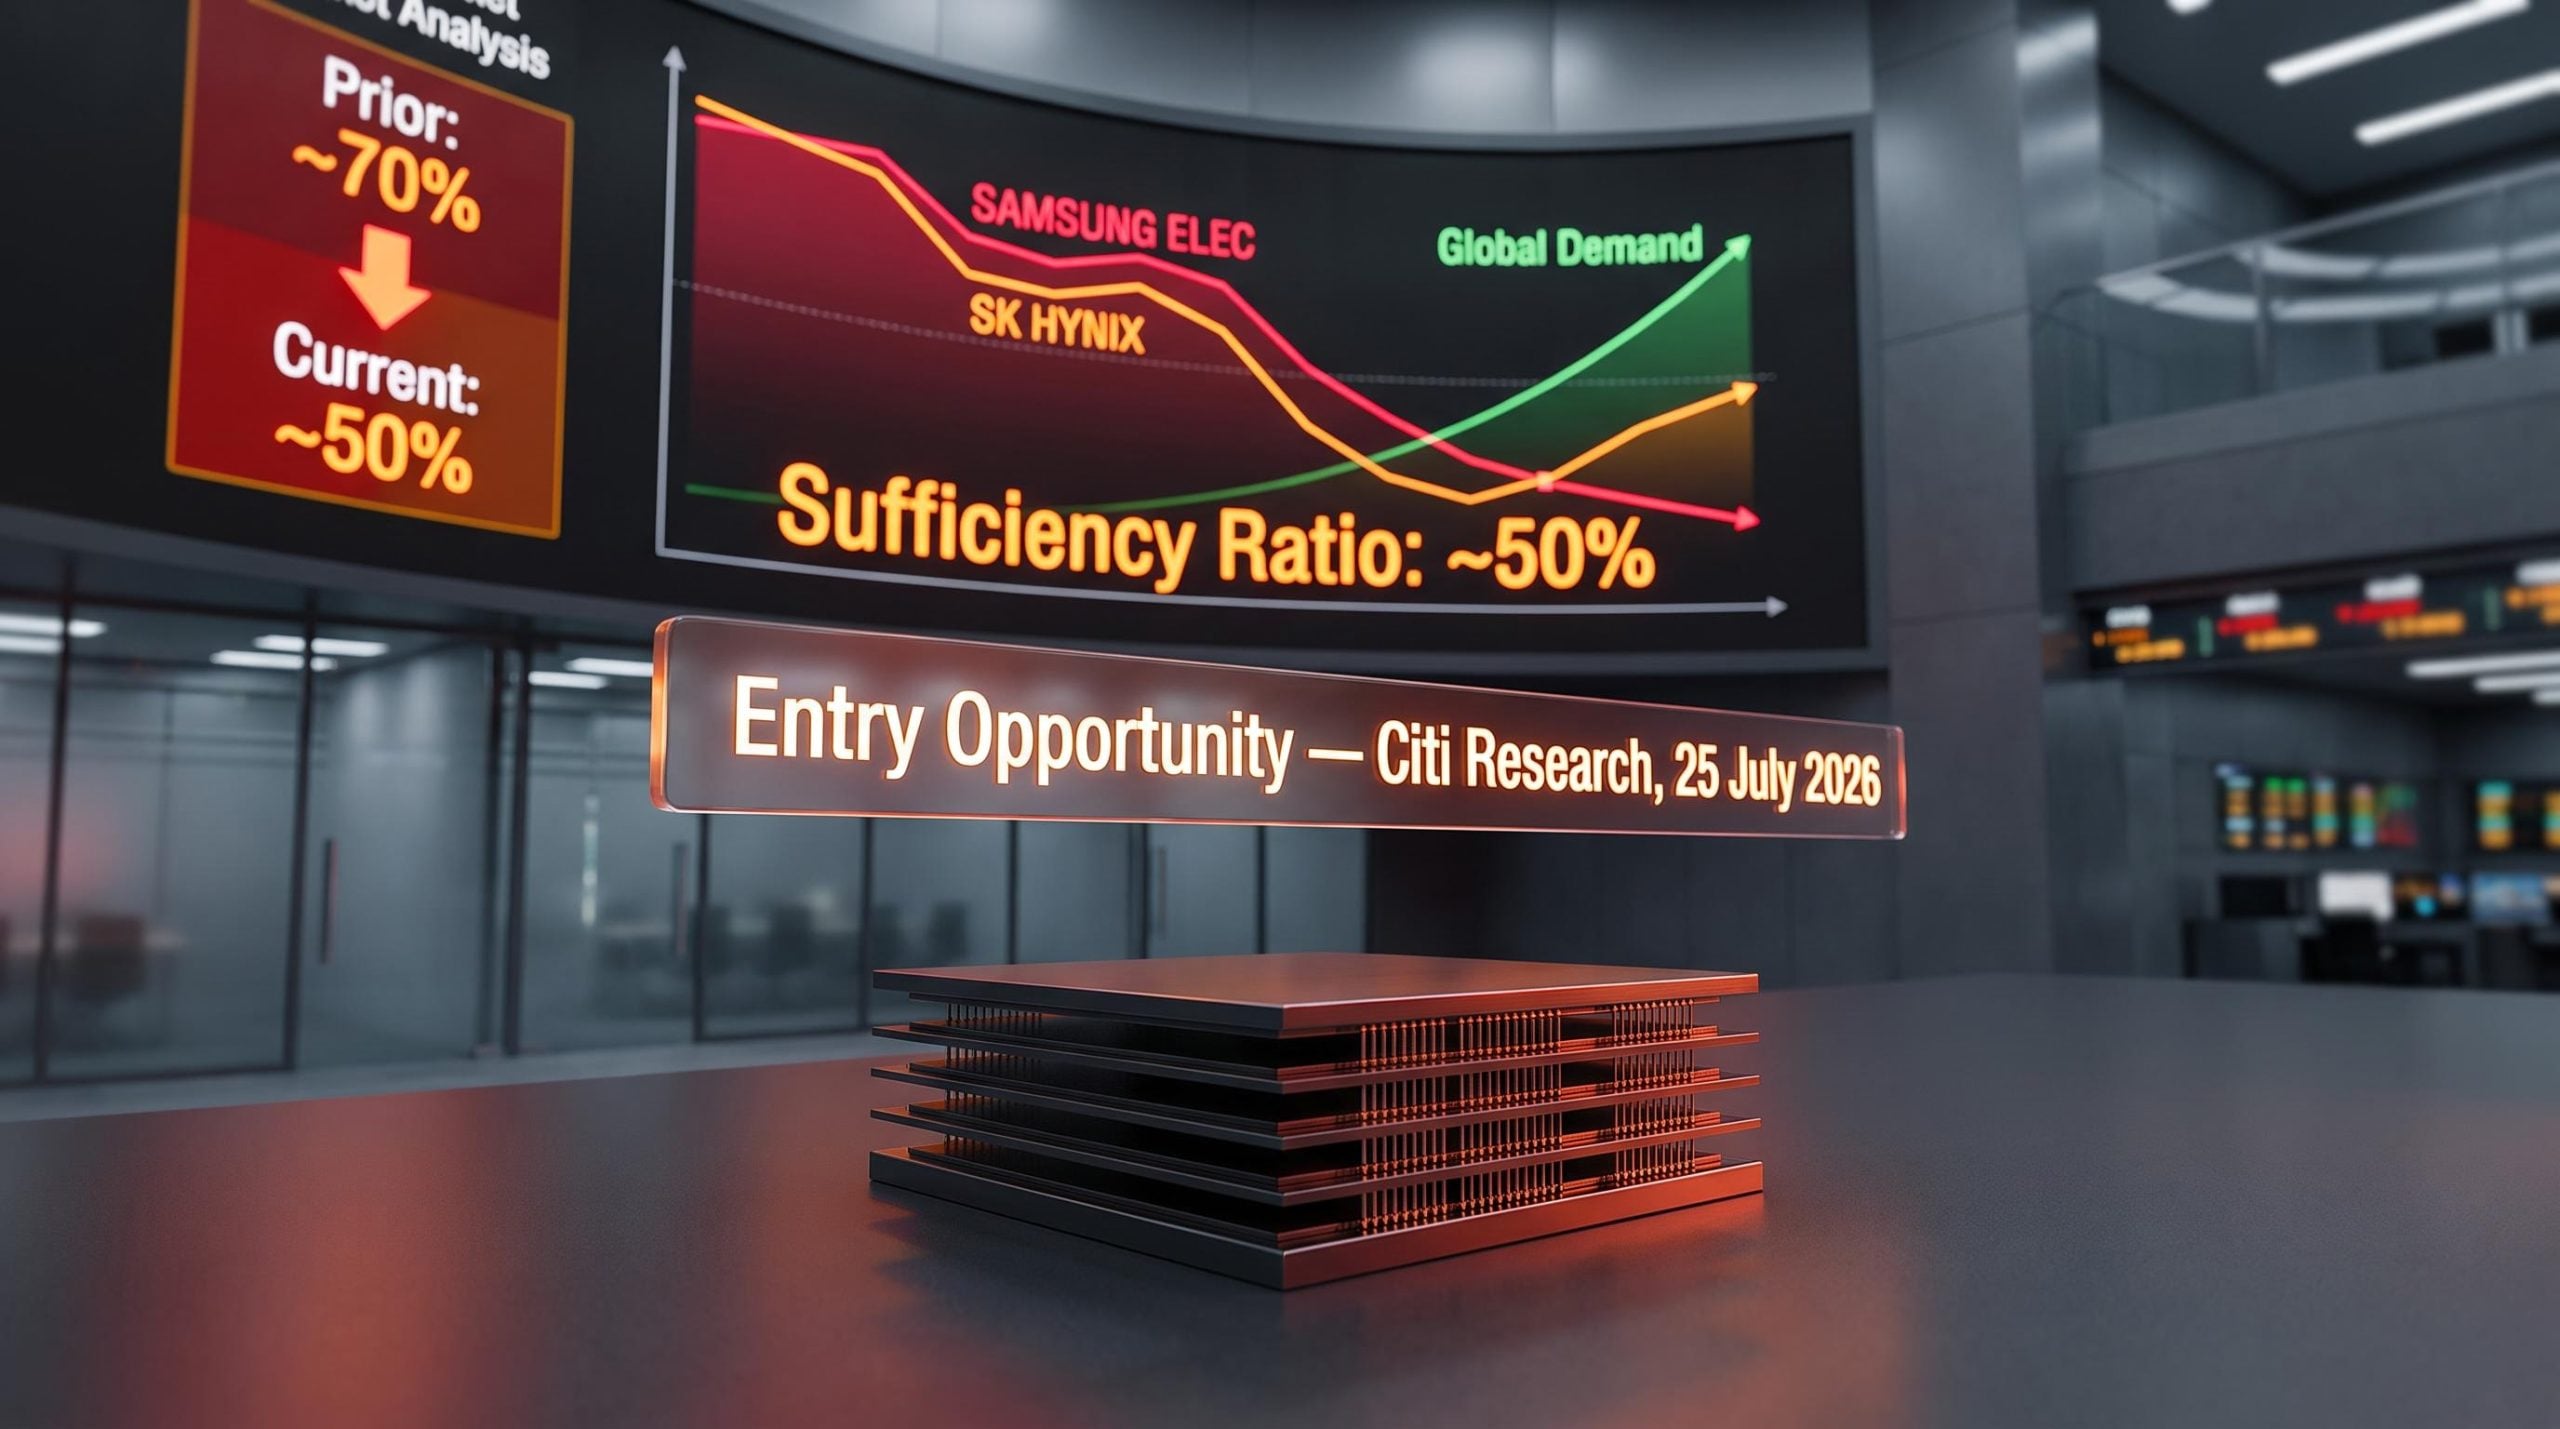
Memory chip stocks are selling off at the same moment that producers can only fill half of global orders. That is the contradiction at the centre of Citi Research’s latest note on Samsung Electronics and SK Hynix, published on 25 July 2026: a supply-demand sufficiency ratio that has collapsed to approximately 50%, yet share prices that reflect a market bracing for oversupply.
Three fears drove the correction: peak-cycle anxiety, soft Chinese smartphone demand, and concerns about bloated channel inventories. Citi’s analysts push back on all three, using supply-chain data they argue points in precisely the opposite direction from the narrative the market has priced in.
Here is a clear read on whether Citi’s data justifies treating this pullback as an entry point, or whether the caution embedded in these share prices is better supported than the bank’s bullish stance suggests.
What the sufficiency ratio is actually telling investors
The supply-demand sufficiency ratio measures the proportion of global memory order volumes that producers can actually fulfil. It answers a simple question: how much of the demand can the industry meet right now?
According to Citi Research, that ratio has fallen from approximately 70% to approximately 50%. Producers went from filling roughly seven out of every ten orders to filling five.
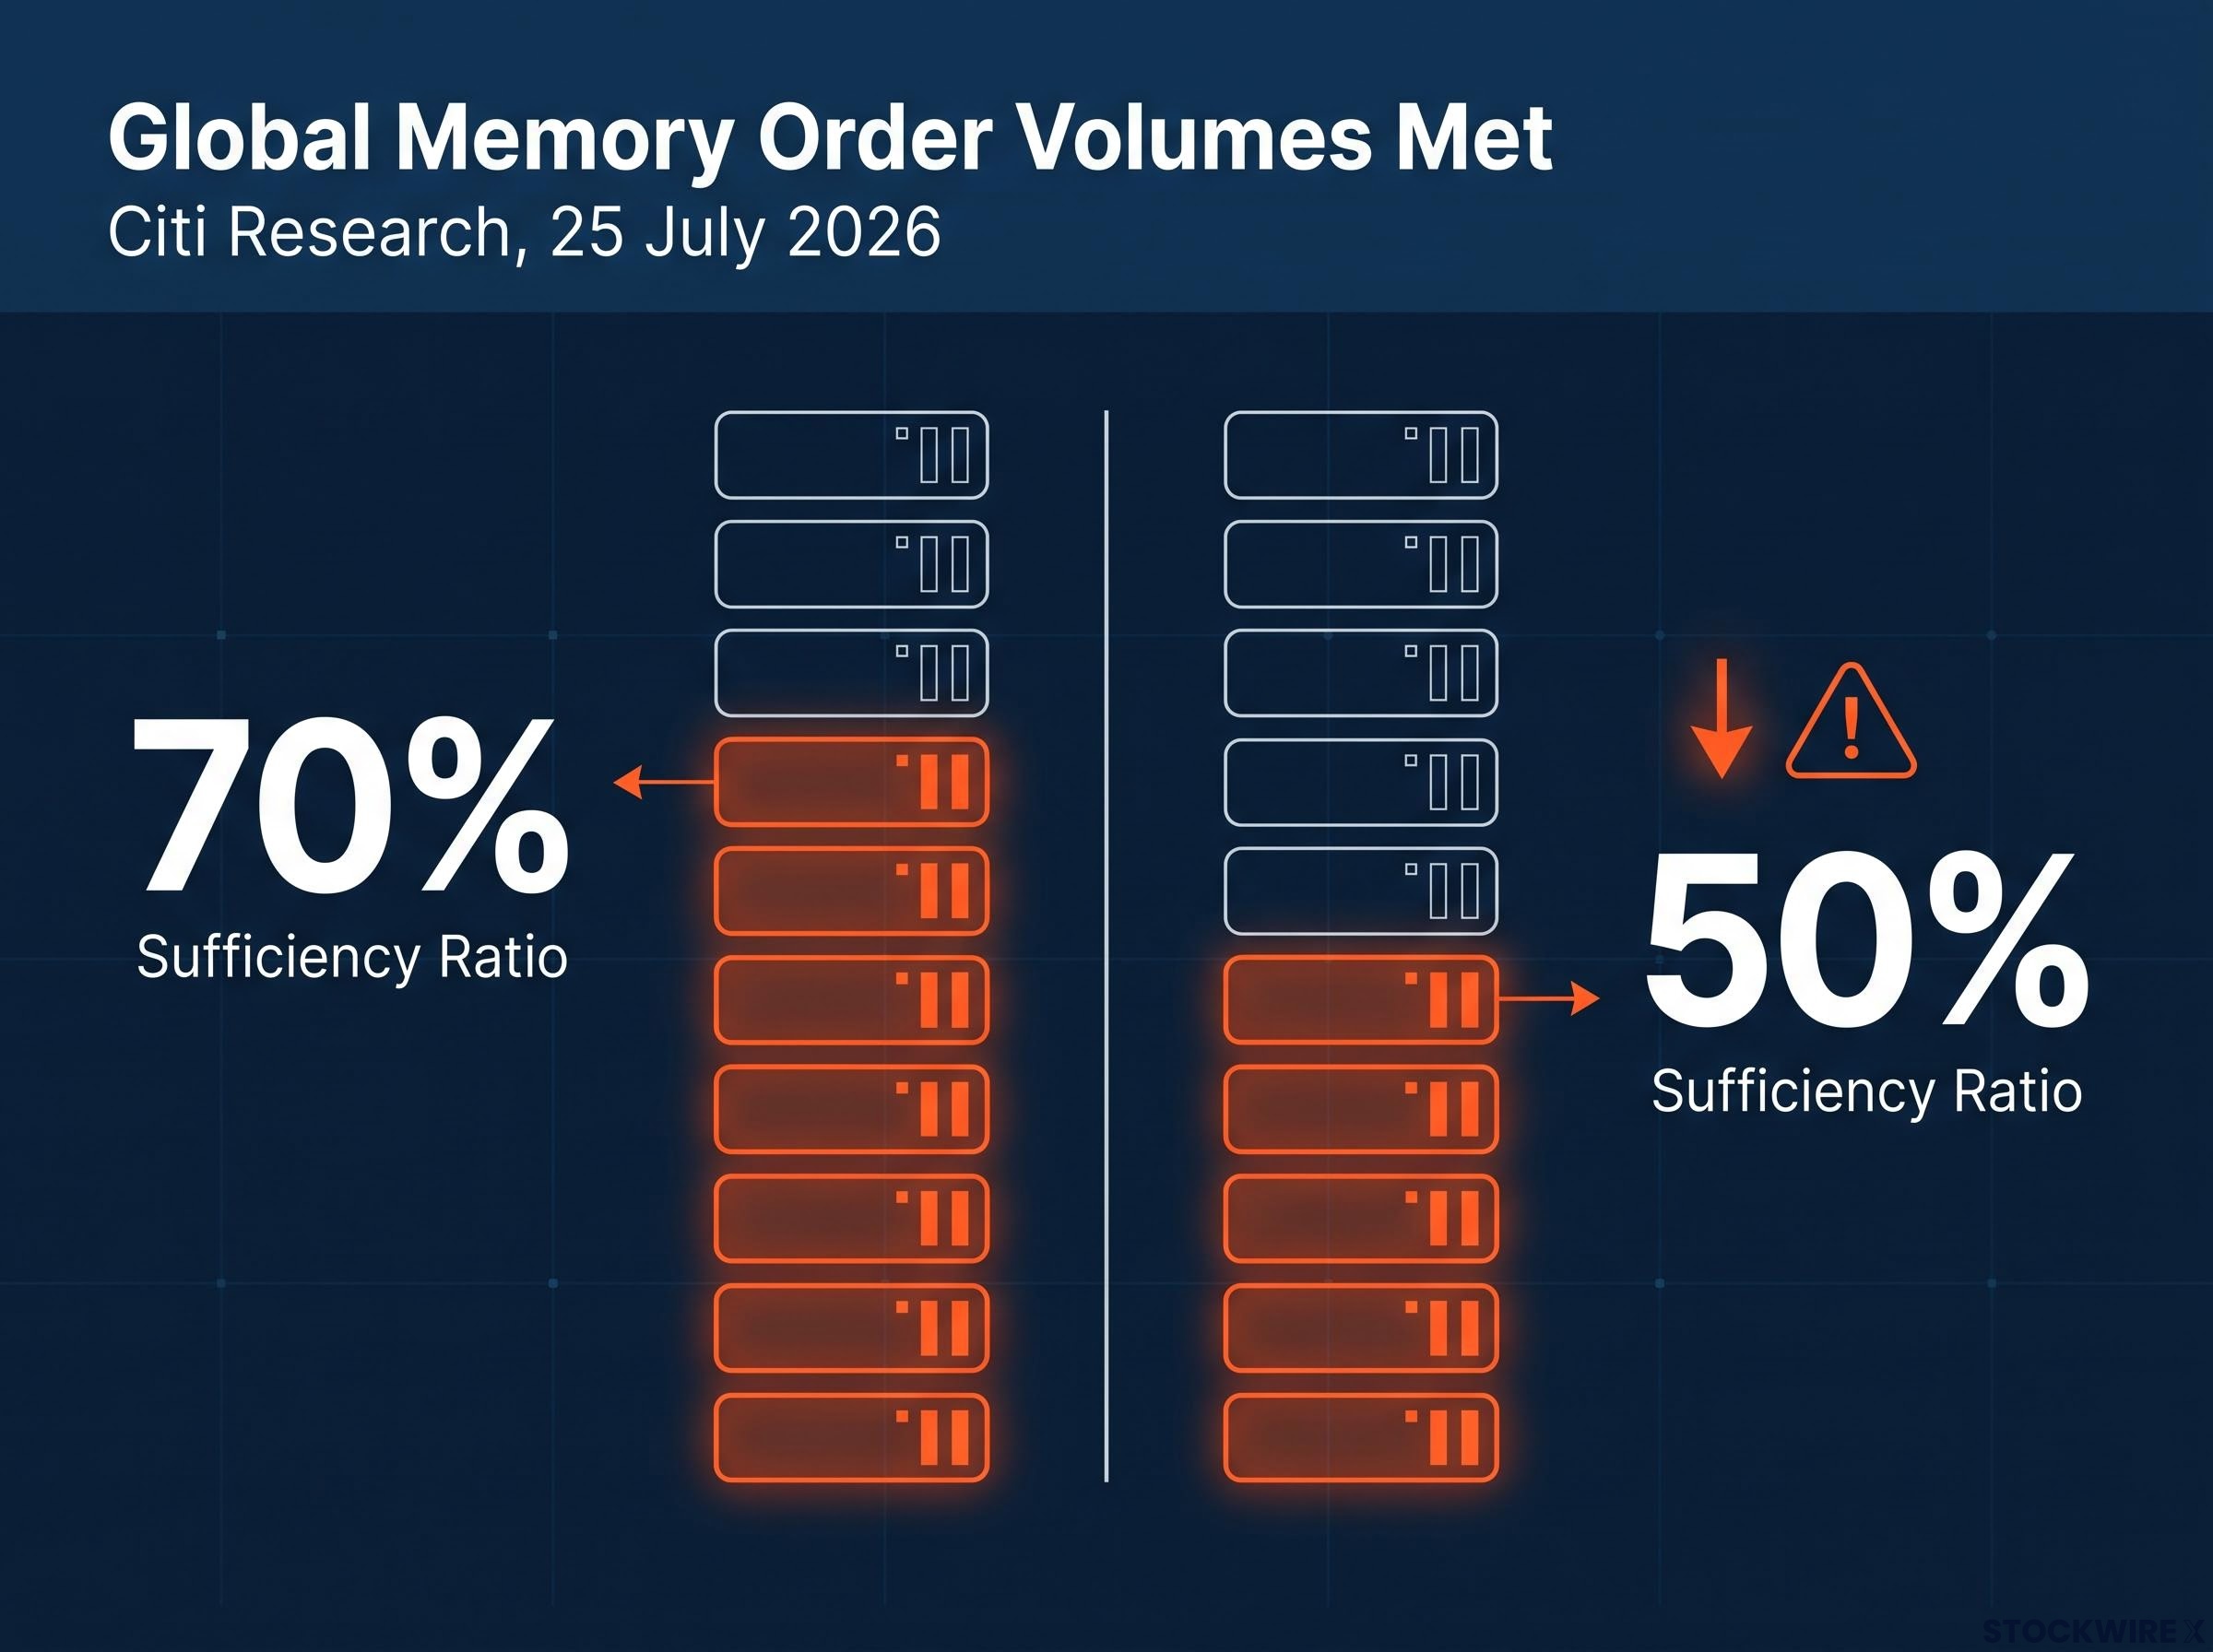
Sufficiency ratio collapse: from approximately 70% to approximately 50%, per Citi Research, 25 July 2026.
The direction matters more than the level. A ratio stable at 50% would suggest a market in equilibrium at constrained capacity. A ratio that moved to 50% from 70% signals accelerating tightening, a market where demand is outrunning supply at an increasing rate. Citi presents this as structural undersupply, the direct opposite of the channel inventory bloat narrative circulating among bearish investors.
The memory chip shortage underpinning Citi’s thesis is not a temporary demand blip: DRAM contract prices surged 90-95% in Q1 2026 and a further 58-63% in Q2 2026, while hyperscalers have shifted to 3-5 year deposit-backed supply agreements that structurally lock in demand well beyond any single earnings cycle.
| Metric | Citi finding |
|---|---|
| Sufficiency ratio (prior) | Approximately 70% |
| Sufficiency ratio (current) | Approximately 50% |
| Inventory characterisation | Materially low at suppliers and customers |
| Cycle phase assessment | Early-to-mid phase of tight upcycle |
For anyone evaluating a position in this sector, a 50% sufficiency ratio means producers cannot keep pace with demand even at current output levels. That structurally supports firmer pricing and earnings growth ahead, provided demand holds.
When big ASX news breaks, our subscribers know first
Why Citi dismisses the three fears driving the selloff
The correction in Samsung and SK Hynix shares was driven by three specific concerns. Citi’s note addresses each one and argues that none of them are supported by the supply-chain data.
- Peak-cycle fears: Citi characterises this concern as unfounded. The sufficiency ratio and inventory data are more consistent with the early-to-mid phase of a tight upcycle than with a market approaching its peak. A peaking market would show rising inventories and an improving sufficiency ratio. Neither is present.
- Weak Chinese smartphone demand: Citi acknowledges the softness in consumer electronics but argues it is no longer the variable that determines where the memory market goes. AI-driven server and high-bandwidth memory (HBM) demand now functions as the dominant marginal driver, outweighing consumer-side weakness in setting price direction.
- Channel inventory bloat: According to Citi, stock positions held by both memory producers and their end customers sit well beneath levels that would be considered normal by historical standards throughout the supply chain. The bloat narrative is not supported by the actual stock positions in the channel.
What the combined picture says about where the cycle actually sits
Taken together, Citi’s data points to a market that is tightening, not peaking. Lean inventories, a collapsing sufficiency ratio, and demand led by structurally constrained HBM supply are characteristics of an early-to-mid upcycle. If that reading is accurate, the three fears that drove the selloff represent mispricing rather than a rational market adjustment.
Samsung and SK Hynix as distinct plays on the same thesis
Both stocks benefit from the same macro tailwind, but they are not interchangeable bets. The mechanism through which each company captures the upcycle differs, and that distinction matters for how you position.
Samsung Electronics holds significant positions in both high-density NAND and advanced DRAM product lines. That breadth ties it to the broader server deployment cycle and AI infrastructure buildout. It is the more diversified play on memory market tightness.
SK Hynix is a more concentrated position. The company is among the foremost suppliers of HBM to the world’s leading GPU makers, placing it at the sharpest point of scarcity in the memory market. Citi had already raised its target price on SK Hynix around May 2026 following stronger-than-expected HBM and DRAM/NAND average selling price (ASP) trends. Today’s reaffirmation extends an established bullish position.
| Company | Primary exposure | Key demand driver | Citi rating |
|---|---|---|---|
| Samsung Electronics | High-density NAND, advanced DRAM | Server deployment and AI infrastructure | Buy |
| SK Hynix | High-bandwidth memory (HBM) | GPU manufacturer supply chains | Buy |
The choice between them depends on conviction. Samsung offers broader memory diversification. SK Hynix offers more concentrated exposure to HBM demand. If you believe AI infrastructure capital expenditure continues at pace, SK Hynix captures more of that upside. If you want exposure to memory tightness with less single-variable risk, Samsung is the broader position.
Understanding the HBM supply chain and why it anchors the bull case
High-bandwidth memory, or HBM, is a specialised, stacked DRAM architecture designed for the extreme data-throughput requirements of AI accelerators and GPU clusters. Unlike standard DRAM, which is produced at enormous scale with well-established manufacturing processes, HBM involves layering multiple memory dies vertically and connecting them with advanced packaging. The result is far higher bandwidth per chip, but the manufacturing process is significantly more complex and capital-intensive.
That complexity is why HBM supply is structurally constrained, and why it cannot be ramped quickly in response to demand surges.
HBM supply constraints do not resolve at the chip level alone: Bernstein projects 2-2.5x HBM contract price increases for 2027 that amplify approximately fourfold at the hyperscaler purchase level once GPU vendors apply margin preservation, meaning the cost impact of scarcity compounds at each layer of the supply chain before reaching the end buyer.
Why HBM capacity cannot be ramped quickly
The barriers to rapid expansion sit at multiple points in the manufacturing process:
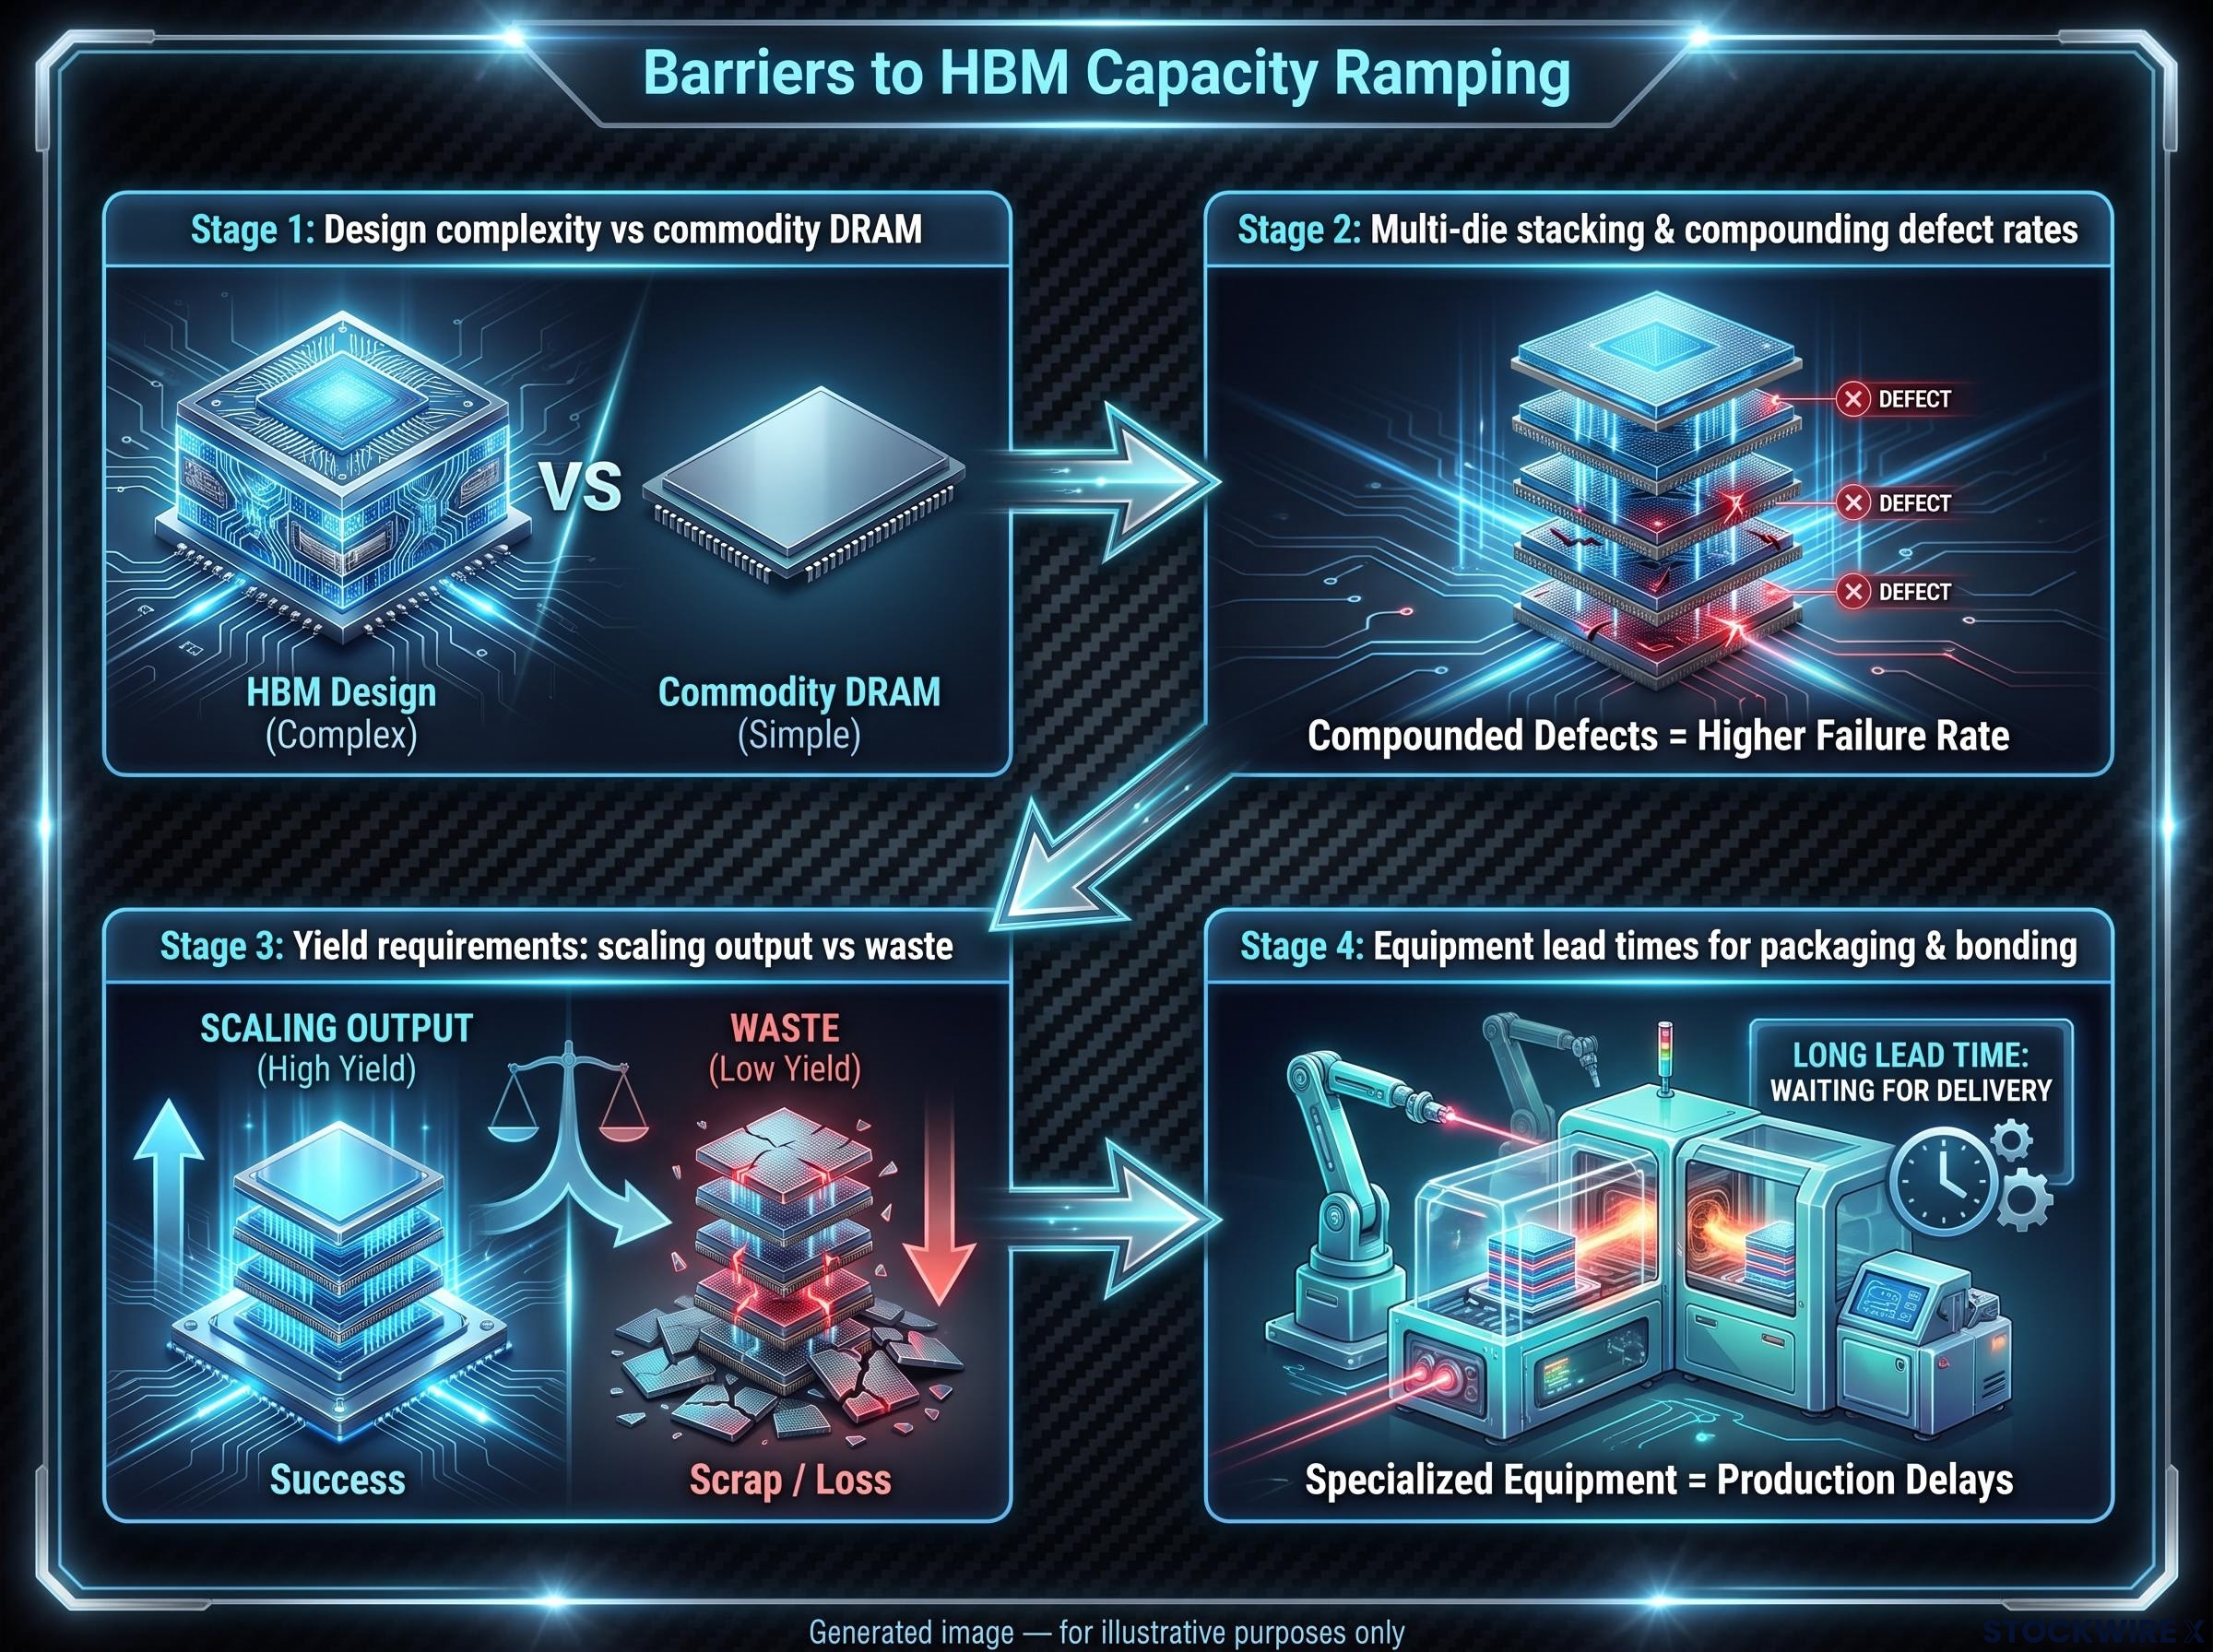
- Design complexity: HBM architectures require specialised chip designs that differ fundamentally from commodity DRAM, adding development lead time.
- Multi-die stacking: The vertical stacking process is sensitive to yield, meaning defect rates compound with each additional layer.
- Yield requirements: Tighter tolerances at each stage mean that scaling output without proportionally scaling waste is difficult.
- Equipment lead times: The specialised packaging and bonding equipment required for HBM has long procurement cycles that cannot be shortened by spending more.
Citi’s 50% sufficiency ratio reflects not just commodity memory tightness but the compounded effect of HBM supply constraints layered on top of already-lean inventories. HBM scarcity is the load-bearing element of the entire bull case. Even a moderation in AI capital expenditure would need to be significant and sustained before it materially relieved the pressure on SK Hynix’s order books, which is why Citi treats current demand as durable rather than cyclically fragile.
What the risks are and what Citi’s call requires to be right
Citi’s note is not without caveats. The bank identifies three specific risks that could undermine its thesis:
- AI capital expenditure shift: If major hyperscalers meaningfully reduce or redirect their AI infrastructure spending, HBM demand would soften. This is the highest-impact variable because HBM scarcity is the structural foundation of the bull case. A sustained pullback in AI capex, not a single quarter’s deferral, is what would make this risk material.
- Korean semiconductor geopolitical exposure: Escalating trade restrictions, export controls, or regional security tensions affecting South Korea’s semiconductor sector could disrupt production timelines or market access for both companies.
- Samsung-specific labour and cost pressures: Internal operational challenges, including labour dynamics and rising manufacturing costs, could weigh on Samsung’s margins even if the top-line demand environment remains strong.
Hyperscaler AI capex is the single load-bearing variable in Citi’s thesis: Amazon, Microsoft, Alphabet, and Meta collectively spent $130 billion in Q1 2026 alone, with full-year 2026 combined guidance reaching approximately $725 billion and a $1 trillion annual run rate projected for 2027, a spending trajectory that makes the sufficiency ratio collapse a demand-side story as much as a supply-side one.
Citi’s characterisation: The current pullback represents an “entry opportunity” rather than an early warning of downcycle conditions. (Citi Research, 25 July 2026)
The bull case lives or dies on AI infrastructure demand remaining durable through the next 12 to 18 months. Each of these risks deserves a probability assessment, not just acknowledgement.
This article is for informational purposes only and should not be considered financial advice. Investors should conduct their own research and consult with financial professionals before making investment decisions.
Whether the data justifies acting on this correction
Citi’s thesis rests on three data pillars: a sufficiency ratio at approximately 50%, materially lean inventories across the supply chain, and structural HBM scarcity that cannot be resolved quickly. Together, they paint a picture of a memory market that is tightening, not peaking, and where pricing power should support earnings growth through the current cycle.
The bearish narrative looks poorly supported by those fundamentals today. But the bull case is not unconditional. It depends most heavily on one variable: the durability of AI infrastructure capital expenditure. If hyperscaler spending continues at or near current levels, the sufficiency ratio stays tight and both Samsung and SK Hynix earnings benefit. If AI capex decelerates meaningfully, the entire thesis softens.
What you should be watching in the months ahead:
- Hyperscaler AI capex announcements: Quarterly capital expenditure guidance from the major cloud and AI infrastructure companies is the single most important leading indicator.
- HBM order volumes from GPU manufacturers: Any shift in order cadence from leading GPU makers would signal a change in the demand trajectory SK Hynix depends on.
- Samsung cost and margin updates: Operational cost pressures specific to Samsung could compress returns even in a favourable demand environment.
- Sufficiency ratio trajectory: Whether the ratio stabilises near 50% or continues to decline will tell you whether the tightening is peaking or accelerating.
Past performance does not guarantee future results. Financial projections are subject to market conditions and various risk factors.
Citi’s data makes a specific, quantified case. The market’s correction makes a different one. The gap between the two is where the decision sits, and the AI capex variable is the factor that will close it.
For investors wanting a structured framework for managing exposure through the full cycle, our dedicated guide to semiconductor cycle positioning sets out a five-indicator approach for capturing peak-cycle gains without holding premium multiples past their expiry date as the 2027-2029 supply wave builds.