Most investors carry a simple assumption into every allocation decision: if a country’s economy is growing fast, its stock market should follow. It sounds logical. It feels obvious.
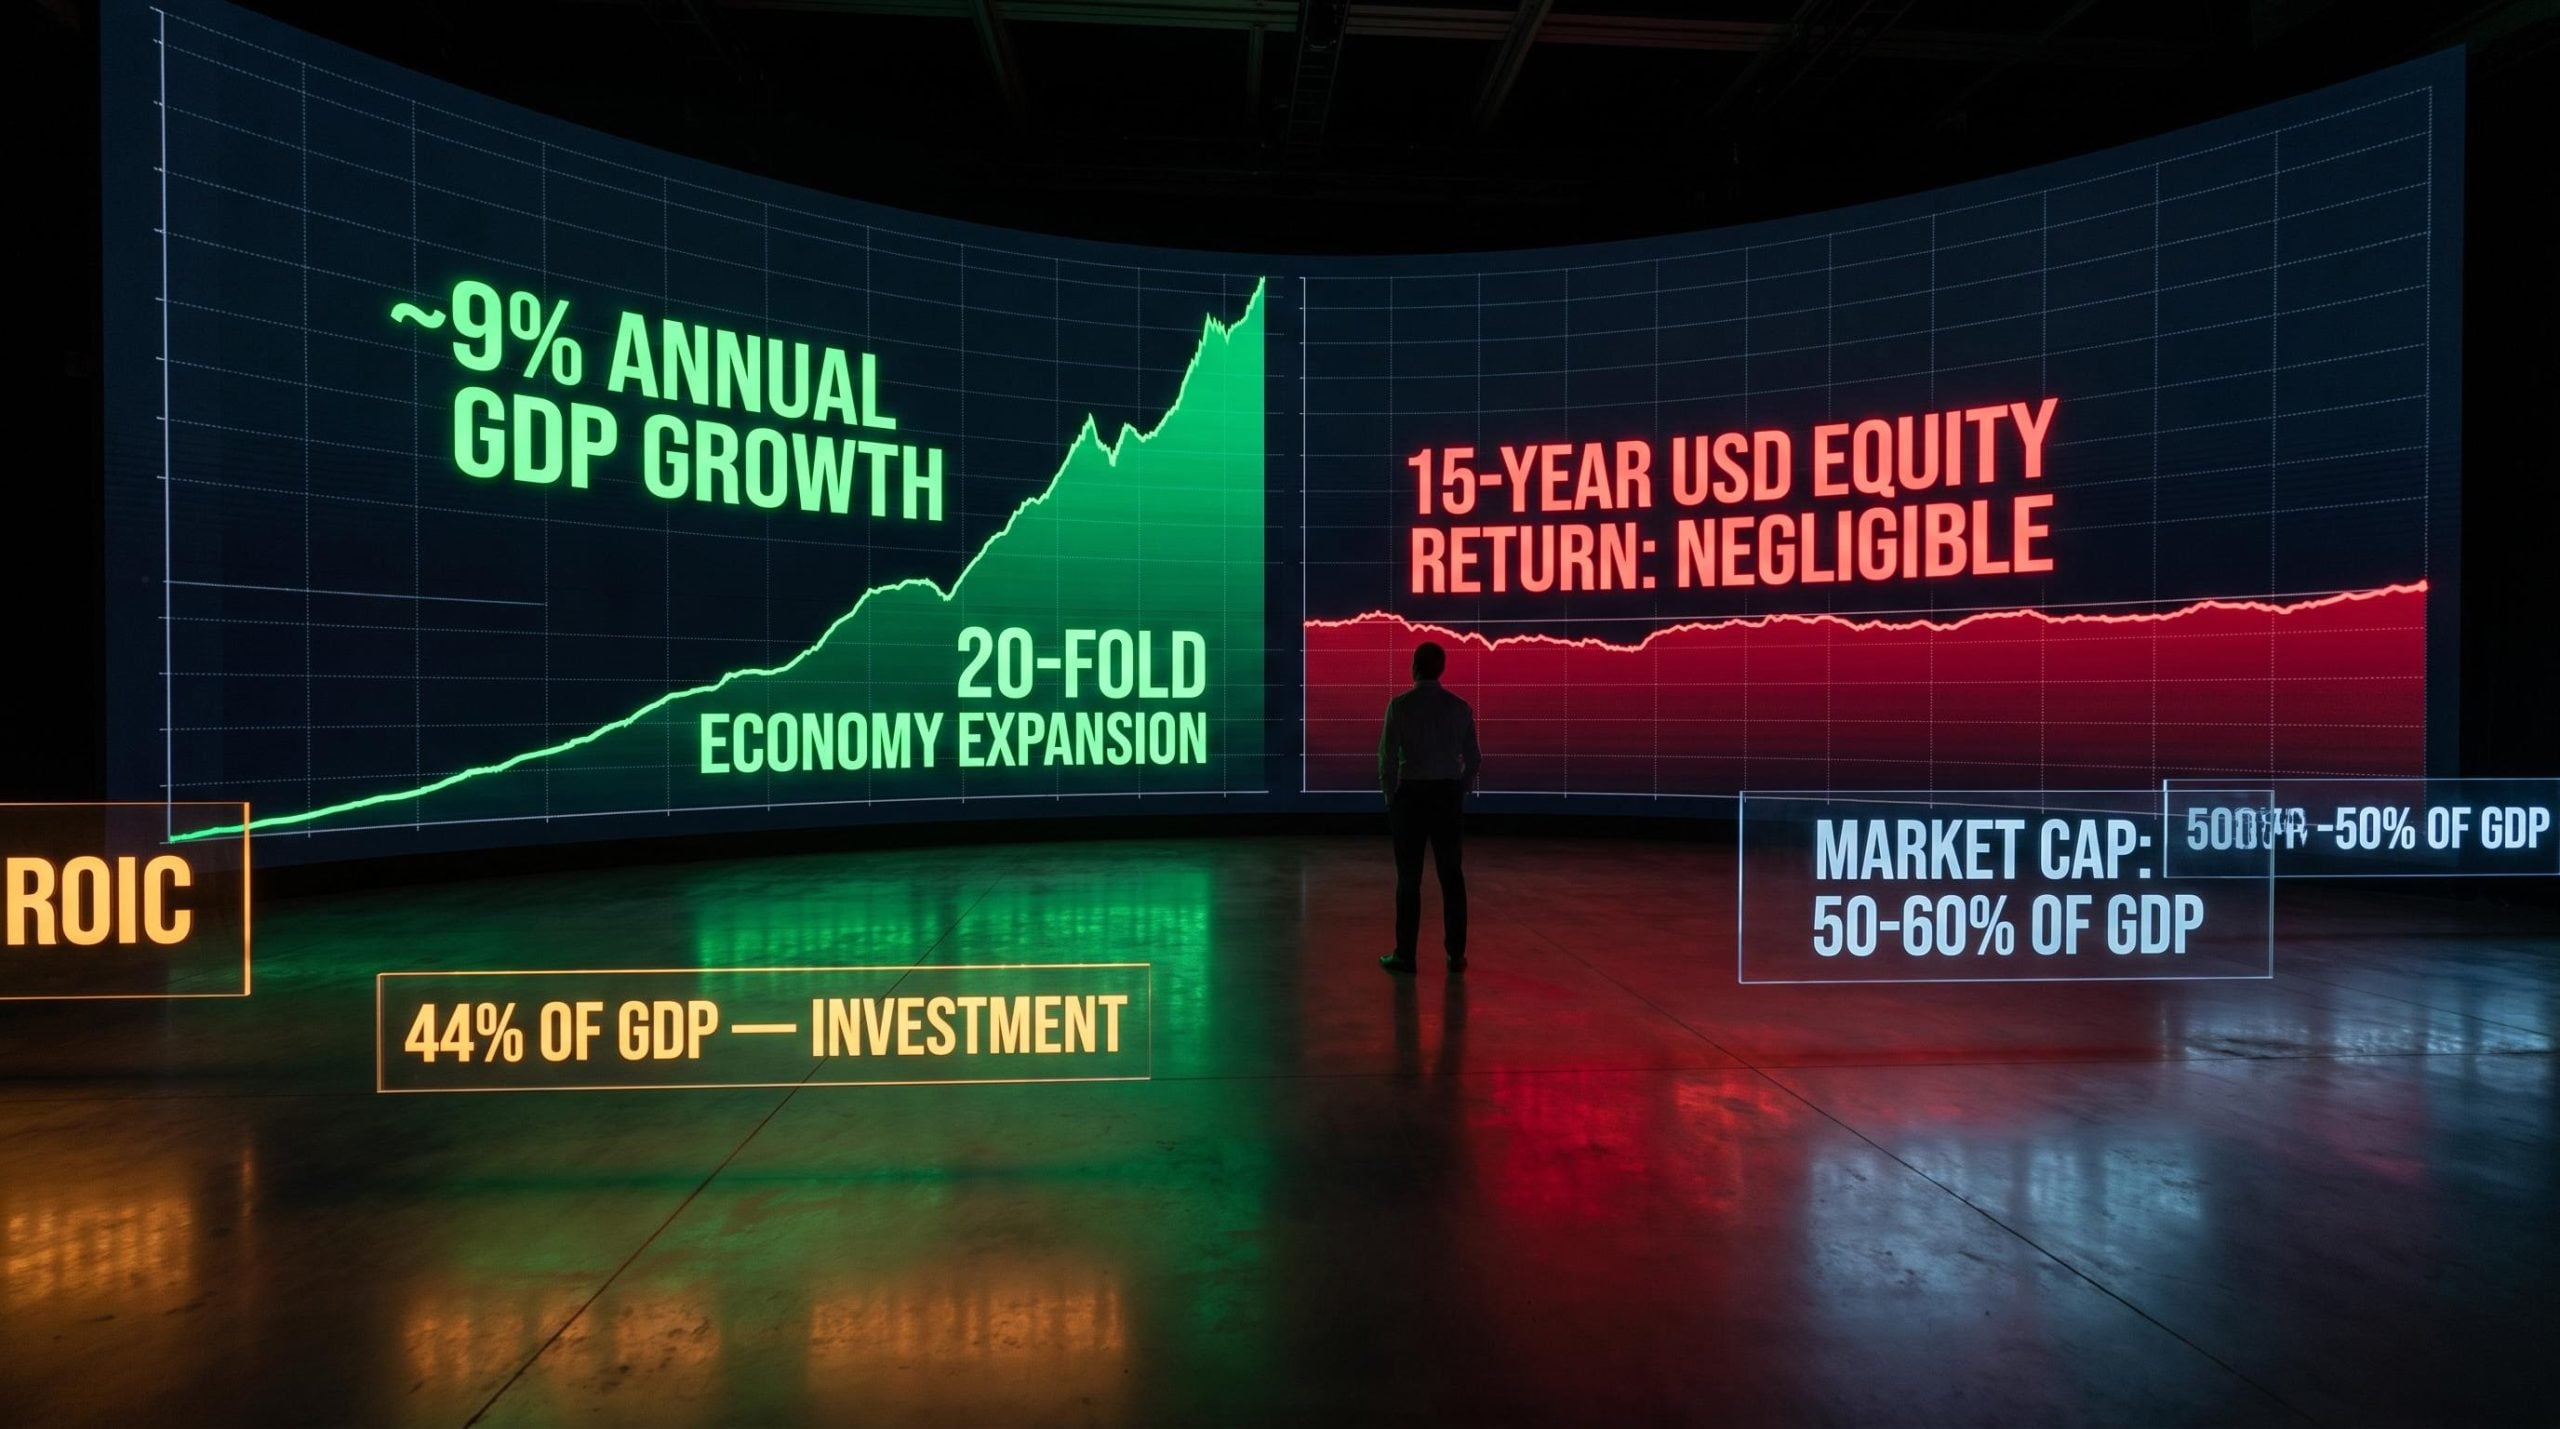
It is also, in many cases, completely wrong. China grew its economy roughly 20-fold over three decades. An investor who bet on that story in equities earned close to nothing.
The gap between economic growth and stock market returns is one of the most persistent and costly misconceptions in investing. Retail investors routinely act on GDP forecasts, political headlines, and macro narratives when choosing where to put their money. These are the wrong inputs, and the consequences compound over years.
Here is the lens that separates investors who read macro fluently from those who mistake headline growth for investable return: what actually drives equity returns, why GDP growth is not one of those drivers, and what to look for instead.
What you actually own when you buy a country’s stocks
The mental model most investors carry is straightforward: buying a country’s stock index means owning a piece of that country’s economy. The problem is that this is not what you are doing.
GDP measures the total value of economic activity in a country. A stock index measures the after-tax profits of its listed companies only. Those are fundamentally different objects.
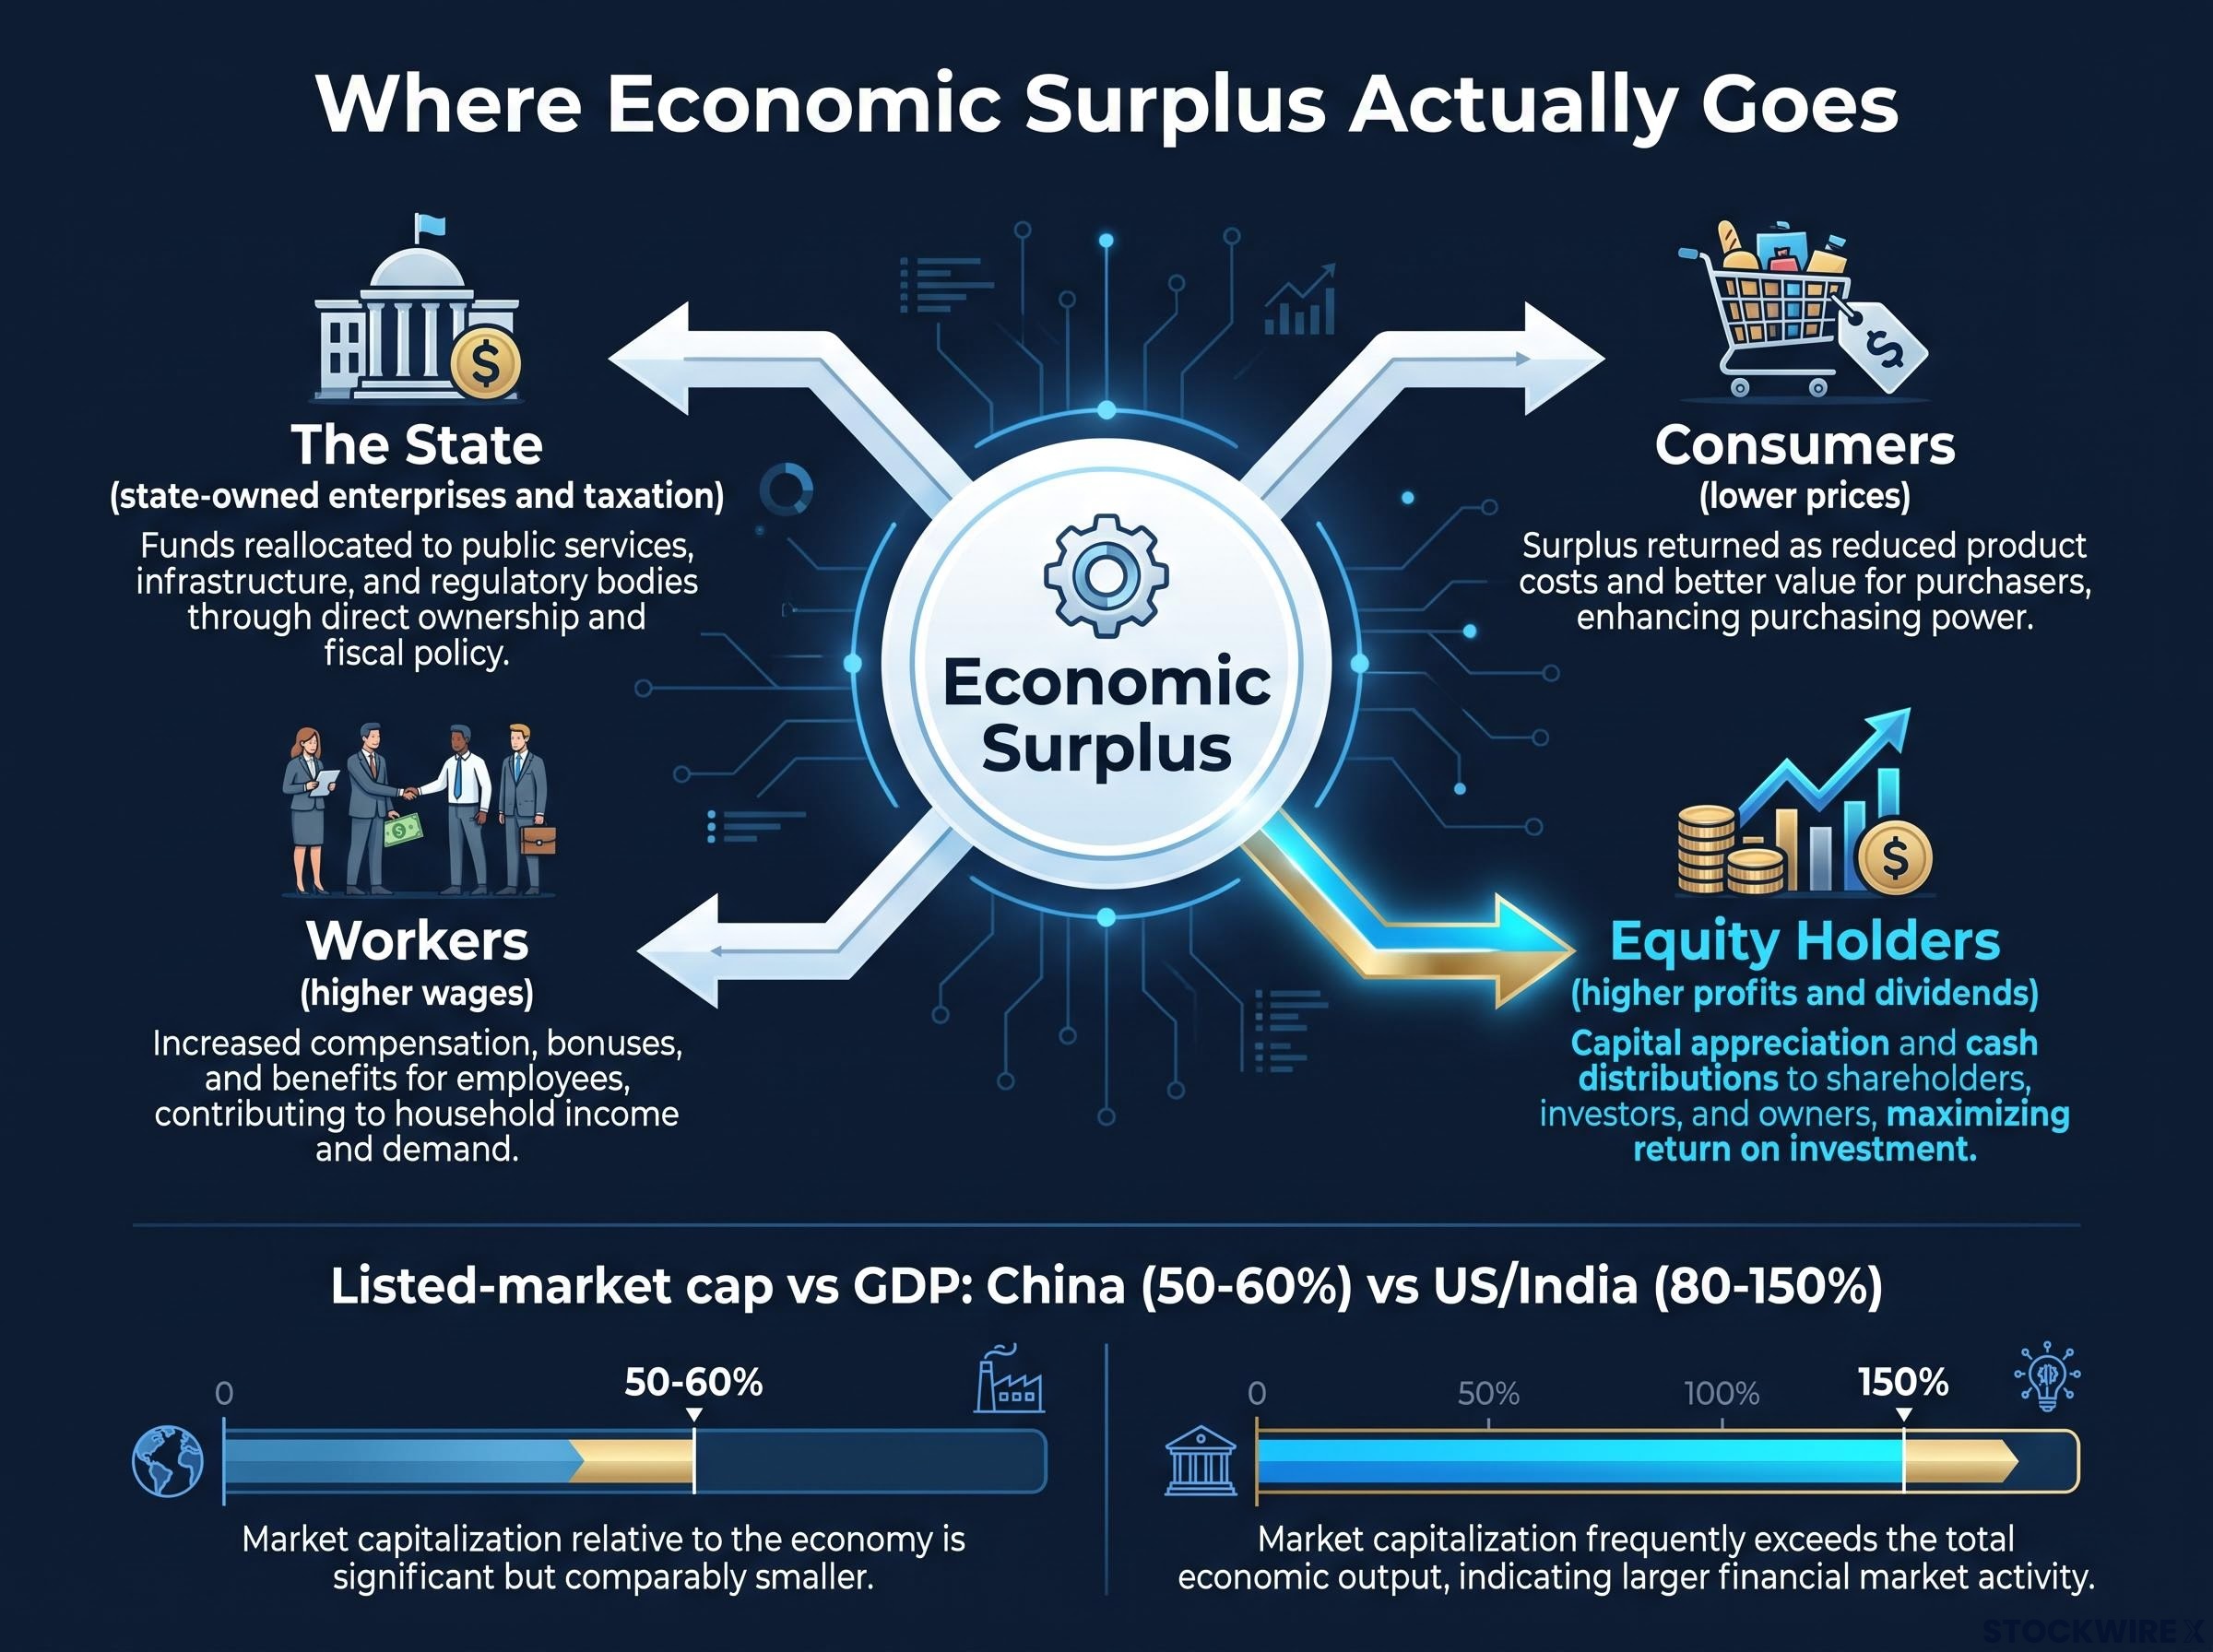
GDP includes government spending, infrastructure projects, unlisted private firms, exports, and consumer activity. None of that flows to you as an equity holder by default. In China, for example, listed-market capitalisation has typically sat at around 50-60% of GDP, versus 80-150% in markets like the US or India. That tells you how much of an economy can exist entirely outside the reach of the stock market.
Owning a stock index is not owning a country’s economy. It is owning a claim on listed-company profits only.
When an economy grows, the surplus it creates can accrue to several different stakeholders:
- The state, through state-owned enterprises and taxation
- Workers, through higher wages
- Consumers, through lower prices
- Equity holders, through higher profits and dividends
Only that last group matters for your stock returns. Growth that flows to the other three stakeholders boosts GDP but does nothing for your portfolio. The gap between GDP and listed-market earnings is not a rounding error; it is the reason a country can grow strongly while its stock market delivers nothing.
When big ASX news breaks, our subscribers know first
China’s growth miracle that left equity investors behind
Start with the growth numbers, because they deserve to land in full before the equity outcome arrives.
China’s real GDP grew at close to 9% per year on average over 30 years. The economy expanded roughly 20-fold since the late 1990s. GDP growth hit approximately 12% in 2012 and around 10% in 2013. By any standard, this was one of the strongest sustained growth runs in modern economic history.
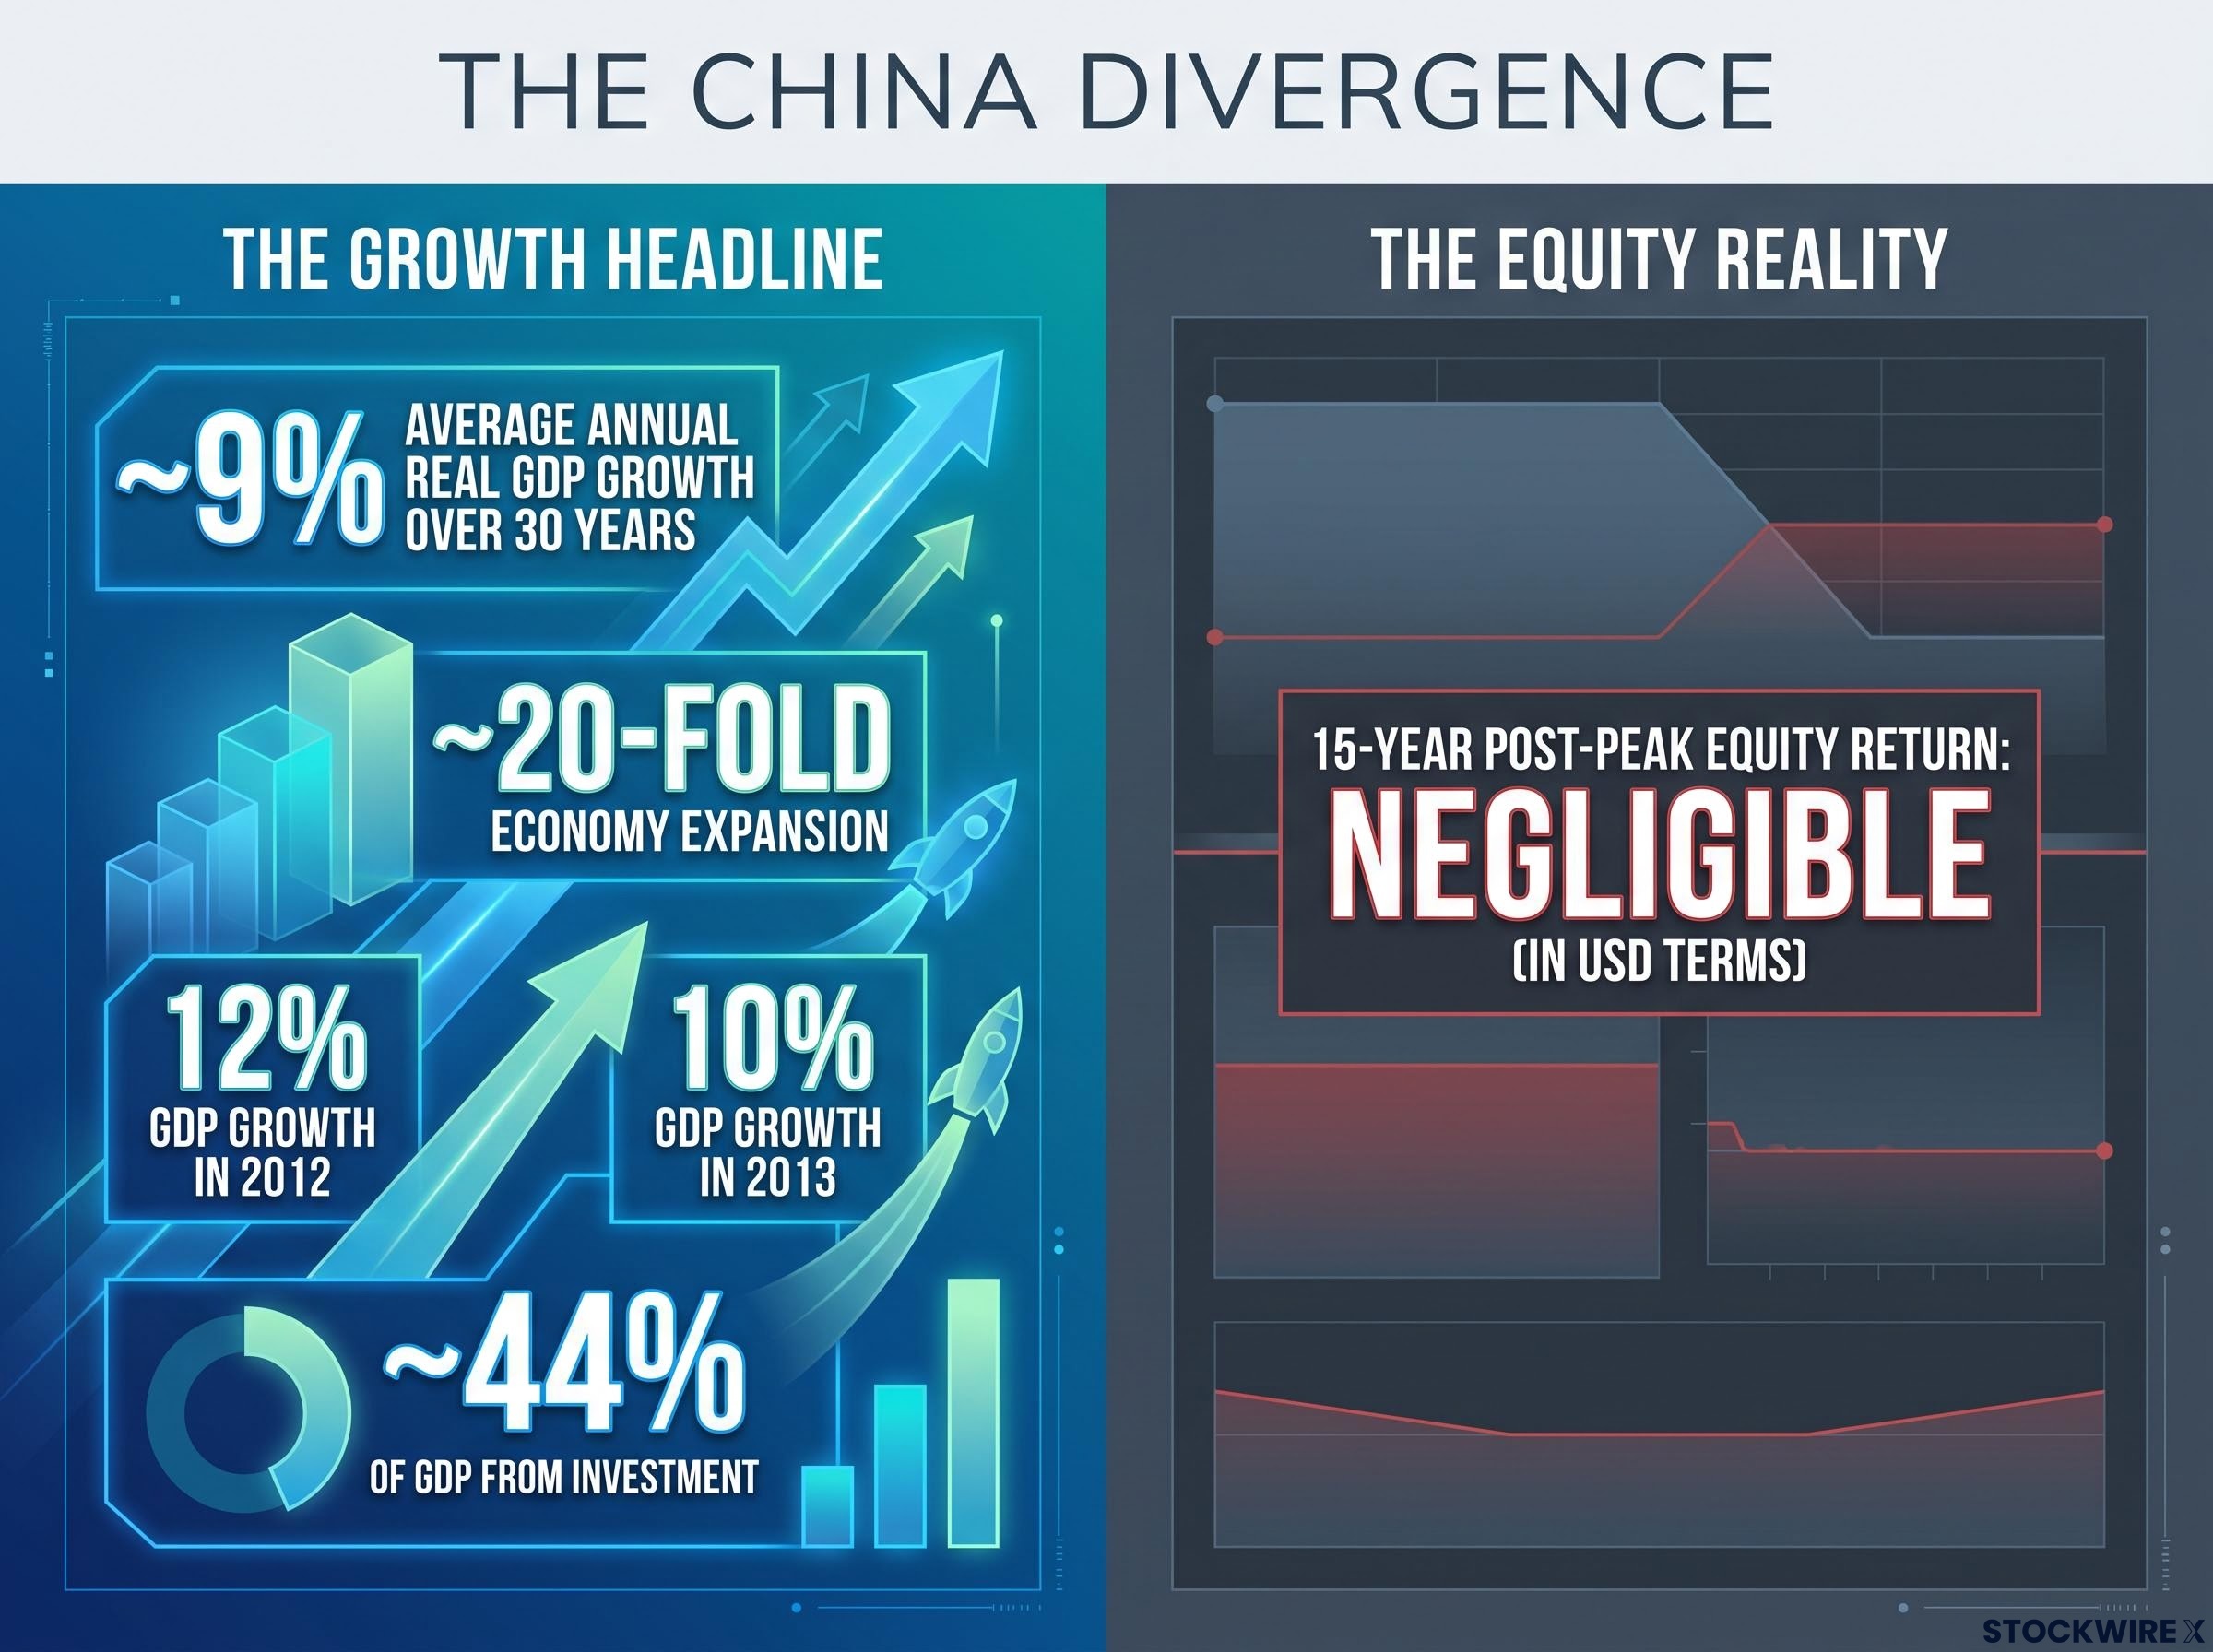
Now the equity outcome: over the 15-year window following that peak growth period, broad Chinese equities delivered negligible returns in US dollar terms. Academic studies have found zero or negative correlation between China’s GDP growth and its stock market development.
| Metric | Figure |
|---|---|
| Average annual real GDP growth (30 years) | ~9% |
| Economy expansion since late 1990s | ~20-fold |
| GDP from investment (infrastructure, property) | ~44% |
| 15-year USD equity return (post-peak growth) | Negligible |
Sit with that for a moment. The world’s most impressive growth story produced virtually no equity return over a decade and a half. The contradiction is real, and it has structural causes.
Why the earnings never arrived
First, chronic over-investment at low returns. Around 44% of China’s GDP came from investment, especially in infrastructure and property, creating overcapacity and projects with poor financial returns. ROIC, or return on invested capital (the profit a company earns per unit of capital it deploys), was consistently low. That structure boosts GDP statistics but does not generate profits shareholders can claim.
Second, state-controlled companies prioritised employment, social stability, and strategic objectives over maximising profits or paying dividends to minority shareholders.
Third, weak shareholder protections meant chronic equity dilution, limited buybacks, and governance problems that prevented value created at the business level from reaching outside investors.
Fourth, much of the growth accrued to sectors and firms outside the listed market entirely. With market capitalisation at 50-60% of GDP, a large share of China’s economic gains was simply inaccessible to equity investors.
China’s case tells you something important: the size of the growth headline is not the question to ask. The question is whether that growth flows through to listed-company profits. In China, structurally, it largely did not.
Canada and the UK: when “bad economy” does not mean bad index
If the China case were an emerging-market anomaly, you could dismiss it as a governance problem. It is not. The disconnect between macro headlines and index returns runs through developed markets too, through a different mechanism: index composition.
Canada has faced near-recessionary domestic conditions in recent years: high household debt, housing stress, and sluggish consumer spending. The macro story sounded poor. Yet the TSX had gained around 10% for the year at the time of reporting, a result broadly comparable to the performance of both the S&P 500 and the NASDAQ.
The reason sits in what the TSX actually contains:
- Financials: Large Canadian banks posting strong profit growth and drawing heavily on capital markets revenues, mirroring the robust earnings reported by major US banks over the same period
- Energy: Companies driven by global commodity prices, not Canadian consumer spending
- Materials: Firms exposed to global demand, not domestic retail conditions
Canadian households under pressure is true for the domestic economy. It is only partially relevant for what actually drives TSX earnings.
The UK tells a similar story through a different stress test. Years of political upheaval, from Brexit to frequent changes of government and fiscal scares, led many investors to avoid UK assets on macro or political grounds. Yet the FTSE 100 is dominated by global energy majors, miners, pharma companies, global financials, and consumer brands, many earning the majority of their revenues outside the UK.
When sterling weakens during political stress, overseas profits translate into more pounds, mechanically boosting FTSE 100 reported earnings. The political bad news and the index gain can arrive simultaneously.
What these two cases share is the same structural lesson: “what is actually in this index, and where does it earn its money?” is the right question. Reading the macro headline and acting on it is answering the wrong question entirely. This disconnect is not limited to authoritarian governance or emerging markets. It applies to developed markets through index composition alone.
Index composition and valuation interact in ways that are easy to overlook: European-listed multinationals derive substantial revenues outside Europe, meaning the commonly cited objection to European allocation, slower eurozone GDP growth, applies to the wrong earnings base entirely.
The two variables that actually determine long-run equity returns
You have now seen the pattern across three countries. China grew extraordinarily and delivered nothing to equity investors. Canada looked recessionary while its index matched the S&P 500. The UK’s political dysfunction coincided with mechanical earnings boosts for its largest companies.
The underlying mechanics are consistent across all three, and they point to two primary drivers of long-run equity returns:
- Corporate earnings growth. Stock indices are claims on the aggregate earnings of their constituents. Earnings growth can diverge sharply from GDP growth because of sector mix, where revenues are actually earned (domestic versus global), profit margins, and share issuance and dilution dynamics. A country’s GDP can grow at 8% while its listed companies grow earnings at 2%, or vice versa.
Earnings season signals arrive weeks before official GDP data and carry more granular information: corporate results directly report margin trends, credit conditions, and consumer health at the company level rather than as aggregate estimates revised months later.
- Return on invested capital (ROIC) and capital allocation. ROIC measures how much profit a company earns per unit of capital it deploys. A market where firms earn high ROIC and reinvest wisely compounds your wealth even with mediocre GDP growth. A market that deploys vast capital at low ROIC, as China did with 44% of GDP directed toward capex-heavy sectors, produces GDP statistics but not shareholder returns.
McKinsey research on ROIC and value creation establishes that return on invested capital is a more reliable predictor of shareholder wealth than revenue or GDP-linked growth, because capital deployed below the cost of capital destroys value regardless of the headline growth rate it supports.
The conceptual comparison is worth internalising: a 3%-growth country with high-ROIC, shareholder-friendly firms can be a better equity market for you than an 8%-growth country with chronic over-investment and dilution.
The same logic that exposes GDP as a poor equity predictor underpins the value investing framework: buying below intrinsic worth requires assessing earnings quality and capital allocation rather than the macroeconomic environment in which a company operates.
Where valuation fits in
Valuation is the third variable. Even a high-ROIC, strong-earnings market delivers poor returns if it is already priced to perfection. This is the “what is already in the price” question, and it applies regardless of how strong the underlying business quality is. If every dollar of future earnings growth is already reflected in today’s share price, the return remaining for new investors shrinks accordingly.
The reader who internalises ROIC as the lens for evaluating a market, rather than GDP growth rate, has the single most useful reorientation this article offers. It tells you what to look for instead of what to stop looking at.
How to read a country’s stock market before drawing macro conclusions
Before translating any macro view into an equity position, you owe yourself five minutes of index composition research. Here is the checklist:
Applying this framework in practice means knowing which fundamental analysis metrics to look up: return on equity, earnings per share, and profit margins are the building blocks that translate the ROIC and capital allocation concepts described here into numbers you can retrieve from any major financial data platform.
- What sectors dominate the index, and what drives their earnings? The TSX is financials, energy, and materials. The FTSE 100 is global energy, mining, pharma, and consumer brands. Neither index is a proxy for its domestic consumer economy.
- What share of revenues comes from outside the country? Most FTSE 100 companies earn the majority of their revenues internationally. A weak UK economy does not necessarily mean weak FTSE 100 earnings.
- Is ownership state-heavy or privately controlled? In China, significant state ownership meant corporate priorities diverged from shareholder value. This matters for how profits are allocated.
- What is the payout and dilution pattern? Are companies returning profits through dividends and buybacks, or diluting shareholders through constant new equity issuance? China’s pattern of chronic dilution drained value from outside investors.
- Is the macro concern in the extreme category or the noise category? Reserve genuine equity caution for sovereign default, capital controls, or hyperinflation. Normal-range political drama and everyday economic weakness are typically already priced in and may even create buying opportunities when they temporarily scare off less-informed investors.
| Country | Macro Story | Why the Index Diverged |
|---|---|---|
| China | ~9% annual GDP growth over 30 years | Low ROIC, state objectives, dilution, growth outside listed market |
| Canada | Near-recessionary household conditions | TSX weighted to financials, energy, and materials with global earnings |
| UK | Political upheaval (Brexit, fiscal scares) | FTSE 100 revenues mostly international; weak sterling boosted earnings |
The practical implication is straightforward: in many cases, the index and the economy are telling structurally different stories. Five minutes of composition research before acting on a macro headline can prevent a category error that compounds over years.
What the data actually tells you before your next allocation decision
The economy and the stock market are related but distinct objects. They measure different things and reward different stakeholders. GDP growth that accrues to the state, to workers, or to consumers does not arrive in your brokerage account.
The replacement framework is specific: base your allocation decisions on earnings quality, ROIC and capital allocation, index composition, and valuation. Not on GDP forecasts or political headlines.
This does not mean ignoring macro entirely. At genuine extremes, capital controls, sovereign default, and hyperinflation do override company-level fundamentals. The lesson is calibration, not dismissal.
The economy and the stock market measure different things and reward different stakeholders. Growth that does not flow to listed-company profits does not flow to you.
The investor who can distinguish between economic noise and genuine systemic risk, and who reads index composition before acting on a country view, is operating at a structural advantage over those who trade on headlines. That advantage compounds with every allocation decision you make.
This article is for informational purposes only and should not be considered financial advice. Investors should conduct their own research and consult with financial professionals before making investment decisions. Past performance does not guarantee future results.