NAND flash has spent years trading as a commodity cyclical, its pricing rhythm set by smartphone refresh rates and PC inventory drawdowns. Wall Street’s NAND models still lean heavily on those consumer demand signals. That framing is about to break.
Citi Research has identified a structurally different demand leg forming beneath the surface. Agentic AI inference workloads, specifically autonomous systems running multi-turn reasoning tasks with million-token context windows, are consuming NAND the way databases consume RAM. Not as passive storage, but as live working memory. That is a category change in how flash gets used, not a seasonal demand spike.
Here is the mechanism behind the claim, the per-rack and aggregate numbers that support it, and the specific indicators that will tell you whether this NAND demand supercycle is materialising as projected or stalling at the prototype stage.
Why AI inference broke the old storage model
Traditional enterprise storage scales with data volume. A company generates more records, more logs, more files; it buys more capacity. The growth function is roughly linear with business activity, and the latency requirement is forgiving.
Agentic AI inference scales with something entirely different: active task state. As AI agents run multi-step, multi-turn reasoning sessions with million-token context windows, the Key-Value cache (the stored keys and values generated by each attention layer at each token position) produced by attention layers expands into territory that GPU memory and DRAM cannot economically contain. The KV-cache is not archival data. It is live working memory that must remain available at low latency across the duration of a task.
The industry’s bottleneck has shifted accordingly. The previous hardware narrative centred on training. Today’s constraint is inference, where KV-cache retention and retrieval dominate resource usage, not raw compute throughput. TrendForce reports that heavy enterprise users are consuming up to 4 times more tokens than prior workloads. SiliconANGLE describes context and KV-cache volumes as “swelling into the petabytes, outpacing what GPU and DRAM memory tiers can absorb.”
The training vs inference split is the underlying reason KV-cache has become the dominant resource constraint in production AI deployments; training optimises for throughput across a fixed dataset, while inference must sustain low-latency memory access across unpredictable, concurrent agent sessions that grow in length over time.
That 4x token consumption figure is not an incremental demand story. It tells you the storage requirement per deployed agent is growing faster than agent headcount, which means the demand curve steepens as adoption scales.
Forrester token consumption analysis quantifies the scaling dynamic precisely: a single AI agent consumes four times as many tokens as a standard chat interaction, and a multi-agent system consumes fifteen times that amount, which means NAND demand per deployed cluster compounds sharply as enterprises move from single-agent pilots to coordinated multi-agent deployments.
- Traditional enterprise storage: demand driven by data volume; tolerant of higher latency; growth roughly linear with business activity; stores static or infrequently accessed records
- Agentic AI inference storage: demand driven by active task state and KV-cache size; requires low-latency access throughout each session; growth accelerates with usage intensity and context length; stores live, continuously referenced working memory
When big ASX news breaks, our subscribers know first
What context memory extension architecture actually does
GPU memory is scarce and expensive. High Bandwidth Memory (HBM), the ultra-fast memory stacked directly on GPU packages, delivers extraordinary throughput but ships in limited quantities at premium cost. DRAM faces similar capacity and cost ceilings. Neither tier can absorb petabytes of live KV-cache at the price points that make large-scale inference deployments economically viable.
Context memory extension (CMX) architectures solve this by offloading warm inference states and KV-cache entries from HBM and DRAM down to high-throughput NVMe enterprise SSDs (solid-state drives connected via the NVMe protocol for high-speed data transfer) positioned physically and logically close to GPU clusters. These SSDs are not handling cold archival data. They perform real-time KV-cache offload, context swapping, and low-latency retrieval, functioning as an elastic extension of the AI memory stack.
Peer-reviewed SSD-backed KV cache research published in May 2026 confirms that KV-cache footprints routinely exceed both GPU HBM and CPU DRAM capacity as context windows lengthen, validating the architectural necessity of NVMe SSD offload as a structural rather than provisional design choice.
CapitalSight notes that retaining full KV-cache across high-concurrency inference networks requires petabyte-scale daily storage throughput. Citi Research identifies CMX-related NAND demand as the primary structural driver of new enterprise NAND consumption. Marvell has emphasised that AI workloads are forcing SSD vendors to design GPU-native drives with fundamentally different access patterns: high IOPS (input/output operations per second), low latency, and GPU-initiated reads rather than traditional CPU-attached storage architecture.
The shift to GPU-native SSD design signals that the addressable market for enterprise NAND is no longer defined by server procurement cycles. It is defined by AI infrastructure architecture decisions made at the silicon and rack level.

| Memory tier | Example technology | Latency profile | Role in CMX architecture | Cost characteristic |
|---|---|---|---|---|
| HBM | HBM3E | Lowest (nanoseconds) | Active compute, hottest KV-cache | Highest per GB |
| DRAM | DDR5 | Low (tens of nanoseconds) | Warm KV-cache buffer | High per GB |
| Near-GPU NVMe SSD | Enterprise TLC/QLC SSD | Moderate (microseconds) | CMX offload, context swap, elastic KV store | Moderate per GB |
| Cold object storage | HDD / cloud object tier | High (milliseconds) | Archival, not used in live inference | Lowest per GB |
Jensen Huang, CES 2026: Nvidia’s CEO characterised the near-GPU storage opportunity as a “completely unserved market” that could become the “largest storage market in the world,” effectively holding the working memory of AI systems.
The Vera Rubin numbers and what they imply at scale
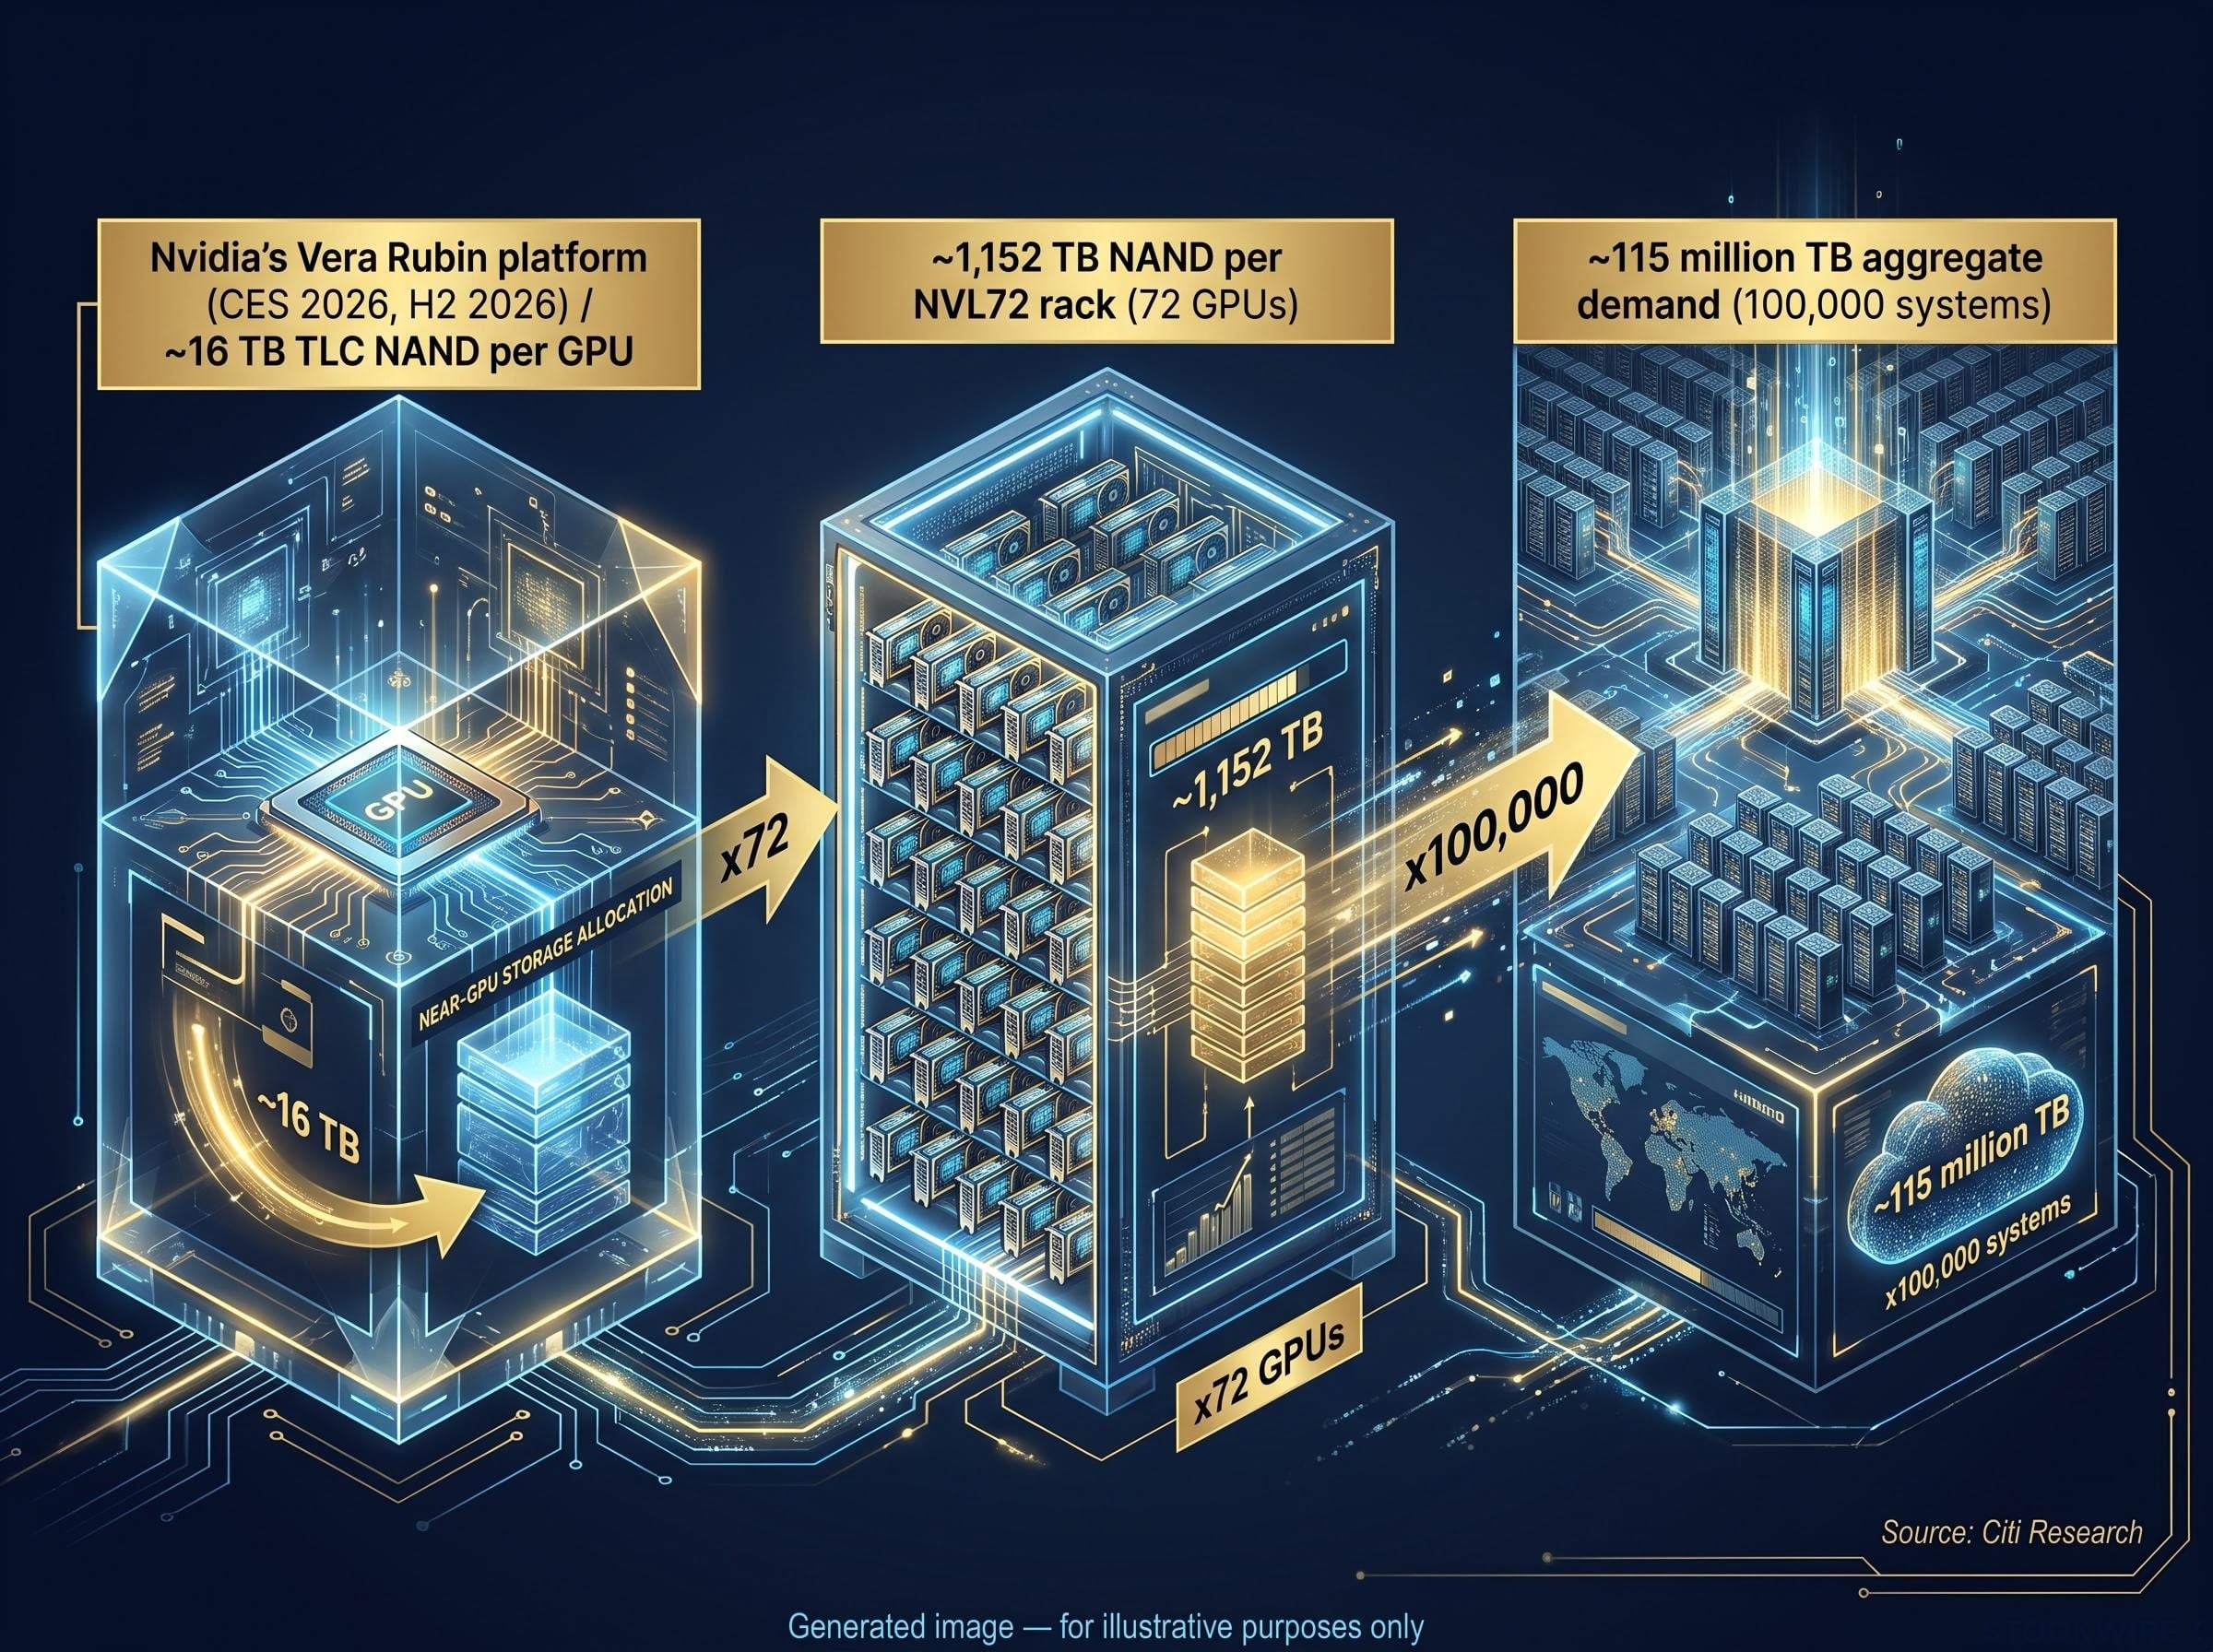
Nvidia’s Vera Rubin platform, announced at CES 2026 with production ramping in the second half of 2026, provides the clearest single data point for how much NAND is now being architected into AI systems at the rack level.
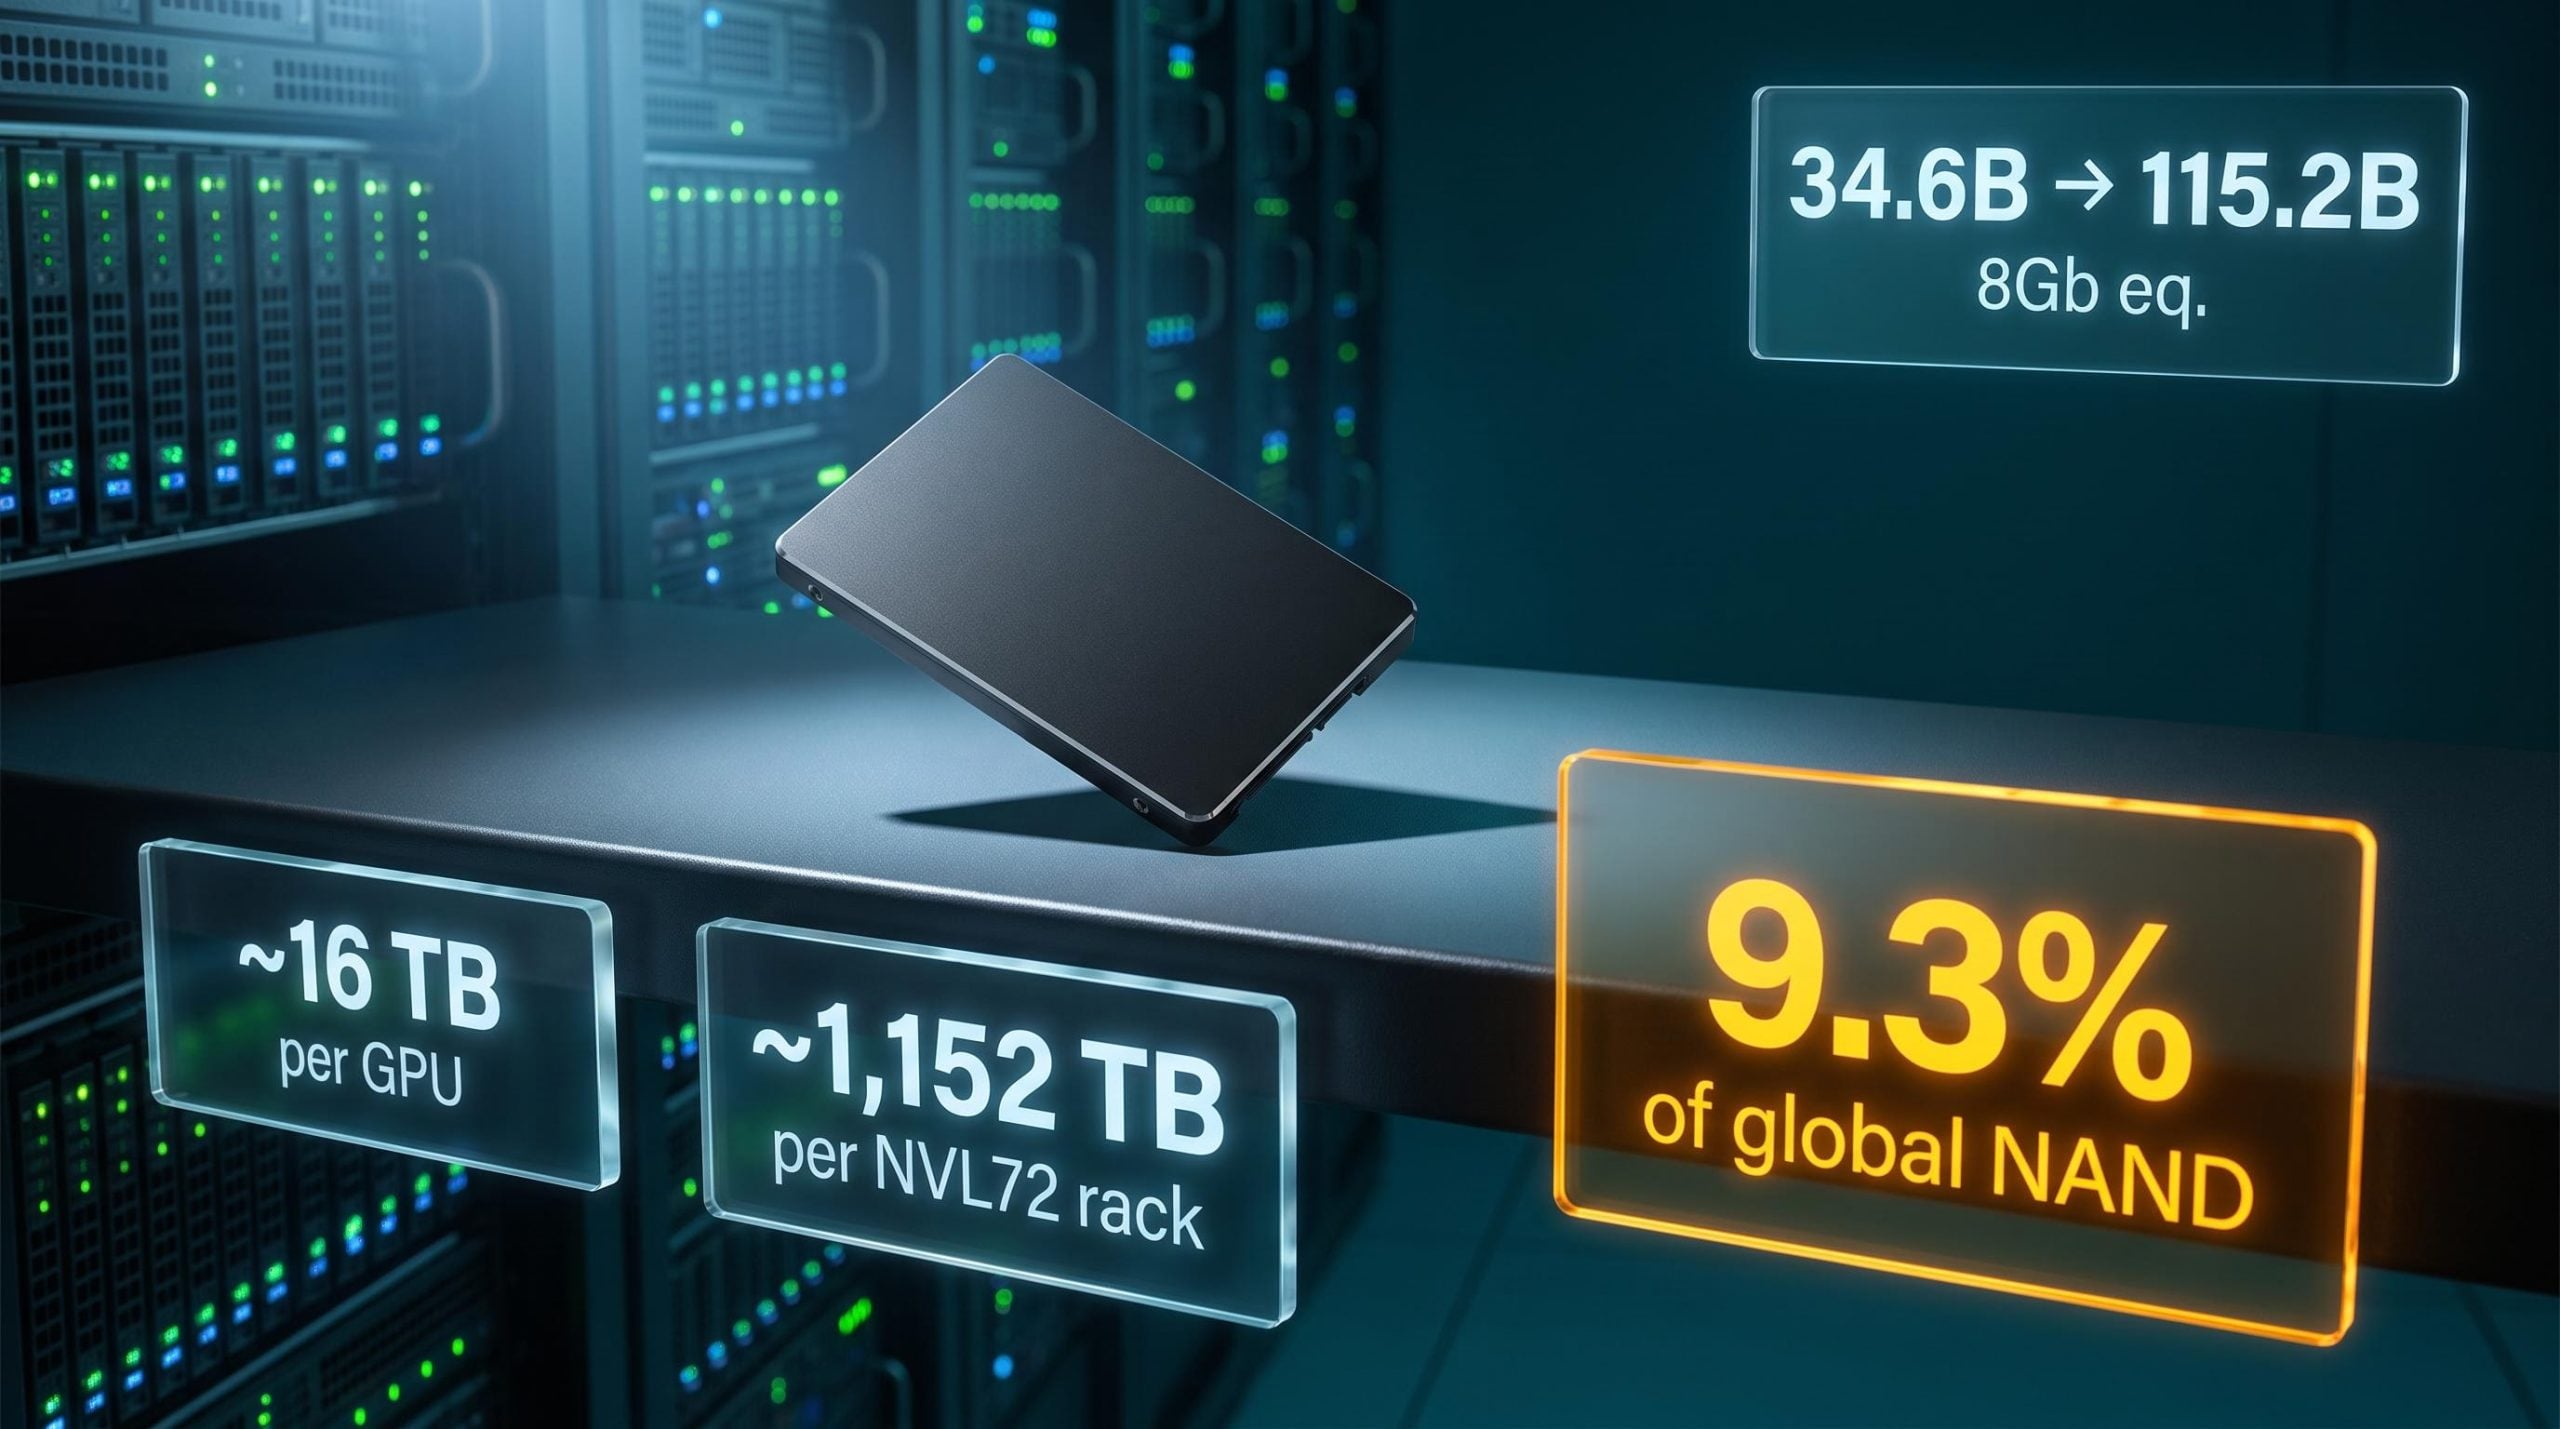
According to Citi Research, each GPU in a Rubin system is allocated around 16 TB of TLC NAND dedicated to CMX operations. Scaled across an NVL72 rack configuration (72 GPUs per rack), that yields a total of roughly 1,152 TB of SSD capacity per deployed system.
Citi Research formalised the demand estimate further. The bank projects that CMX-related NAND consumption begins at 34.6 billion 8Gb equivalents, a share equivalent to roughly 2.8% of total global NAND production, before scaling upward to 115.2 billion 8Gb equivalents, which would represent approximately 9.3% of worldwide output.
| Metric | Figure | Source |
|---|---|---|
| NAND per GPU (TLC) | ~16 TB | Citi Research |
| NAND per NVL72 rack | ~1,152 TB | Citi Research |
| Aggregate demand (100,000 systems) | ~115 million TB | Citi Research extrapolation |
| CMX demand, initial estimate | 34.6 billion 8Gb eq. (~2.8% of global NAND) | Citi Research |
| CMX demand, growth estimate | 115.2 billion 8Gb eq. (~9.3% of global NAND) | Citi Research |
Moving from 2.8% to 9.3% of global NAND output tied to a single application category within one generation of GPU architecture is not a rounding error. It represents a demand source large enough to shift the market from oversupply to balance without any recovery in consumer NAND demand.
Citi Research frames CMX-related NAND as non-discretionary enterprise infrastructure, meaning system architects cannot reduce SSD allocation without directly degrading model quality, inference latency, and per-token economics.
The broader near-GPU storage trend is also moving toward QLC (quad-level cell) NAND for its density and cost advantages, though Rubin’s CMX specification uses TLC. These are complementary dynamics, not contradictory ones: TLC handles the most latency-sensitive tier while QLC expands capacity at lower cost per gigabyte across the wider fleet.
How this supercycle differs from the smartphone and 5G era
The word “supercycle” has been applied to NAND before. Smartphone adoption, 5G rollouts, and generic cloud build-outs all attracted the label. Each ran into the same failure mode: consumer saturation and inventory overhang caused by discretionary purchasing decisions.
The current AI-driven demand leg differs along three structural axes. First, it is bounded by GPU cluster deployments and data-centre capital expenditure, not by how many phones or PCs ship in a quarter. Second, the storage intensity is non-discretionary: system architects cannot cut KV-cache or context allocation without directly degrading model quality, latency, and throughput. Third, demand is usage-linked. As enterprises deploy more agents handling longer tasks, token volumes and context lengths rise, pulling more live state into SSDs. Demand grows with usage, not just with installed base.
The broader memory chip supercycle context matters here: hyperscaler capex from the four largest U.S. cloud operators is projected at $725 billion in 2026, and AI data centre operators now account for an estimated 70% of total memory shipment volumes, making the data centre the dominant demand centre for the entire industry.
| Dimension | Smartphone / 5G NAND cycle | AI infrastructure NAND cycle |
|---|---|---|
| Demand driver | Consumer device sales | GPU cluster deployments, data-centre capex |
| Saturation mechanism | Replacement cycle slowdown, inventory glut | Bounded by compute and power availability |
| Demand persistence | Fades as upgrade cycles lengthen | Usage-linked; grows with agent workloads and context length |
| Key monitoring indicator | Smartphone shipment data, carrier capex | GPU cluster configs, enterprise AI agent token volumes |
TrendForce notes that agentic AI deployments are still nascent, meaning structural NAND demand from large-scale multi-agent systems in finance, healthcare, legal, and industrial sectors is not yet fully reflected in conventional forecasts. Usage-linked demand growth means the NAND demand curve from AI agents steepens as enterprise adoption matures. If you apply a prior supercycle mental model to this cycle, you risk mispricing both the timing and the duration of the demand uplift. The adoption curve here follows enterprise software dynamics, not consumer electronics replacement cycles.
What the supply side tells you about pricing direction
The demand argument is only half the equation. What matters for pricing is how that demand interacts with a concentrated supply base.
The NAND supply industry is structurally concentrated among a handful of producers, which means even marginal demand shifts from a new application category carry outsized pricing implications relative to fragmented commodity markets. Suppliers are already responding. TrendForce observes a polarisation of NAND demand between consumer and client applications on one side and AI-driven infrastructure on the other, with producers reallocating wafer output toward data-centre SSDs. High-capacity QLC enterprise SSDs are “especially limited,” according to TrendForce and InElectronics, because AI infrastructure is pulling those products into near-GPU roles at scale.
Citi Research modelled a scenario in which new enterprise application categories take up available supply and push memory prices upward, independently of any rebound in consumer NAND demand. If suppliers are already reallocating toward enterprise SSDs under a demand profile that Citi estimates at 2.8% of global NAND today, the pricing signal embedded in those allocation decisions may be leading the formal demand curve by several quarters.
The NAND price trajectory already visible in supplier financials supports the structural repricing argument: NAND flash is projected to rise approximately 234% across 2026 as a whole, with major producers recording simultaneous year-on-year earnings growth above 900%, a pattern consistent with industry-wide pricing power rather than individual outperformance.
Observable supply-side indicators worth monitoring:
- Wafer allocation commentary from NAND producers during earnings calls, specifically any shift toward enterprise or data-centre SSD product lines
- Enterprise versus client SSD pricing divergence, which would confirm that infrastructure demand is repricing supply away from consumer-grade applications
- Revenue mix shift toward data-centre SSD products in quarterly filings from major NAND producers
- Capital expenditure guidance directed at enterprise capacity expansion
TrendForce describes the current dynamic as a “structural expansion in memory demand,” driven by agentic AI workloads shifting industry focus from training to inference.
The indicators worth tracking as this demand leg develops
The structural argument maps onto a specific set of forward indicators that can convert the thesis into an ongoing monitoring framework.
Citi Research’s demand progression, from 34.6 billion to 115.2 billion 8Gb equivalents (approximately 2.8% to 9.3% of global NAND output), provides the concrete benchmark. Actual shipment data and pricing trends from NAND producers can be measured against this range to track whether the demand leg is arriving ahead of, on, or behind schedule.
| Indicator category | Specific data point | Positive signal |
|---|---|---|
| GPU cluster deployments | Announced NVL72-class system orders | Rising deployment count; each system = ~1,152 TB SSD demand |
| Enterprise AI agent usage | Token volume reporting from Salesforce, Microsoft, ServiceNow | Sustained growth in concurrent agent workloads and context lengths |
| SSD pricing divergence | Enterprise vs. client SSD ASPs | Widening spread indicating infrastructure demand crowding out consumer supply |
| NAND producer allocation | Management commentary on wafer mix, product allocation | Shift toward data-centre SSD products at the expense of client/embedded NAND |
| CMX demand vs. benchmark | Actual shipments vs. Citi’s 34.6B-115.2B 8Gb eq. range | Shipments tracking at or above the initial estimate |
Enterprise AI agent adoption metrics, particularly token usage reporting from major SaaS providers, serve as a leading proxy for KV-cache pressure that precedes the NAND demand signal by one to two quarters. The value of this indicator set is that it decouples the monitoring task from consumer electronics data, where AI-driven NAND demand simply would not appear in the traditional metrics analysts have historically used to call the NAND cycle.
What this structural shift means for how NAND gets priced and valued
The net effect of everything above is a role change for NAND. It is transitioning from a consumer-cycle commodity to a core determinant of AI system throughput, latency, and per-token economics. If that role shift sustains, it carries implications for how NAND producers get valued: as infrastructure suppliers with inelastic demand characteristics rather than discretionary consumer component makers.
Enterprise NAND repricing is already visible at the producer level: SanDisk reported 252% year-over-year revenue growth and a 78.4% non-GAAP gross margin in Q3 2026, with AI data centres absorbing approximately 70% of high-end NAND production and hyperscalers shifting from spot purchasing to multi-year supply contracts.
The degree to which agentic AI adoption scales across enterprise verticals, in finance, healthcare, legal, and industrial sectors, over the next 12 to 24 months is the primary variable determining whether Citi’s 9.3% global NAND share estimate proves conservative or premature. Morgan Stanley projects AI NAND demand reaching 41% of total NAND by 2027, though this figure has not been independently confirmed and should be treated as one projection among several.
Jensen Huang, CES 2026: The near-GPU storage market is a “completely unserved market” that could become the “largest storage market in the world.”
If the infrastructure-grade demand argument holds, NAND pricing cycles will increasingly decouple from consumer electronics seasonality. The traditional playbook for timing NAND exposure may need to be recalibrated around enterprise AI capex calendars instead.
The recalibration is not a forecast. It is an architectural reality already embedded in systems shipping in the second half of 2026. How far it extends depends on variables you can now track with specificity.
This article is for informational purposes only and should not be considered financial advice. Investors should conduct their own research and consult with financial professionals before making investment decisions. Financial projections referenced in this analysis are subject to market conditions and various risk factors. Past performance does not guarantee future results.