Bloom Energy has swung more than 200 points in a single month. The stock traded above $351 and below $150 within roughly 30 days, and the options market is now pricing in another $50-point move in either direction over the next 53 days. What is unusual is not the size of that expected move. What is unusual is that upside bets at the same dollar distance from the stock price carry almost double the premium of their downside equivalents.
That asymmetry is not noise. It is a deliberate signal embedded in the options pricing structure, and knowing how to read it separates traders who understand what the market is actually communicating from those who see only a stock moving fast. At 93% implied volatility, Bloom Energy is one of the most instructive live case studies in options markets right now for understanding how implied volatility (IV), skew, and delta interact in extreme-momentum names.
Here is a practical toolkit for decoding options pricing signals in any high-volatility stock, using Bloom Energy as the working example throughout. You will finish with a framework you can apply independently to any name with an elevated IV reading, not just facts about one ticker.
What 93% implied volatility actually says about Bloom Energy
Implied volatility is the options market’s consensus estimate of how much a stock’s price is likely to vary over a given period. It is derived from actual options prices, not from historical movement. When you see an IV reading of 93%, that number is annualised, meaning it describes the expected range of movement over a full year. But you are rarely trading a full-year time horizon, so you need to scale it down.
The implied volatility basics that underpin this calculation come from reverse-engineering live options prices through the Black-Scholes model, not from measuring past stock movement, which is why IV can change dramatically overnight even when the stock itself has not moved.
That is where the number on your screen starts to mean something concrete.
Converting the annual percentage into a dollar range
The standard approach for translating annualised IV into a shorter-term expected move uses the square root of time. You take the stock price, multiply it by the IV percentage, and then multiply by the square root of the number of trading days in your horizon divided by 252 (the approximate number of trading days in a year).
For Bloom Energy near $206 with 93% IV over a 53-day cycle, that calculation produces an implied move of approximately ±$50. Over a 30-day window, with at-the-money IV in the 80-88% range, the implied move narrows to roughly ±$22. In an elevated weekly cycle with IV near 90-99%, you get an implied one-standard-deviation move of approximately ±$16 in just a few days.
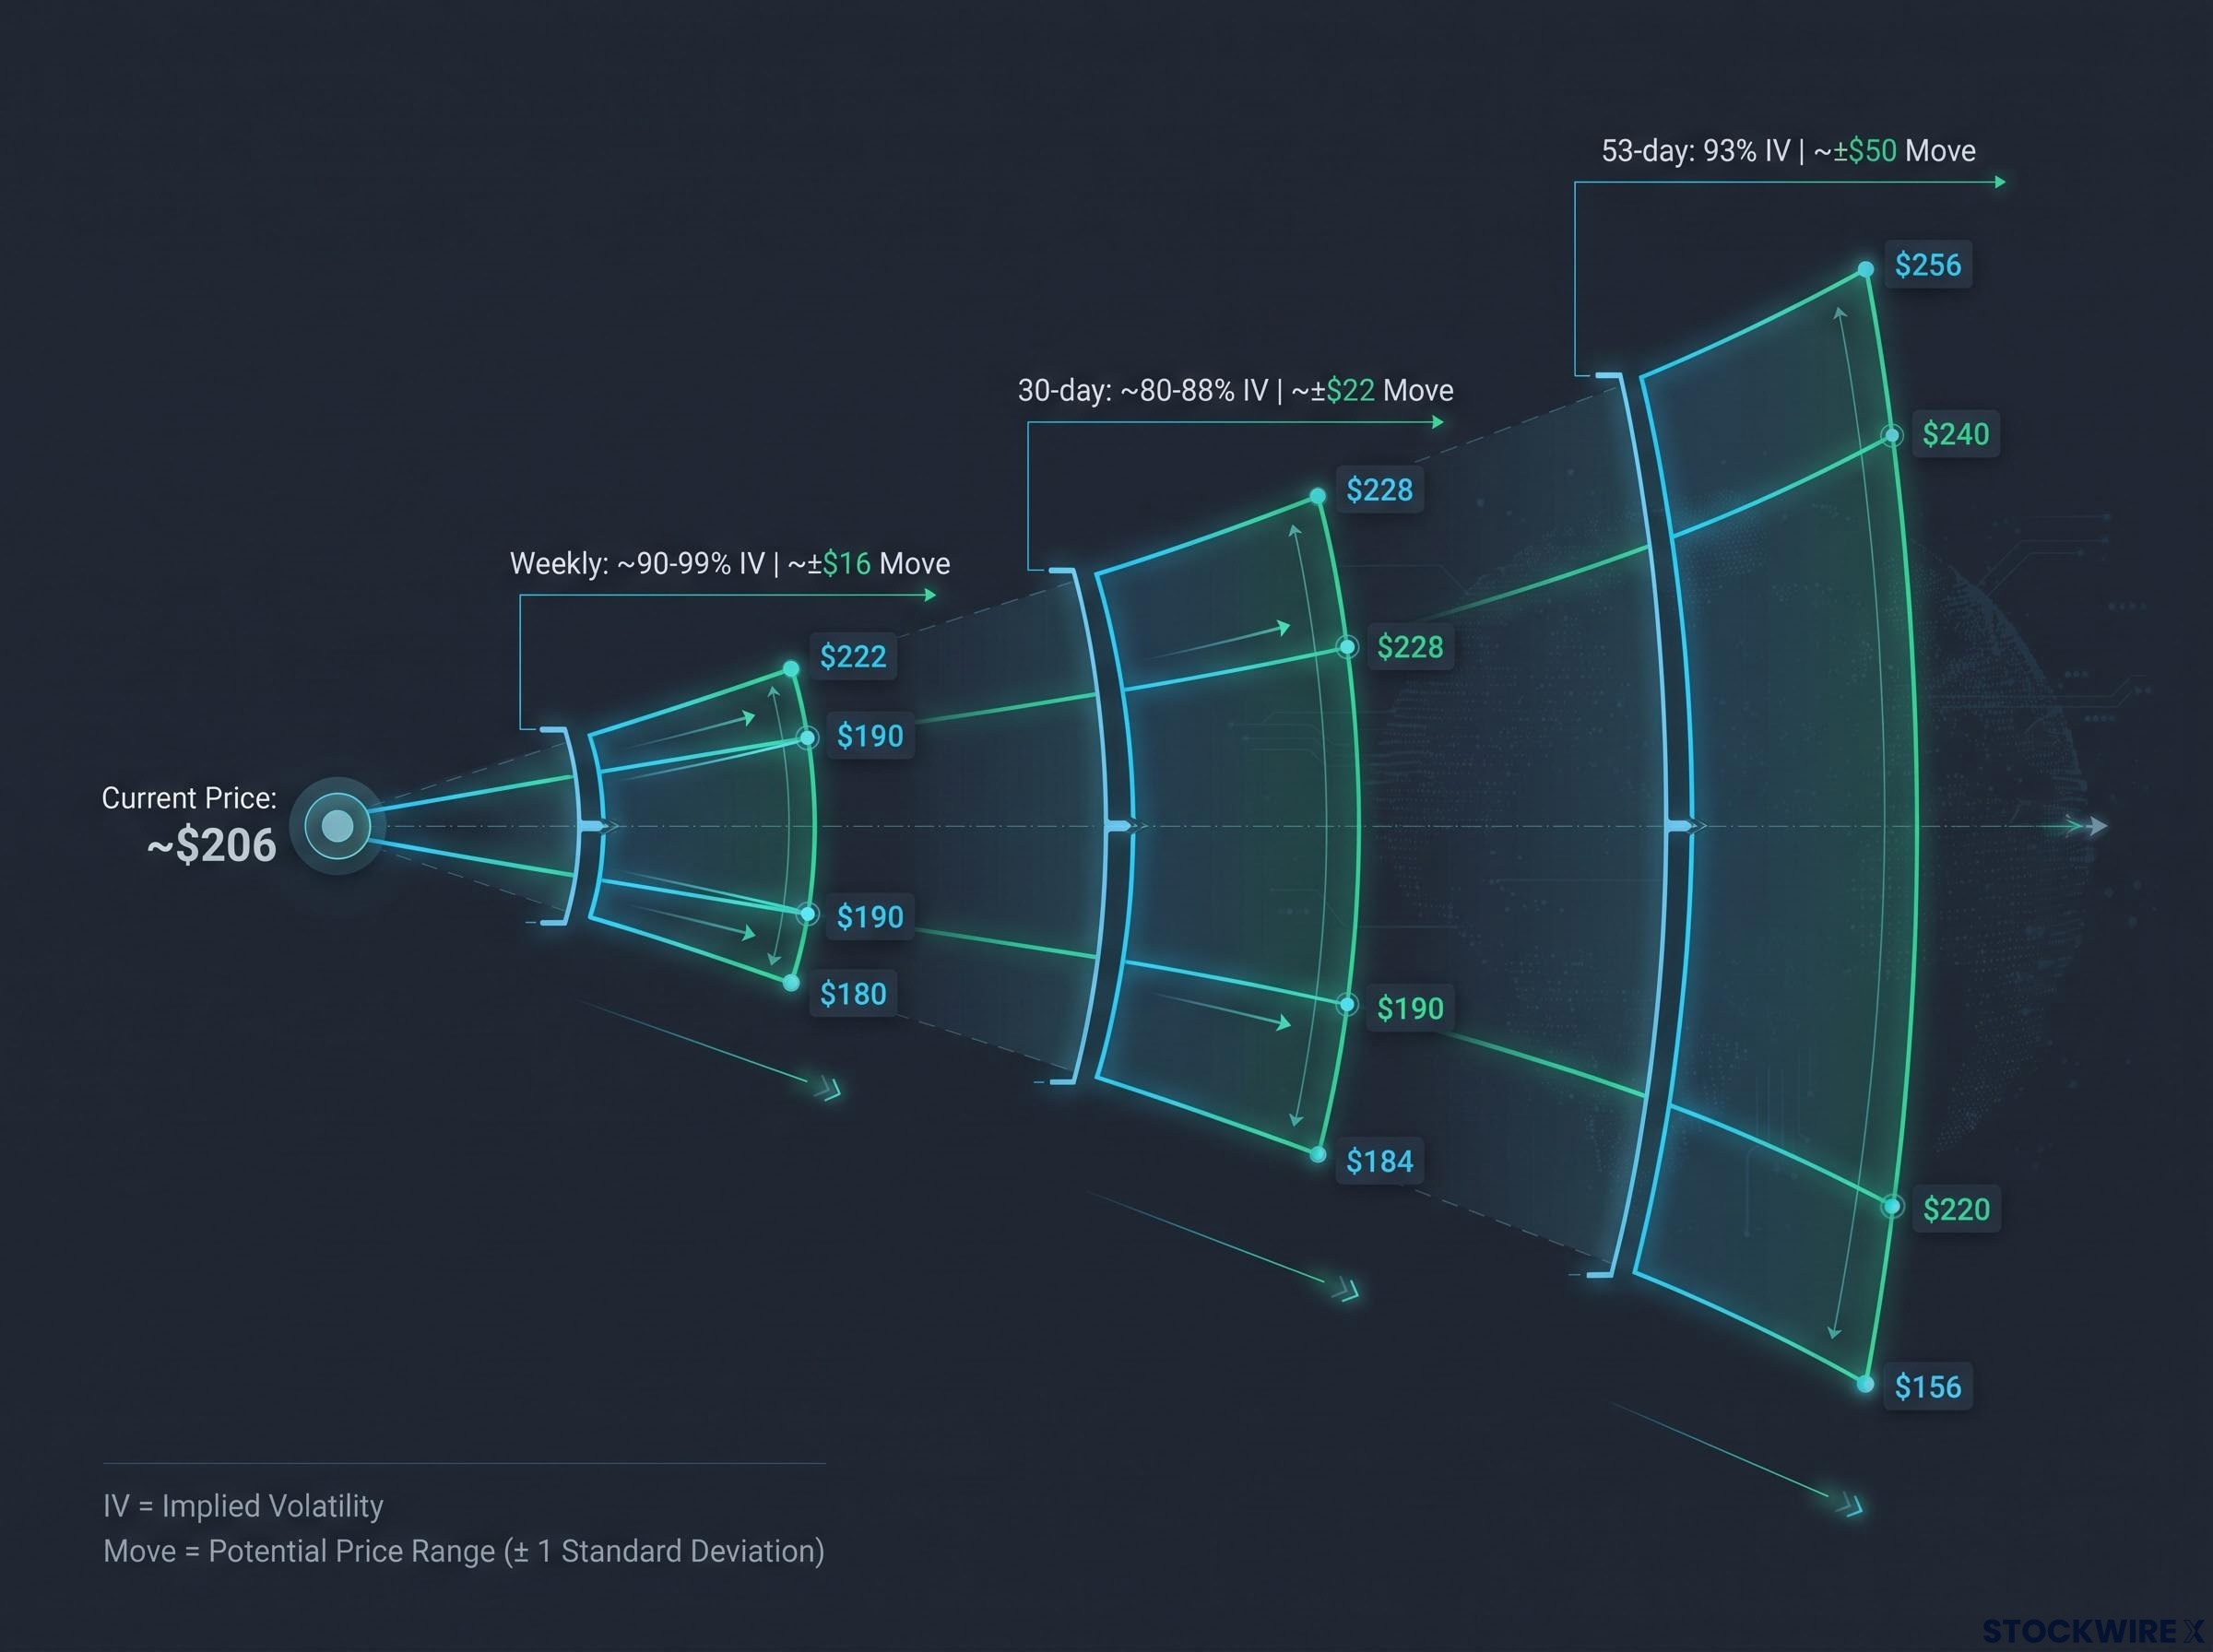
| Time horizon | IV reading | Implied ±move (1 standard deviation) |
|---|---|---|
| Weekly (elevated periods) | ~90-99% | ~±$16 |
| 30-day | ~80-88% | ~±$22 |
| 53-day cycle | 93% | ~±$50 |
These are one-standard-deviation bands. That means the market expects the stock to land inside that range roughly two-thirds of the time. The remaining one-third of outcomes fall outside it. In practice, extreme-momentum stocks often have fatter tails than a normal distribution assumes, which means moves beyond the band can occur more frequently than the two-thirds framing suggests.
The ±$50 implied move over 53 days tells you the options market assigns a roughly one-in-three chance of Bloom Energy moving outside a 100-point band. That is not a tail-risk warning. That is the market’s baseline expectation for a normal outcome.
For you as a trader, translating IV into dollar terms turns an abstract percentage into a concrete decision variable. If you know the market is pricing ±$50 in 53 days, you can size positions, select strikes, and set exit levels with real reference points rather than guesswork.
When big ASX news breaks, our subscribers know first
Why Bloom Energy’s price history made 93% IV inevitable
The numbers speak before the analysis needs to arrive.
- 52-week low: approximately $47.83
- Rally high: above $351
- Sharp pullback: near $150 within roughly one month of the high
- Recent trading level: around $206
The stock moved from roughly $230 to over $330 within approximately five trading days in early June. It then reversed from $351 to near $150 in about a month, a roughly 200-point swing in compressed time.
Bloom Energy gained approximately 291% in 2025 and is up approximately 135% year-to-date through late August 2026.
That kind of track record is the raw material options market makers use to price future contracts. Realised volatility, meaning the variability the stock has already demonstrated, is the single strongest anchor for implied volatility in subsequent options pricing. When a stock has repeatedly traversed enormous ranges in short periods, the options market does not treat those moves as one-off events. It prices them as the stock’s demonstrated operating tempo.
The distinction matters for you. Temporarily elevated IV, the kind that spikes around a single earnings report or FDA decision, tends to fade quickly once the event passes. Structurally elevated IV, the kind anchored by a stock’s track record of multi-hundred-percent moves, persists because the underlying behaviour persists. Bloom Energy falls firmly in the second category, and that changes how you should evaluate any premium-selling or premium-buying strategy. You are not trading inflated fear. You are trading a stock that has earned its volatility reading through repeated, documented large moves.
How the call-put price gap reveals the market’s directional lean
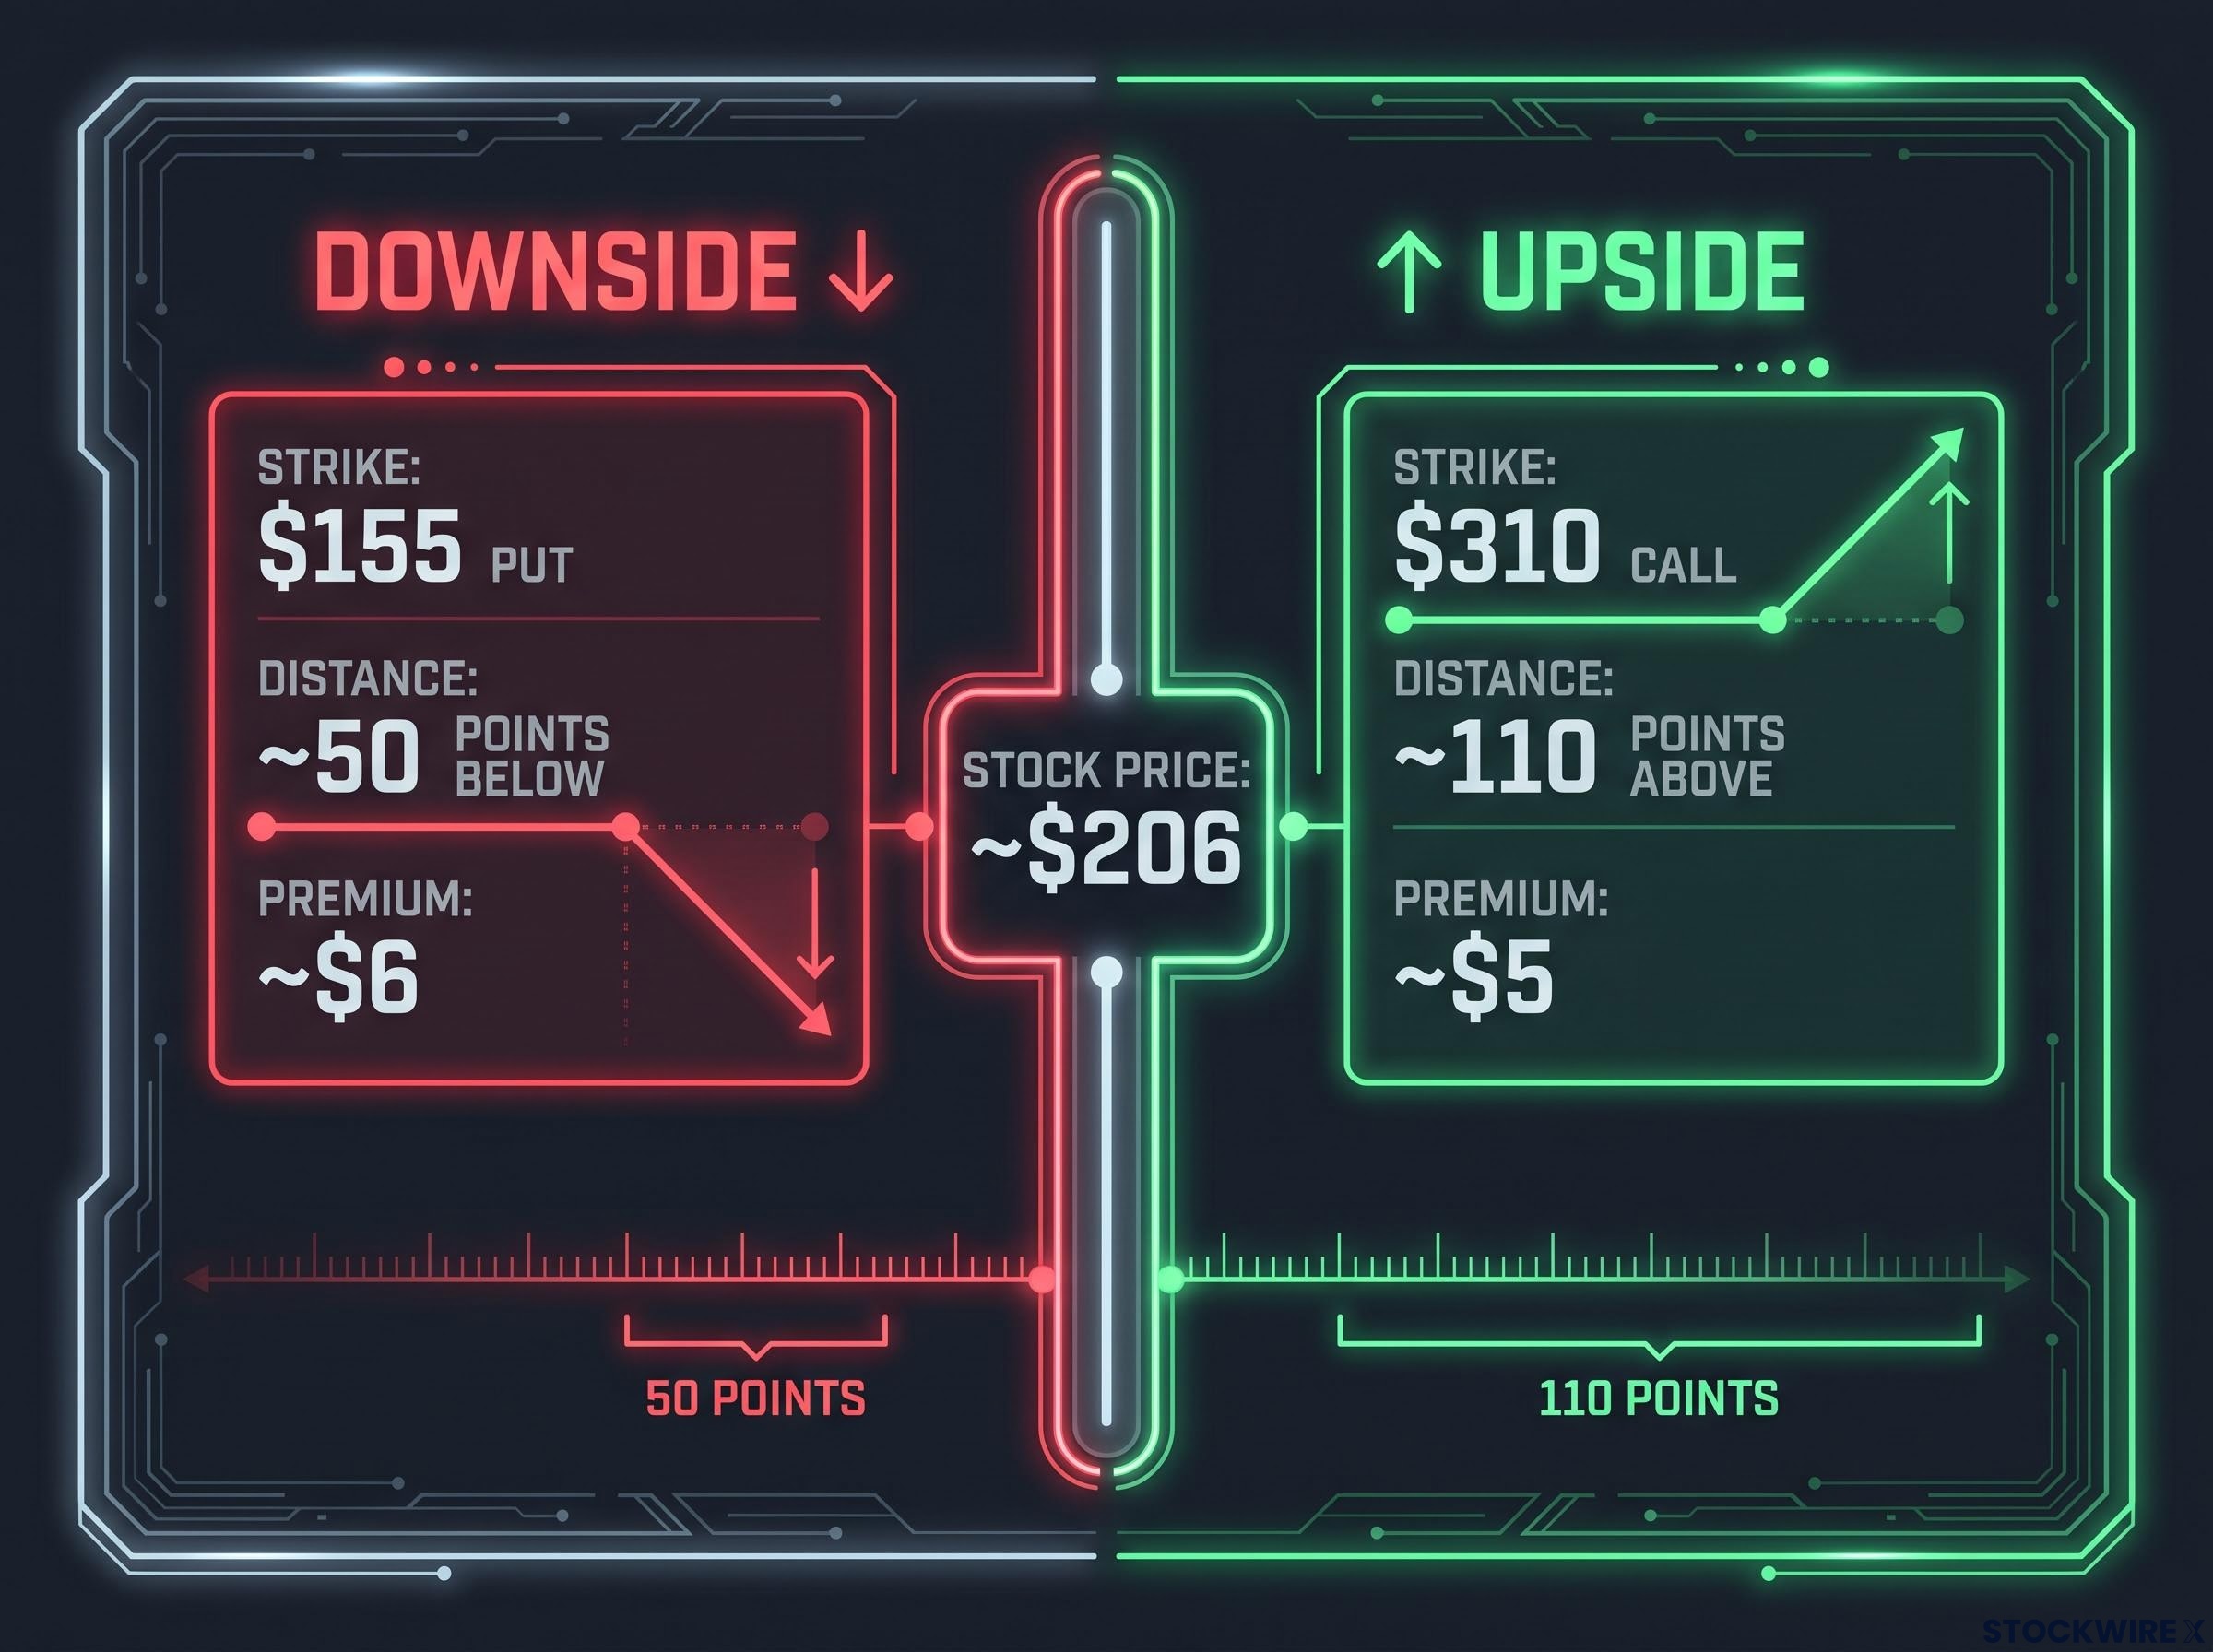
Place two options side by side and a puzzle emerges. The $155 put trades at approximately $6, sitting around 50 points below the stock price at the time of analysis. The $310 call trades at approximately $5, yet it sits more than 110 points above the stock price. Comparable premium, but the call is at more than double the distance from the current price.
Zoom out further. The $150 put and $350 call, representing the stock’s recent trading range extremes, were priced at approximately $1,380 and just under $1,300 respectively. Near-equivalent premiums despite being at opposite ends of a 200-point range. The $350 call at year-end expiration carried approximately 11% probability of finishing in the money.
Options on the upside are commanding a premium rate roughly double that of puts positioned at the same dollar distance below the current stock price.
Options skew is the divergence in implied volatility, and therefore premium, between calls and puts at equivalent distances from the current stock price. The direction and magnitude of that skew are themselves informational signals. In Bloom Energy, the skew leans heavily upside. The question is why.
Three reasons the calls cost more than the puts
The zero-floor asymmetry. Downside is bounded at zero, while upside carries no equivalent ceiling. When IV is extreme, this mathematical reality becomes economically significant. A far-out-of-the-money call in a 93% IV environment captures more potential distance than an equivalent-distance put, making it structurally more valuable even before any directional view is applied.
Active institutional call flow. Recent analysis has highlighted substantial long-dated bullish call positioning in Bloom Energy, even on weak trading days in the underlying stock. When large participants accumulate upside exposure, that demand lifts call prices and contributes to higher implied volatility on the call side. The options market interprets this as a constructive long-term outlook from informed capital.
Fat-tailed deltas. A delta of approximately 13 on the $150 put indicates a low but non-negligible probability of the stock reaching that level. In a low-IV stock, a 10-13 delta option is genuinely remote. In a 93% IV environment, those same deltas represent meaningful probabilities of expiring in the money. Distant strikes are not long shots in the same way they would be for a stock with 20% IV.
Using delta as a probability estimate is a practical shortcut with real limits: in high-IV environments the model assumptions compress, and the same 13-delta put that looks remote on a low-volatility stock represents a meaningfully live scenario when the underlying has demonstrated 200-point swings in a single month.
| Strike | Distance from ~$206 | Approximate premium | Approximate delta |
|---|---|---|---|
| $155 put | ~50 points below | ~$6 | ~13 |
| $310 call | ~110 points above | ~$5 | N/A |
| $150 put | ~56 points below | ~$1,380 | ~13 |
| $350 call | ~144 points above | ~$1,300 | ~11% ITM probability (year-end) |
The near-equivalent pricing of the $150 put and $350 call tells you the options market does not treat a return to prior highs as a remote scenario. It treats upside and extreme downside as roughly symmetrical risks in probability-weighted dollar terms. If you are building any directional position in Bloom Energy, that skew should directly influence your strike selection, your hedge construction, and how you think about the risk-reward of a bearish stance.
A framework for reading options signals in any high-volatility stock
Everything above is specific to Bloom Energy, but the analytical sequence generalises to any name with elevated IV. Here are the five steps, in order, because each one builds on the prior.
- Translate IV into dollar terms. Take the annualised IV, apply the square-root-of-time scaling for your specific trading horizon, and convert the result into a dollar range around the current price. For Bloom Energy, 93% IV over 53 days produced ±$50. Do this before you look at any individual option chain.
- Compare call and put prices at similar distances from the stock price. This locates the skew. If the $155 put costs $6 and the $310 call costs $5 at more than twice the distance, the market is telling you it views upside as the more probable large move.
- Use deltas to assess how live distant strikes actually are. A 10-13 delta option in a 93% IV stock is not a lottery ticket. It carries real probability of expiring in the money. Read the deltas as probability statements, not as strike-distance labels.
- Examine how IV and skew shift across expirations. Near-term weekly IV near 99% versus a longer-dated 80% reading tells you the market distinguishes between immediate event risk and sustained structural uncertainty. The shape of IV across the term structure is a signal in itself.
- Size positions so a single loss is survivable. This is where analysis meets discipline.
Single-position risk should be capped at 5% of total portfolio value, and that figure sits at the upper boundary of sensible exposure. For traders placing positions regularly, keeping risk in the 1-3% range is far more appropriate. No amount of analytical confidence offsets the damage of outsized losses in a name capable of moving 100 points in a week.
A fixed-dollar-risk framework resolves the sizing problem mechanically: once a stop is placed, position size equals dollar risk divided by the distance between entry and stop, which removes discretion from the step most likely to be distorted by recent winners or the emotional pull of a high-conviction view.
With approximately 250 trading sessions annually, compounding even small per-trade losses across many trades can significantly erode your portfolio. A trade with 80% estimated probability of profit still carries a roughly 20% loss rate. If you are risking 10% of your account on each of those trades, the 20% of the time you lose will do more damage than the 80% winners can repair.
The position-sizing figures are not conservative suggestions. They are structural necessities in a stock that can lose or gain 50% in a short period. The framework’s value is that it makes that constraint explicit before you place a trade, not after a loss forces the lesson.
What the Bloom Energy options market is telling traders right now
Pull the threads together. Three signals are clear:
- Elevated IV as baseline: 93% implied volatility and a ±$50 implied move over 53 days mean the market is explicitly pricing large moves as its normal expectation for this stock. It is not hedging against a surprise. It is pricing in the surprise as the default scenario.
- Upside skew as directional lean: Call premiums at nearly twice the distance carrying comparable pricing to closer puts tells you the market assigns higher probability to sharp rallies than to equivalent sharp declines. Institutional call flow reinforces that lean.
- Live distant-strike deltas as fat-tail confirmation: The wings of the distribution are not decorative. A $350 call at year-end expiration carrying approximately 11% probability of finishing in the money, in a stock trading near $206, means the market sees roughly a one-in-nine chance of the stock nearly doubling again by year-end. That reframes how you should think about the risk-reward of any bearish position in Bloom Energy.
The options market is not guaranteeing a rally or a collapse. It is telling you which scenario it regards as more probable and more expensive to be wrong about.
When would these signals change? A sustained compression in IV or a rotation from call skew to put skew would be the indicators to watch. Until that shift occurs, the options market’s message remains: large moves are the baseline, and the upside carries more institutional conviction than the downside.
That framing gives you a decision-ready position. You can align with the consensus, hedge against it, or deliberately fade it, but any of those choices is better made from an informed starting point than from a blank screen showing only a stock price and a percentage change.
For readers wanting to apply the same five-step framework to a different high-momentum ticker before trading Bloom Energy, our full explainer on reading options chain signals walks through IV rank, skew mapping, expected-move brackets, term-structure comparison, and far-out-of-the-money crowding using HOOD’s live chain as the worked example.
This article is for informational purposes only and should not be considered financial advice. Investors should conduct their own research and consult with financial professionals before making investment decisions. Past performance does not guarantee future results. Options involve risk and are not suitable for all investors.