Consider a scenario where you placed $10,000 into an S&P 500 index fund in late 1999 and tracked its progress over the following eleven years. With every dividend ploughed back in and no shares ever sold, your balance at the end of 2010 would have stood at around $10,460. That is not a typo. Eleven years, and you gained less than $500.
Those eleven years from 1999 to 2010 were not one sustained collapse. They contained two distinct catastrophes, the dot-com implosion and the 2008 financial crisis, with a deceptive partial recovery between them that made each subsequent decline harder to absorb. Across that entire window, U.S. large-cap equities produced annualised nominal gains of roughly 0.4%, a figure so low it barely registers against inflation.
Here is why the history matters now: one investor came out of that lost decade with roughly $10,460. Another, starting with the same $10,000 but adding $500 a month throughout, came out with approximately $89,600. The five sections ahead show you exactly how that gap opened, why it compounded into a $650,000 outcome difference by mid-2026, and what five actions you can take today to position on the right side of that divide if a similar period arrives.
What actually happened to a $10,000 investment made in 1999
The lost decade did not feel like a single event while it was happening. It felt like two separate disasters with a cruel false recovery between them.
The opening losses came in three consecutive years. The S&P 500 dropped approximately -9.1% in 2000 as the technology bubble unravelled, then shed another -11.9% in 2001 as the collapse spread across the broader market. The third year was the most punishing: 2002 brought a fall of roughly -22.1%, compounded by corporate accounting scandals and a deepening recession.
By the end of 2002, your $10,000 had shrunk to roughly $6,300. Then something deceptive happened: markets rallied. 2003 through 2007 delivered meaningful positive returns. Your portfolio clawed its way back toward breakeven. The recovery felt real.
When 2008 struck, it erased what had been rebuilt. That year’s total return came in at -37.0%, a figure not seen since the Depression era, and it left portfolios well below where the decade had started.
| Year | S&P 500 Total Return | What Drove the Decline |
|---|---|---|
| 2000 | -9.1% | Dot-com bubble burst |
| 2001 | -11.9% | Technology collapse broadened, recession |
| 2002 | -22.1% | Accounting scandals, deeper recession |
| 2008 | -37.0% | Global financial crisis |
Positive years did occur within the window. 2003, 2009, and 2010 all delivered strong returns. They simply were not strong enough to overcome the depth of two separate crashes.
S&P 500 lost decade total returns, as tracked by independent market historians, confirm the full 2000-2009 period produced a cumulative nominal return of roughly -9%, with the 2008 drawdown alone coming in at approximately -37%, figures that align closely with the annual breakdown presented in the table above.
End-2010 result: Someone who committed $10,000 to an S&P 500 index fund on 31 December 1999, reinvested every dividend, and made no further contributions, would have held approximately $10,460 eleven years later. Total nominal growth across that period amounted to around 4.6%, or roughly 0.4% per year.
Patience alone, without any behavioural adaptation, offered no protection against this kind of prolonged weakness. Staying in the market was necessary. It was not sufficient.
When big ASX news breaks, our subscribers know first
What dollar-cost averaging actually did to the same decade
Now consider a second investor, Investor B, who started in the exact same position. Same $10,000 initial investment on 31 December 1999. Same S&P 500 index fund. Same dividends reinvested. One difference: Investor B added $500 every month from January 2000 through December 2010.
Dollar-cost averaging (DCA) means investing a fixed amount at regular intervals regardless of what the market is doing. When prices are high, your $500 buys fewer shares. When prices are low, it buys more. The strategy does not try to time the market; it simply removes the timing decision entirely.
Here is what that looked like during the lost decade: while the dot-com implosion of 2000-2002 was devastating to Investor A’s lump sum, it was quietly working in Investor B’s favour. Every month during those three brutal years, $500 was buying shares at prices 20-40% below their 1999 level. Those shares accumulated at depressed valuations, building a larger share count than would have been possible at higher prices. The same dynamic repeated during 2008: the worst single year for the market was one of the best years for accumulation.
When the recoveries arrived, in 2003 and again in 2009-2010, those lower-cost shares captured a disproportionate share of the upside. That is the mechanism. DCA does not guarantee positive returns. What it does is reduce the risk of catastrophic timing, and in volatile or flat environments like the 2000s, that timing risk reduction becomes its primary advantage.
It is worth noting that long-run studies often find lump-sum investing outperforms DCA in rising markets because more capital is deployed earlier. The 2000s were not a rising market. They were precisely the environment where DCA’s strengths emerge most clearly.
It is worth noting that lump-sum investing outperforms DCA in roughly 68-73% of historical periods because equity markets rise more often than they fall, meaning the 2000s were precisely the minority environment where sustained contributions protected investors from catastrophic entry-point timing.
The scoreboard at December 31, 2010
| Metric | Investor A (Lump Sum) | Investor B (Lump Sum + DCA) |
|---|---|---|
| Initial investment | $10,000 | $10,000 |
| Monthly contributions | $0 | $500 x 132 months = $66,000 |
| Total capital committed | $10,000 | $76,000 |
| Portfolio value, end-2010 | $10,460 | $89,600 |
| Gain above contributions | $460 (4.6%) | $13,600 (17.9%) |
The capital base difference is the number that matters most here. Investor B entered the post-2010 world with roughly 8.5 times the invested capital of Investor A. That gap was about to be amplified by what followed: a sustained bull run of historic proportions.
How the 2010-2026 bull market turned an 8.5x capital gap into a $650,000 outcome difference
The period from 2010 to mid-2026 delivered one of the most powerful sustained bull markets in U.S. history. The S&P 500 total return, with dividends reinvested, was in the neighbourhood of 8-9x on invested capital over that window.
Both investors experienced the same market. Neither made any additional contributions after 2010. The bull market did not choose between them. It simply multiplied whatever each had built through the difficult decade.
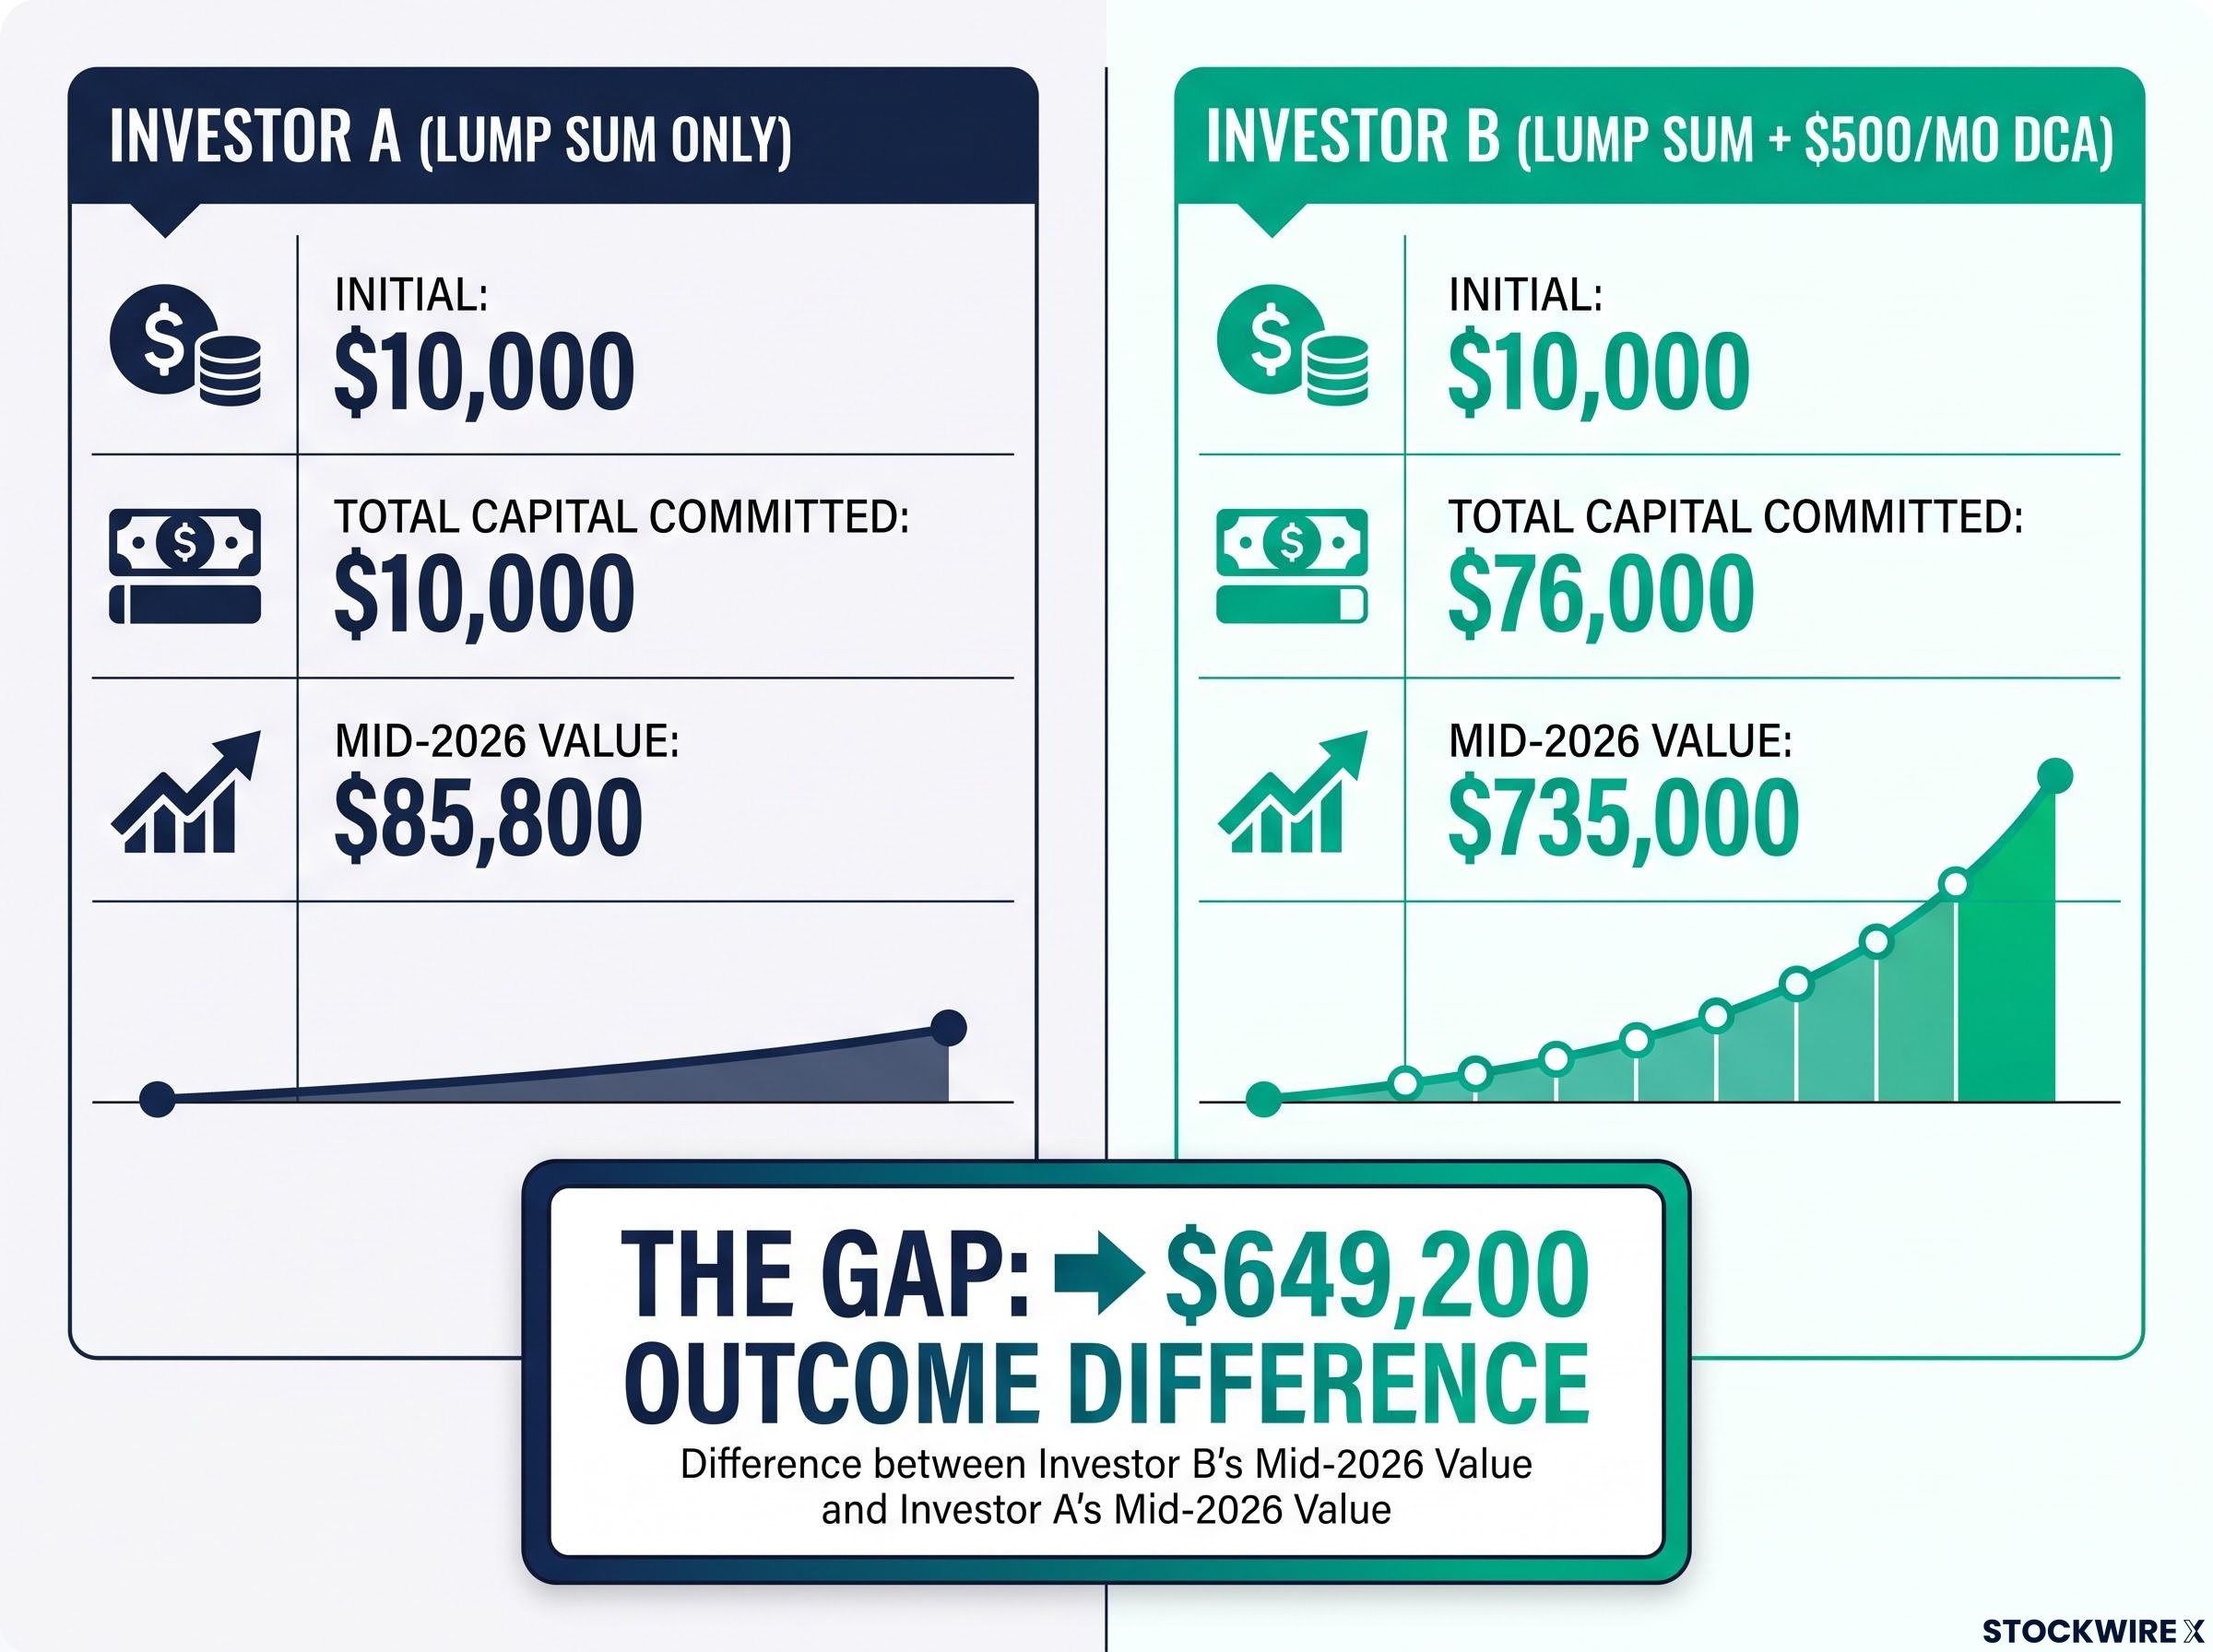
For Investor A, the $10,460 base grew to approximately $85,800 by mid-2026. A meaningful number in isolation, and proof that staying invested through the lost decade was better than selling. But next to Investor B’s outcome, it tells a different story.
The $89,600 that Investor B had accumulated by the end of 2010 grew to a portfolio worth approximately $735,000 by mid-2026.
Mid-2026 comparison: Investor A finished with roughly $85,800 while Investor B’s portfolio reached approximately $735,000, both using the same index fund across the same 26-year window. The gap between those two outcomes was $649,200.
Investor B’s key figures:
- Initial investment: $10,000
- Total contributions (1999-2010): $76,000
- Mid-2026 estimated portfolio value: $735,000
- Portfolio value relative to total capital committed: approximately 8.7x
The decision that determined the outcome was not made during the bull market. It was made during the lost decade. Investor B’s behaviour between 2000 and 2010, the sustained contributions, the continued reinvestment, the refusal to stop buying during two crashes, created the capital base that the subsequent 16 years of growth compounded.
All figures are approximate historical illustrations based on S&P 500 total return data with dividends reinvested. Actual outcomes vary by timing, fees, and implementation. These figures are not personalised investment advice.
What the lost decade actually teaches about building portfolio resilience
The data from the previous sections is not just a retrospective case study. It is a blueprint. Investor B was not lucky. Investor B was executing five specific behaviours that any investor can replicate. Here is what each one does and why it mattered during the 1999-2010 window.
- Sustained contributions through weakness. Regular monthly investing through both crashes is what separated the two outcomes in this comparison. The $66,000 in contributions made during the downturn years built a capital base that Investor A never had. Committing $76,000 in total versus $10,000 created the 8.5x disparity at end-2010 that subsequently grew into a $649,200 difference by mid-2026. Every other item on this list matters less if you do not keep this one.
- Dividend reinvestment. Dividend income plays a different role during extended weak markets than it does during strong ones. Rather than relying on price gains, reinvested dividends steadily add to your share count. At depressed prices, each pound or dollar of dividend income acquires more shares than it would have at higher valuations, and that expanded share count is then positioned to benefit fully when prices recover. Over the 2000-2010 window, the spread between price-only return and total return with dividends reinvested was substantial, and it meaningfully changed what investors ended up with.
- Diversification beyond a single market segment. During the dot-com period, value-oriented and dividend-focused holdings had meaningfully different performance profiles from U.S. large-cap growth. Not everything fell at the same rate. During 2008, correlations spiked and nearly everything declined, but diversified portfolios often experienced less severe drawdowns and maintained income from dividend-paying positions. Diversification does not guarantee positive returns during a crash. It manages the depth of drawdowns.
- Cash reserves for sequence-of-returns risk.
Sequence-of-returns risk and why retirement timing matters most
Sequence-of-returns risk is the danger that comes from being forced to sell investments at depressed prices to cover living expenses. This risk primarily affects retirees or those near retirement who are drawing down their portfolios rather than building them.
The mechanism is straightforward: if you need to withdraw $40,000 a year for living expenses and your portfolio has just dropped 37%, you are selling shares at the worst possible moment. Those shares are gone permanently. They will never participate in the recovery. The capital base shrinks irreversibly.
Investors who retired near 2000 and had not separated their living-expense cash from their equity exposure suffered this damage acutely. Two crashes in a decade left some retirees with portfolios that could never recover because too many shares had been liquidated at bottom prices.
Sequence-of-returns risk becomes most destructive in the first five years of withdrawals, when a portfolio decline forces share sales at depressed prices that permanently reduce the capital base available to participate in any subsequent recovery.
Cash reserve guideline: Historical recovery data from major market drawdowns suggests that holding the equivalent of at least three years of living expenses in accessible cash or lower-risk assets can protect investors from having to sell equities at depressed prices. Treat this as a starting reference point rather than a fixed rule, adjusting the figure to suit your own timeline and annual spending requirements.
- Unwavering commitment to a researched long-term plan. Quitting a strategy close to the bottom is the move that converts a temporary setback into a permanent one. An investor who halted contributions in 2002 or liquidated positions in 2008 did not simply miss out on subsequent gains. They crystallised their losses and forfeited all the compounding that followed. Sustained investing through difficult periods assumes prior research that supports confidence in your holdings.
Each of these five strategies is a lever you control. You cannot control market returns or the timing of downturns. You can audit your current portfolio against this list right now and identify which levers you have not yet pulled.
How to structure a portfolio that can absorb a decade of flat returns
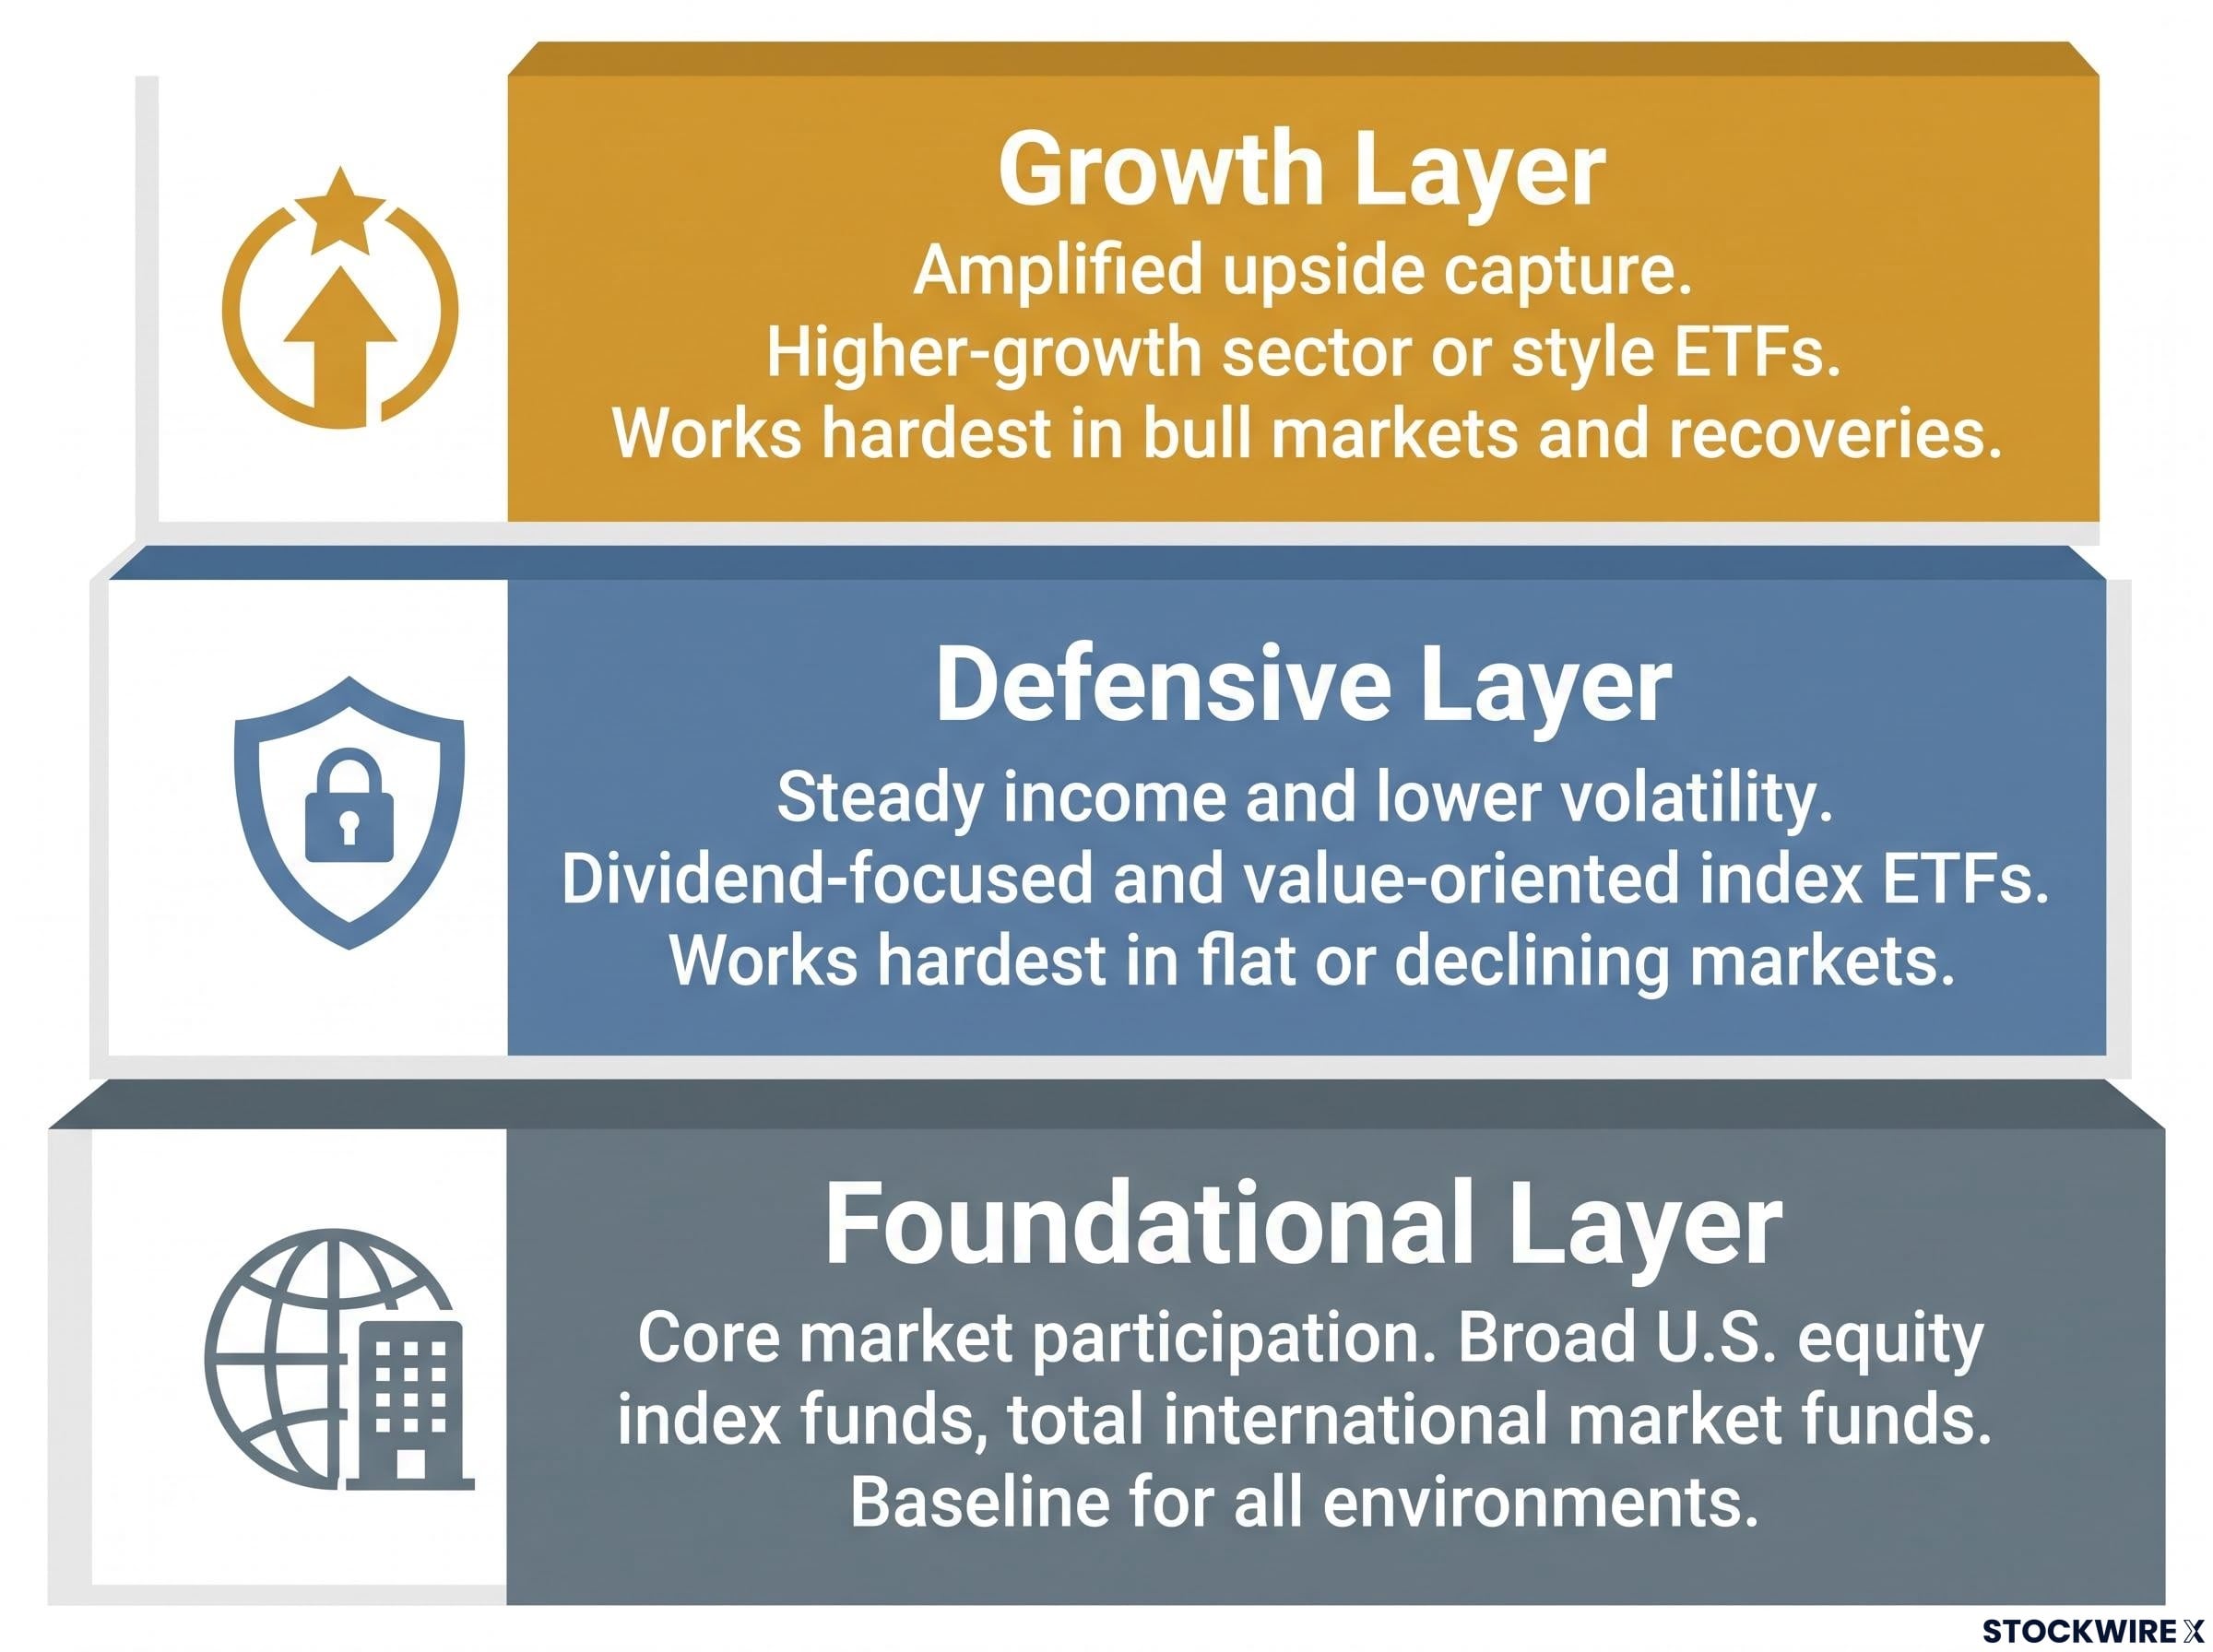
Understanding the principles is the first step. Translating them into an actual portfolio structure is where the preparation becomes real. A portfolio built to survive a lost decade has three distinct layers, each with a specific function.
| Layer | Function | Works Hardest During | Illustrative Examples |
|---|---|---|---|
| Foundational | Core market participation across broad equity exposure | All environments (baseline) | Broad U.S. equity index funds, total international market funds |
| Defensive | Steady income and lower volatility during weak markets | Flat or declining markets | Dividend-focused and value-oriented index ETFs |
| Growth | Amplified upside capture when conditions are favourable | Bull markets and recoveries | Higher-growth sector or style ETFs |
During the 1999-2010 period, broad index exposure alone weathered the decade poorly. It was the component that produced the near-zero return for Investor A. But it was also the baseline that captured the post-2010 recovery. You need it. You just cannot rely on it alone.
The defensive component, value-oriented and dividend-focused holdings, provided relative stability and income during the dot-com collapse when growth stocks were the primary casualties. During a flat decade, dividend income becomes your portfolio’s primary source of returns while you wait for price appreciation to resume.
The growth component was the source of the most severe damage for undiversified investors in 2000-2002. But it also became the primary driver of returns from 2010 onward. A portfolio without it would have captured less of the recovery. The point is not to avoid growth, but to size it appropriately within a layered structure.
Fixed income plays a role that depends entirely on your individual situation:
The 2022 collapse of the traditional 60/40 model demonstrated that portfolio structure across market regimes matters as much as asset allocation ratios, because the stock-bond correlation that provided ballast for four decades turned positive during an inflationary shock and removed the diversification buffer investors had relied on.
- If you are decades from retirement, a smaller fixed-income allocation may be appropriate given your long time horizon
- If you are within 10 years of retirement, a meaningful bond allocation can reduce portfolio volatility and provide the cash buffer discussed in the previous section
- If you are already retired, fixed income serves as the foundation of your sequence-of-returns protection
All ETF names above are illustrative examples only and are not personalised investment recommendations. Your allocation should reflect your individual risk profile, time horizon, and financial circumstances.
This article is for informational purposes only and should not be considered financial advice. Investors should conduct their own research and consult with financial professionals before making investment decisions.
The decade you invest through shapes every decade that follows
The lost decade was not primarily a test of patience. It was a test of behaviour. The investor who simply held on ended up with approximately $85,800 by mid-2026. The investor who held on and kept contributing, reinvesting, and maintaining a diversified structure ended up with approximately $735,000. The difference: $649,200, produced by a $66,000 gap in contributions spread across 132 months.
What you control is specific: your contribution rate, your dividend reinvestment, your diversification structure, your cash reserves, and your commitment to a researched plan. What you do not control, market returns and the timing of downturns, is everything else. The five strategies covered here are your full set of controllable levers.
The bull market did not choose between Investor A and Investor B. It simply multiplied whatever each had built through the difficult decade.
The next time markets feel threatening, the question worth sitting with is not whether to stay invested. It is whether your current setup is positioned to accumulate through weakness or merely to survive it. The difference between those two postures, as the 1999-2026 record makes clear, is not marginal. It is the difference that defines the outcome.
For investors approaching or already in retirement who want to apply the same compounding discipline covered here, our full explainer on dividend reinvestment in retirement covers the 10-15% reinvestment framework that protects income bases from dividend cuts, inflation erosion, and healthcare cost shocks.
Past performance does not guarantee future results. Financial projections are subject to market conditions and various risk factors.