Bank of Queensland trades at $6.25, below 0.8x book value, and within a broker-estimated fair value range of $7 to $10 per share. On paper, that looks like a discount worth investigating. In practice, the bank’s cash return on equity sits at 4.7%, less than half the major bank average, and its net interest margin trails the sector by a meaningful gap. The distance between apparent cheapness and genuine quality is exactly where retail investors get caught when evaluating regional bank stocks. This guide applies five analytical inputs to BOQ as a live case study: Return on Equity, Net Interest Margin, CET1 capital ratio, workplace culture data, and Dividend Discount Model valuation. Each metric is explained from first principles and then tested against BOQ’s most recent reported figures. The result is a repeatable framework for analysing any ASX-listed regional bank, built on the numbers that actually determine whether a dividend is sustainable, a balance sheet is sound, and a turnaround is real.
Why regional banks deserve their own analytical lens
Regional banks operate under fundamentally different economics to the majors. Applying CBA or NAB benchmarks directly to a stock like BOQ is the single most common mistake in ASX bank investing, and it produces consistently misleading conclusions.
Three structural features separate regionals from the big four:
- Smaller deposit franchises. Regionals lack the cheap, sticky transactional deposit bases that underpin major bank funding advantages, pushing their cost of funds higher.
- Narrower earnings diversification. Interest income from lending accounted for 93% of BOQ’s total revenue in its most recently completed financial year. The majors supplement lending income with wealth management, institutional banking, and markets revenue.
- Proportionally heavier regulatory cost burdens. APRA’s operational resilience and risk governance standards create fixed compliance costs that absorb a larger share of revenue at smaller scale.
These structural realities mean regional banks typically trade at persistent discounts to book value and carry lower profitability metrics than the majors. That is the normal baseline, not a distress signal.
What the owner-manager model means for investors
BOQ operates close to 200 branches under an owner-manager model, where branch operators run their locations as small business owners rather than salaried employees. This structure can strengthen local relationship lending and cost discipline, but it also introduces variable service consistency and limits the head office’s ability to centralise operational control. For investors, the model is a double-edged feature: it keeps fixed costs lower than a salaried network but makes system-wide transformation harder to execute uniformly.
Regional banks also typically hold CET1 ratios in the 10-11% range versus low-teens for the majors, a narrower capital buffer that reflects both regulatory calibration and the commercial reality of smaller balance sheets.
When big ASX news breaks, our subscribers know first
Return on Equity: the number that separates good banks from cheap ones
Return on Equity (ROE) measures how much net profit a bank generates for every dollar of shareholder equity on its balance sheet, expressed as a percentage. A higher figure means the bank is converting its capital base into earnings more efficiently.
BOQ reported a cash ROE of 4.7% for the half-year ended 28 February 2025. That means the bank generated $4.70 in annual profit for every $100 of shareholder equity held. Place that figure alongside the majors and the gap becomes concrete.
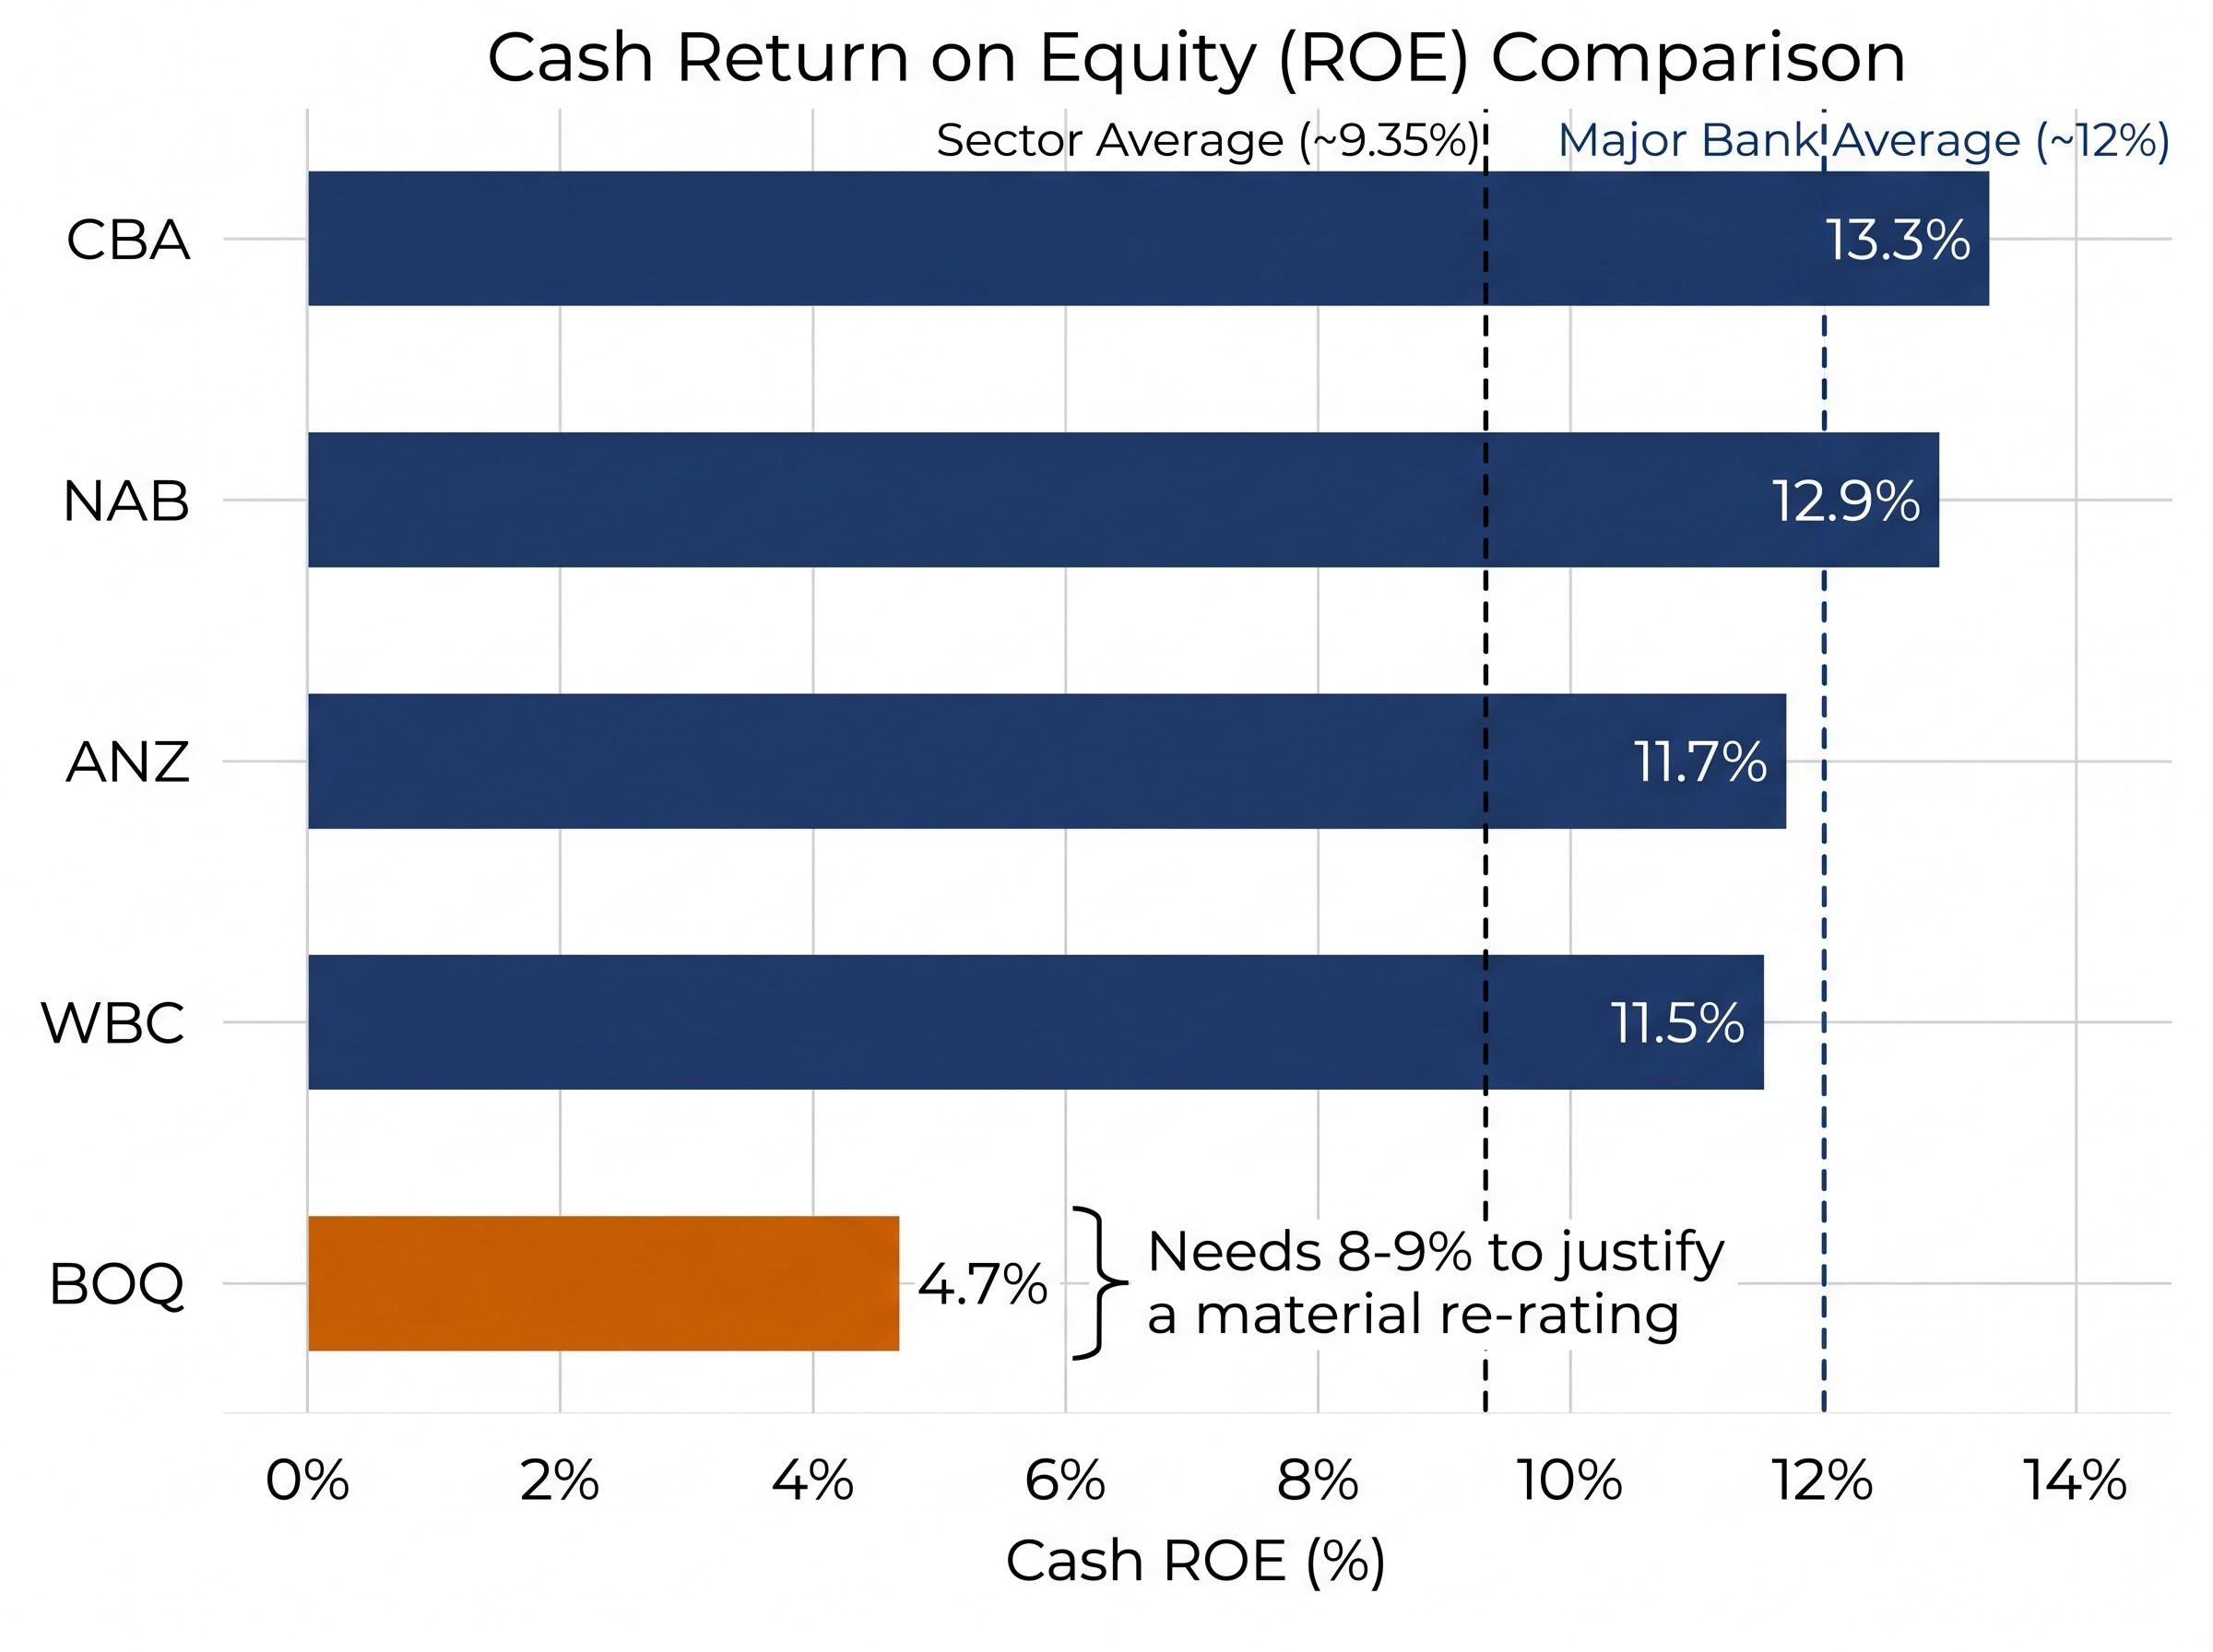
| Bank | Cash ROE | Reporting Period |
|---|---|---|
| BOQ | 4.7% | 1H FY25 (to 28 Feb 2025) |
| CBA | 13.3% | 1H FY25 (to 31 Dec 2024) |
| NAB | 12.9% | FY24 (to 30 Sept 2024) |
| WBC | 11.5% | FY24 (to 30 Sept 2024) |
| ANZ | 11.7% | FY24 (to 30 Sept 2024) |
The major bank average sits at approximately 12%. The broader sector average, including regionals, is closer to 9.35%. BOQ’s 4.7% is below both by a wide margin.
“BOQ needs ROE closer to 8-9 per cent to justify a material re-rating.”
That analyst threshold matters. A bank trading below book value with sub-5% ROE is not automatically a bargain. The market is pricing in the possibility that returns stay permanently low. ROE is the fastest single-number diagnostic for determining whether that discount is an opportunity or a warning.
Net Interest Margin: how to read a bank’s lending profitability
Net Interest Margin (NIM) captures the spread between what a bank pays for its funding (deposits and wholesale borrowing) and what it charges borrowers. A wider spread translates directly into higher profitability on the same loan book.
The concept works as a straightforward mental model: the bank borrows money at one rate, lends it at a higher rate, and keeps the difference. NIM measures the size of that difference as a percentage of average interest-earning assets.
BOQ’s NIM trajectory tells a specific story. The margin compressed from 1.69% in 1H FY24 to 1.56% in 1H FY25, then partially recovered to approximately 1.64% for the FY25 full year (year ended 31 August 2025). That recovery is a genuine early positive, but the gap to major bank levels remains substantial.
| Bank / Period | NIM | Notes |
|---|---|---|
| BOQ (1H FY25) | 1.56% | Half-year trough |
| BOQ (FY25 full year) | 1.64% | Partial recovery |
| CBA | 1.90% | 1H FY25 (ex-Markets & Treasury) |
| NAB | 1.72% | FY24 group NIM |
| WBC | 1.83% | FY24 (ex-notable items) |
| ANZ | 1.70% | FY24 group NIM |
The sector average sits at approximately 1.75-1.80%. BOQ’s full-year 1.64% trails that benchmark by 11-16 basis points.
Major bank NIM benchmarks provide the reference points that make BOQ’s gap legible: CBA’s FY25 NIM of 2.08% and cash ROE of 13.5% sit well above the sector averages of 1.78% and 9.35% respectively, illustrating how the structural funding and scale advantages of the Big Four translate into measurable profitability differences that regional banks must compete against.
Regional banks face a two-sided compression mechanism that explains why the gap persists:
- Mortgage pricing competition forces lending rates down, as regionals must discount aggressively to retain market share against majors with cheaper funding.
- Deposit and wholesale funding competition pushes the cost of funds up, as smaller banks lack the large transactional deposit bases that provide the majors with low-cost, stable funding.
- The combined effect squeezes the spread from both sides simultaneously, compressing NIM faster than for banks with more diversified revenue streams.
The RBA cash rate, raised to 4.60% on 5 May 2026, adds a further layer of complexity. Higher absolute rates support NIM on transactional deposits but intensify term deposit competition for regionals. For BOQ, NIM recovery is the single most important operational metric to track at each reporting date, because it is the primary lever that would lift ROE toward the re-rating threshold.
CET1 and culture: the two metrics most investors overlook
Common Equity Tier 1 (CET1) is the proportion of a bank’s risk-weighted assets covered by the highest-quality capital, essentially ordinary shares and retained earnings. It functions as the primary solvency buffer under APRA’s regulatory framework, measuring how much loss a bank can absorb before it runs into trouble.
BOQ reported a CET1 ratio of 10.7% on an APRA basis as at 28 February 2025, with a total capital ratio of 15.1%. APRA’s “unquestionably strong” benchmark for major banks (using the advanced measurement approach) sits at approximately 10.5%, and the majors themselves hold ratios in the low teens at approximately 12%.
- BOQ CET1: 10.7% (APRA basis, 1H FY25)
- APRA “unquestionably strong” benchmark: approximately 10.5% (advanced-approach major banks)
- Major bank actual CET1: approximately 12% (low-teens range)
- Regional bank typical range: 10-11%
BOQ meets the regulatory requirement and sits within the regional peer range, but carries a narrower buffer than the majors. APRA confirmed in June 2025 that the banking system remains well capitalised across all authorised deposit-taking institution (ADI) categories. For investors, CET1 answers a direct question: can this bank absorb losses without needing to raise capital from shareholders and dilute existing holdings?
APRA’s capital adequacy standards, effective from January 2025 under Prudential Standard APS 110, define the regulatory minimum thresholds that all authorised deposit-taking institutions must meet, including the framework underpinning the “unquestionably strong” benchmark that shapes how investors interpret CET1 ratios across the sector.
Reading workplace culture scores as an investor
Workplace culture may seem disconnected from financial analysis, but it functions as a leading indicator of whether a management team is building sustainable organisational capability or burning through talent during a transformation period.
BOQ workplace culture score: 2.6 out of 5 (Seek employment platform data) versus a banking sector average of 3.1 out of 5.
Investors can locate these scores on employment review platforms such as Seek. As a general guide, scores below 3.0 indicate weak employee sentiment for the sector, while scores of 3.5 and above signal relatively strong internal cohesion. Culture deterioration during transformation periods is a known risk factor for turnaround stocks, as high staff turnover and low morale can delay or undermine strategic execution.
Together, CET1 and culture answer the question that yield alone cannot: is this bank operationally sound, or just cheap on paper? BOQ’s capital is adequate; its culture score suggests the turnaround’s human infrastructure remains under strain.
Valuing a bank stock using the Dividend Discount Model
The Dividend Discount Model (DDM) is the most widely used valuation framework for mature ASX bank stocks because dividends represent a large and predictable share of total return. The formula is straightforward:
The dividend discount model mechanics that apply to ASX banks rest on a straightforward logic: stable, regulated businesses with mandated payout structures produce predictable dividend streams that can be discounted back to a present value, and franking credits create meaningfully different after-tax outcomes depending on whether the investor is an SMSF in pension phase, an individual taxpayer, or a foreign holder.
Share price = Annual dividend / (Risk rate minus Dividend growth rate)
Applying it to BOQ requires four steps:
- Identify the annual dividend. BOQ paid a total dividend of $0.34 per share (fully franked) for FY25. The forecast dividend is $0.35 per share.
- Choose a risk rate and growth rate. Broker assumptions use a cost of equity of approximately 10% and long-run dividend growth of 2-3%. A broader range of 6-11% for the risk rate and 2-4% for growth produces a wider scenario set.
- Apply the formula. Using the historical dividend and average assumptions, the DDM produces an estimated value of approximately $7.19. Using the forecast dividend, the estimate rises to approximately $7.40.
- Gross up for franking credits if applicable. For Australian investors who can fully utilise franking credits (particularly SMSF trustees in pension phase), a fully franked cash dividend is grossed up by dividing by (1 minus 0.30), multiplying the economic value by a factor of approximately 1.4286.
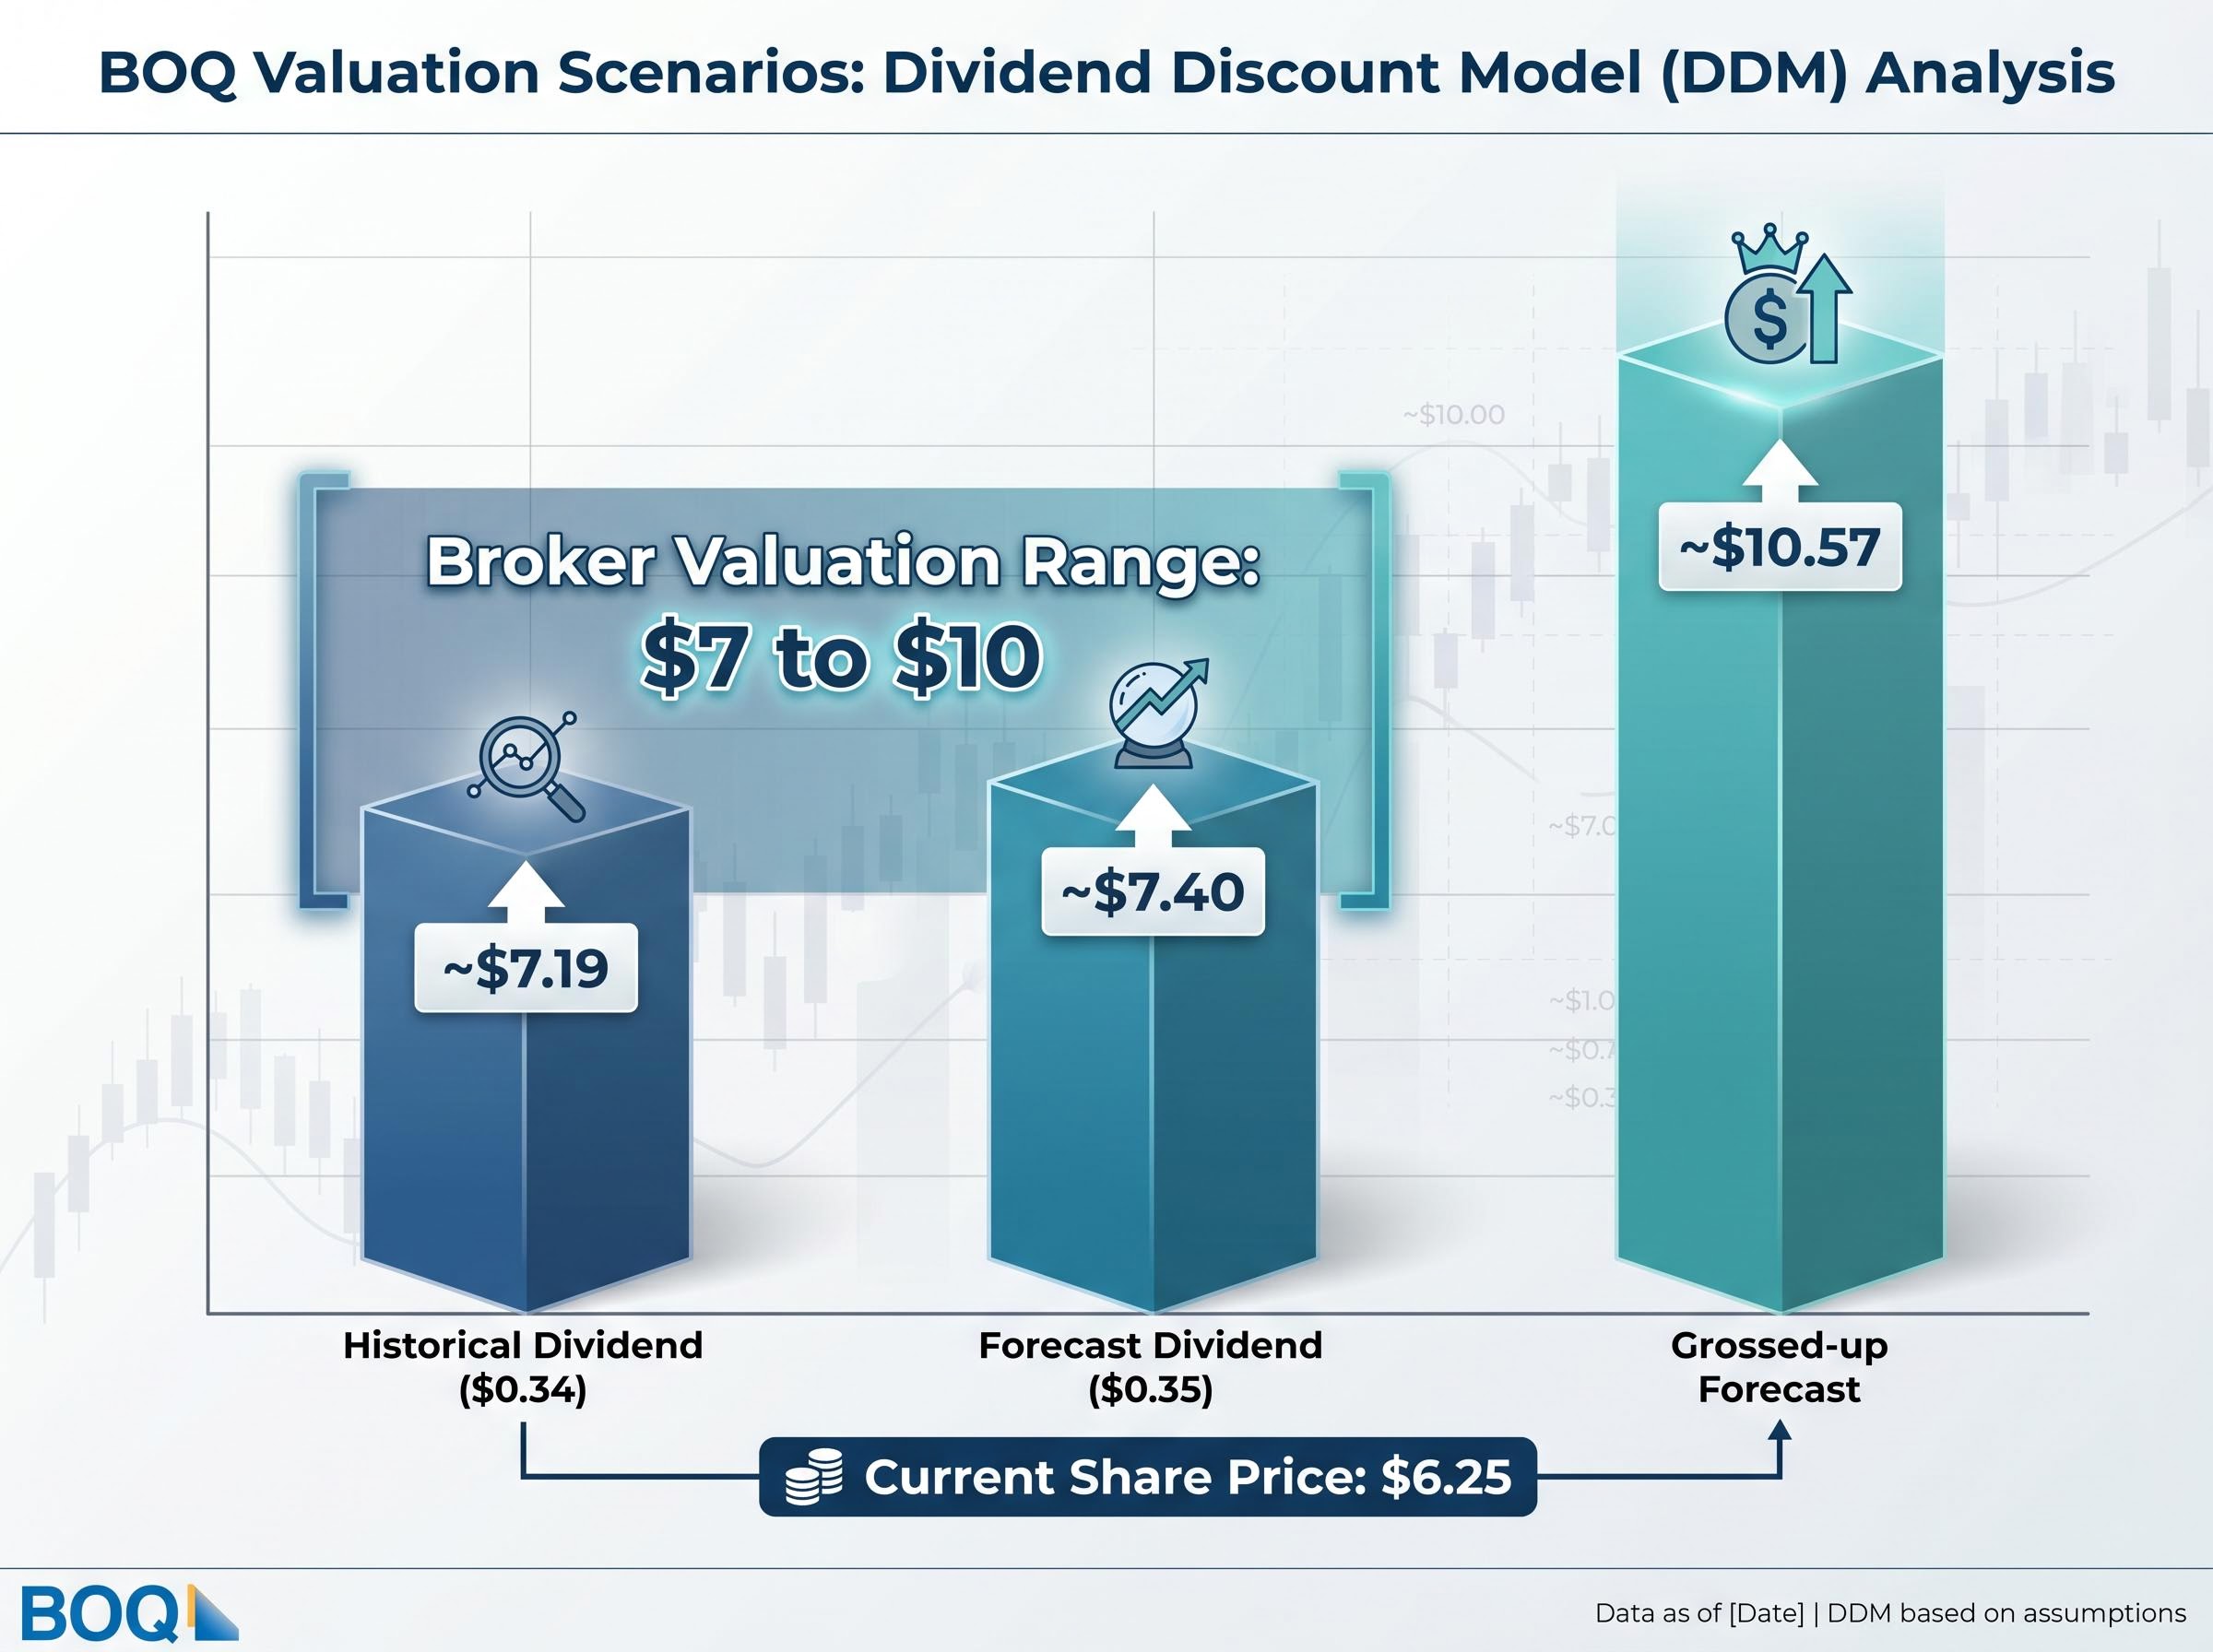
| Input Type | Estimated Value | Key Assumption Notes |
|---|---|---|
| Historical dividend ($0.34) | ~$7.19 | Average risk/growth assumptions |
| Forecast dividend ($0.35) | ~$7.40 | Average risk/growth assumptions |
| Grossed-up forecast dividend | ~$10.57 | Franking credit adjusted; only for eligible investors |
A broker note summarised in The Australian on 3 March 2026 presented a DDM valuation range of $7-$10 per share for BOQ, acknowledging moderate upside from the current $6.25 price while stressing that execution risk on the turnaround remains high.
“Incorporating the gross dividend value lifted the estimated fair value to approximately $10.57 per share.” This figure is only relevant to investors who can fully utilise franking credits, and consistency between the dividend input and discount rate is necessary to avoid double-counting the credit.
A note on DDM limitations for turnaround stocks
DDM works best for stable dividend payers with predictable payout capacity. For turnaround stocks such as BOQ, where future payout capacity depends on operational improvement that has not yet been fully delivered, forecast dividends carry more execution risk than historical averages imply. The DDM output should be treated as a scenario range rather than a point estimate, and used as one input alongside the profitability and capital metrics covered earlier in this guide.
Putting the framework together: what BOQ’s numbers actually tell you
Five metrics. One composite picture. The table below consolidates what the analysis has established.
| Metric | BOQ Figure | Sector Benchmark | Status |
|---|---|---|---|
| Cash ROE | 4.7% | ~9.35-12% | Below benchmark |
| NIM (FY25) | 1.64% | ~1.75-1.80% | Recovering |
| CET1 (APRA basis) | 10.7% | ~12% (majors) | Adequate |
| Culture score | 2.6 / 5 | 3.1 / 5 (sector avg) | Below benchmark |
| DDM valuation range | $7-$10 | Current price ~$6.25 | Theoretical upside |
BOQ trades below book value (under 0.8x) and below the DDM midpoint. The discount is real. But sub-benchmark ROE, compressed NIM, a below-average culture score, and unresolved execution risk on the turnaround mean the discount is not obviously mispriced. Market commentary characterises the stock as “cheap for a reason” and “a turnaround story that still has a lot to prove.”
The investment thesis would strengthen under three specific conditions:
- NIM recovering toward 1.75%, closing the gap to sector parity and demonstrating pricing power in the mortgage book.
- ROE approaching the 8-9% re-rating threshold, signalling that the bank’s capital is generating acceptable returns.
- Culture scores trending upward, indicating that the organisation’s internal cohesion is improving alongside its financial metrics.
The transferable principle is this: the five-metric framework (ROE, NIM, CET1, culture score, DDM valuation) is applicable to any ASX-listed regional bank. Each metric should be assessed against a relevant benchmark, whether a sector average, an APRA minimum, or an analyst threshold, rather than in isolation.
Balance sheet metrics for bank valuation, including non-performing loan ratios, deposit funding composition, and price-to-book multiples, extend the five-metric framework used in this guide into credit quality territory; system-wide NPLs sitting at approximately 1.1-1.2% by early 2026 represent a return to mid-cycle norms rather than the early stage of a deterioration cycle, a context that affects how conservatively to weight BOQ’s sub-benchmark ROE.
The case for patience, and when patience runs out
BOQ’s FY25 NIM recovery to 1.64% is a genuine early-stage positive data point. It represents a measurable improvement from the 1.56% trough recorded in 1H FY25. It is also still 11-16 basis points below sector parity, and the ROE remains less than half the re-rating threshold.
“BOQ is a turnaround story that still has a lot to prove.”
The practical next step for investors using this framework is a monitoring routine tied to BOQ’s reporting cadence:
- At each half-year (April) and full-year (October) result, check the reported NIM and ROE against the benchmarks established in this guide: NIM above 1.70% trending toward 1.75%, ROE approaching 8-9%.
- Update the DDM with the declared dividend, applying the same risk rate and growth rate assumptions to generate a refreshed valuation range.
- Check the most recent culture score data on Seek or equivalent platforms to assess whether internal sentiment is improving alongside financial metrics.
The discount becomes compelling when the operating metrics confirm that the gap is closing. It remains deserved for as long as ROE stays sub-5%, NIM trails sector benchmarks by double digits, and culture data suggests the transformation is straining the people executing it. The framework does not tell investors what to decide. It tells them what to watch, and when the evidence has shifted enough to warrant a different conclusion.
The regional bank versus ETF decision applies the same monitoring discipline this guide describes: the BEN versus VAS analysis found that a valuation discount does not justify entry without a structured four-step check covering time horizon, NIM conviction, monitoring capacity, and regulatory risk tolerance, a framework that maps directly onto the conditions under which BOQ’s discount would become a genuine opportunity rather than a value trap.
This article is for informational purposes only and should not be considered financial advice. Investors should conduct their own research and consult with financial professionals before making investment decisions. Past performance does not guarantee future results. Financial projections are subject to market conditions and various risk factors.