AMD Stock at 148x Earnings: Is the AI Thesis Worth the Price?
20 mins ago

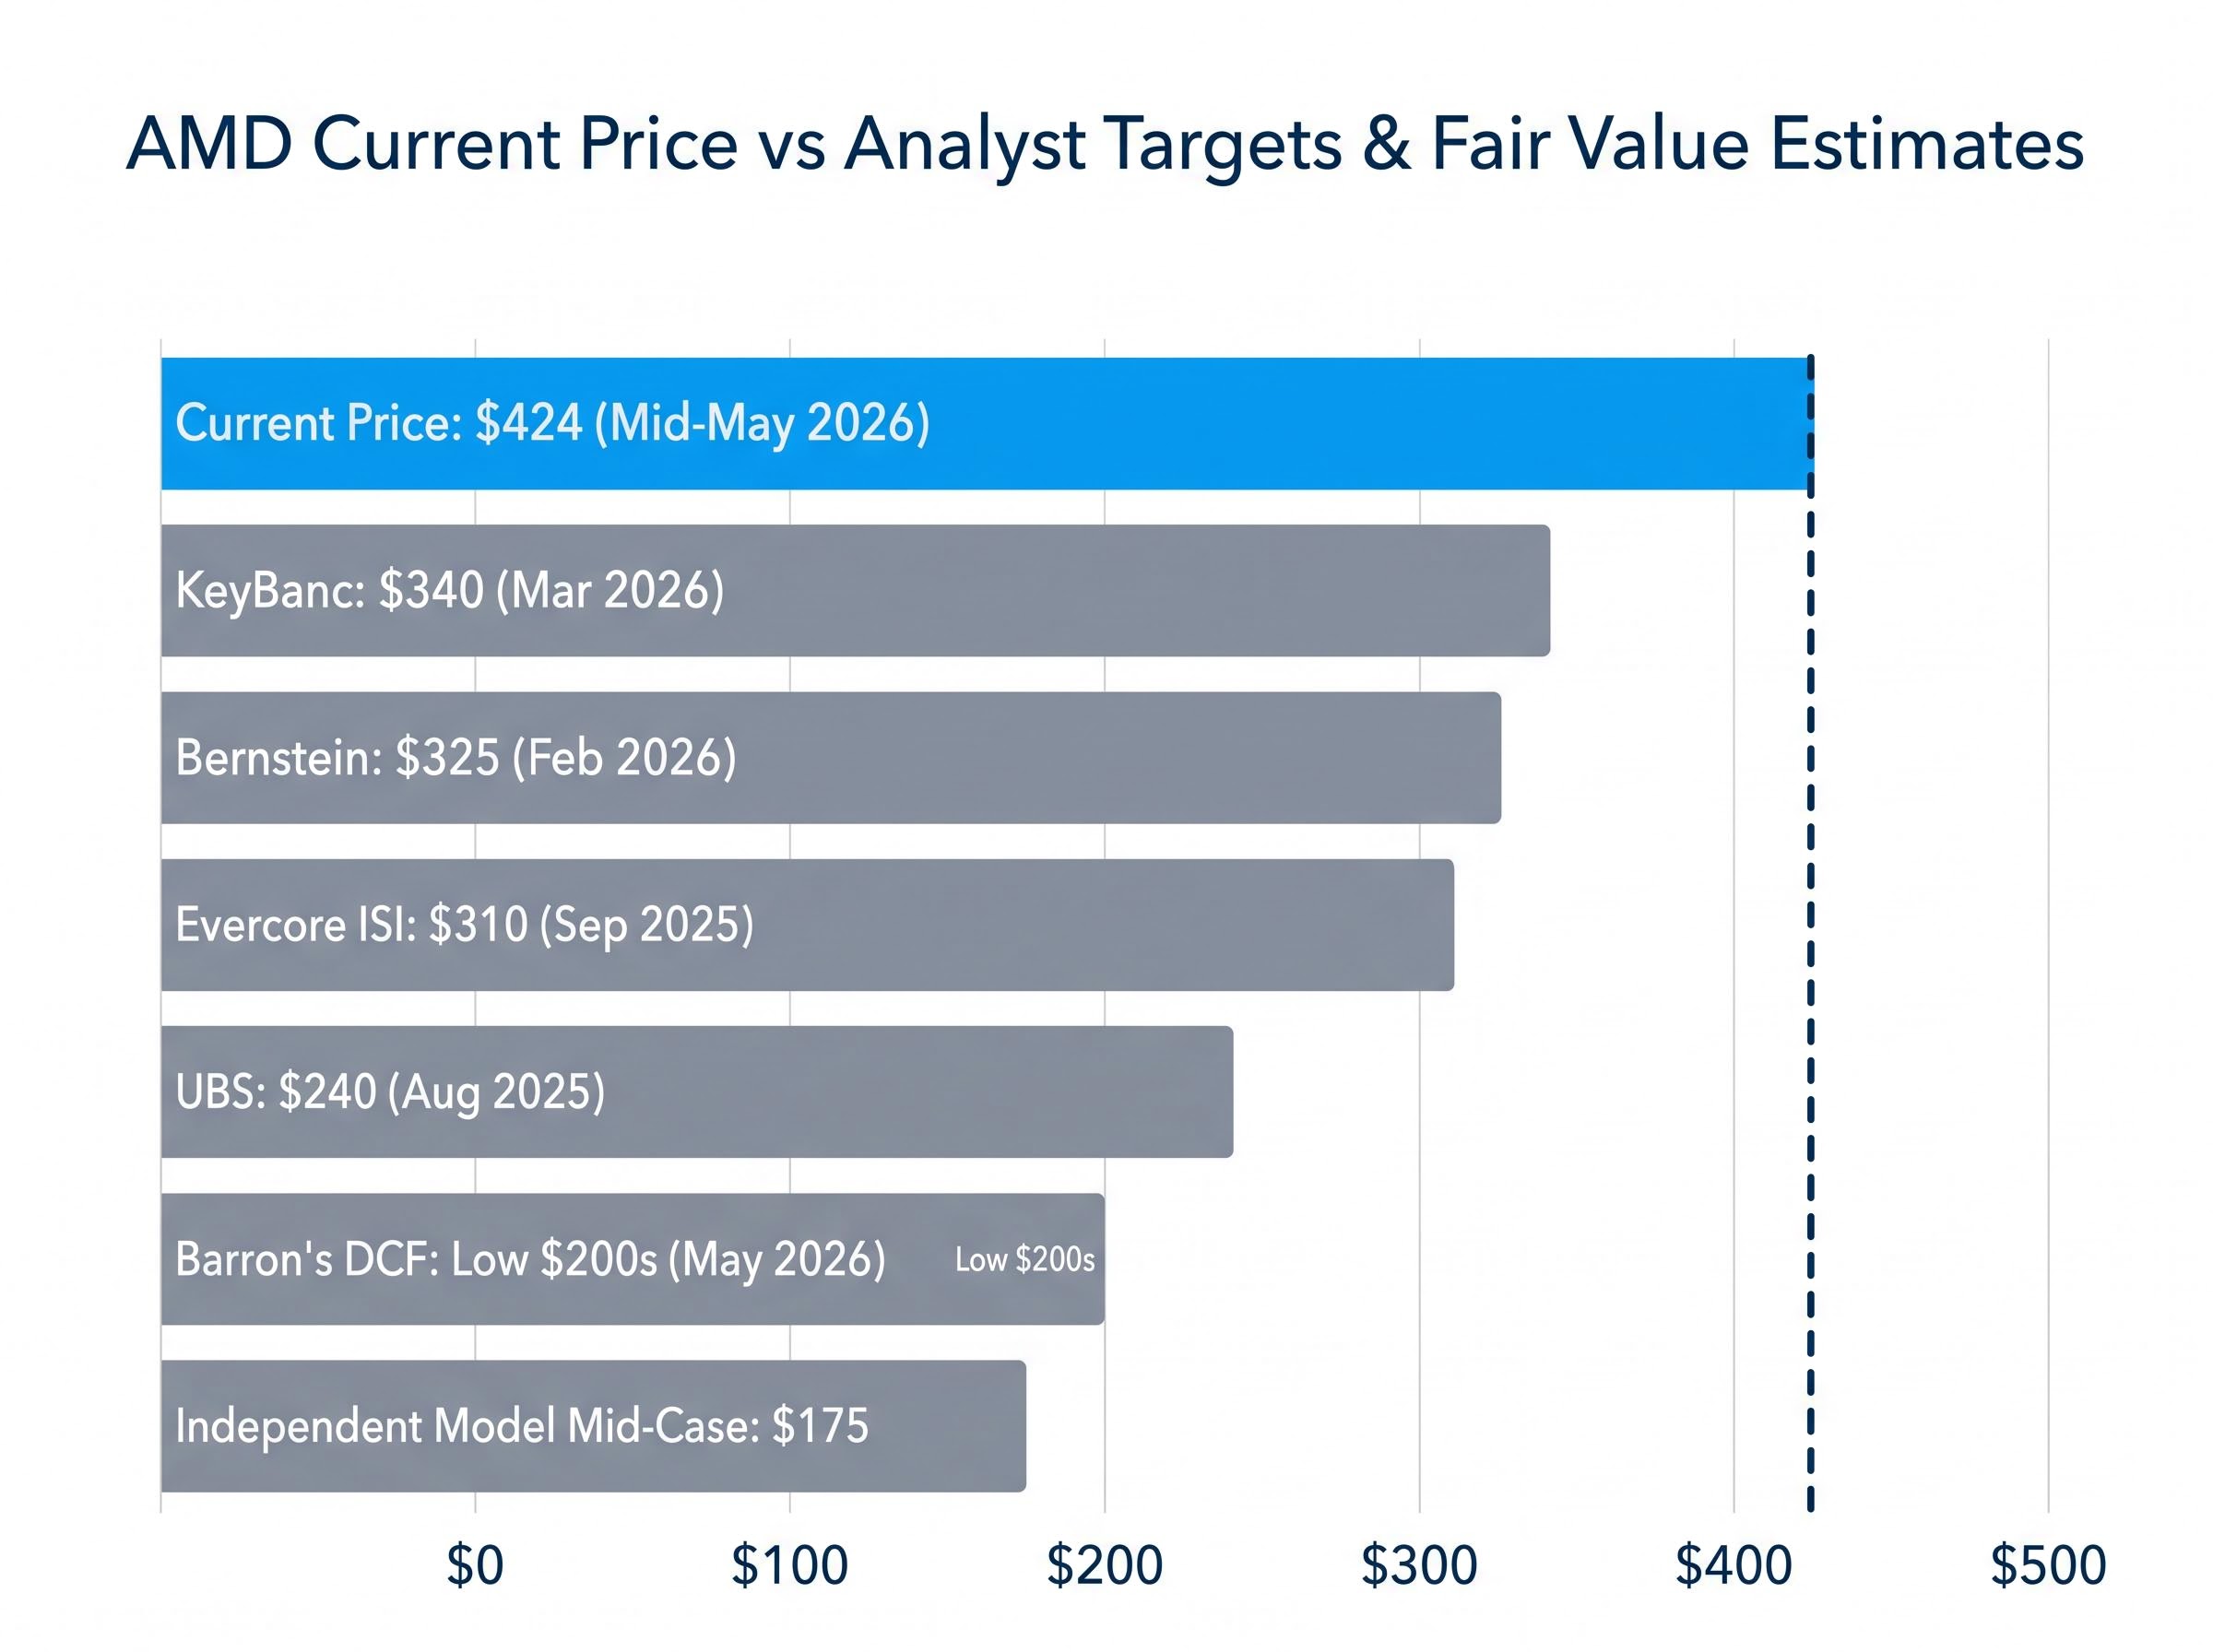
Advanced Micro Devices trades near $424 as of mid-May 2026, a price that sits above every published analyst target from the past 12 months. That single observation frames the AMD stock analysis that follows. The company’s fundamentals are genuinely strong: data centre segment revenue reached $5.775 billion in Q1 2026, up 57% year-over-year, and the stock has surged roughly 116% in three months from near $188 to a peak of $469. Yet a strong business and a strong investment are not the same thing at every price. Three structural risks, Nvidia’s CUDA software moat, geopolitical concentration in Taiwan and China, and what independent valuation models actually say about fair value, suggest the market may be pricing perfection rather than probability. What follows is a framework for evaluating whether $424 compensates for those risks.
The most recent published analyst targets tell a straightforward story. KeyBanc set $340 in March 2026. Bernstein set $325 in February 2026. Both are bullish ratings. Both sit 20-25% below where the stock actually trades.
| Firm | Date | Action | Price Target | Rating |
|---|---|---|---|---|
| KeyBanc | 11 Mar 2026 | Raised target | $340 | Overweight |
| Bernstein | 14 Feb 2026 | Raised target | $325 | Outperform |
| Wolfe Research | 9 Jan 2026 | Downgraded | Removed | Peer Perform |
| UBS | 18 Aug 2025 | Downgraded | $240 | Neutral |
| Evercore ISI | 3 Sep 2025 | Raised target | $310 | Outperform |
At a confirmed closing price of $424.10 on 15 May 2026, AMD carries a market capitalisation of approximately $686.5 billion, a forward P/E of roughly 48-65x (depending on the estimate feed used against FactSet consensus FY2026 EPS of $8.30), and trades at approximately 86x free cash flow and 148x trailing earnings.
Wolfe Research downgraded AMD to Peer Perform in January 2026, citing “unattractive risk/reward after the rally.”
UBS had already downgraded in August 2025, pointing to valuation stretch. The stock has climbed further since both calls. For the current multiple to be justified, AMD’s earnings growth must materialise at a pace and duration that compress those ratios sharply over the next several years. That is not a bear case argument. It is arithmetic.
Investors wanting the full breakdown of the quarter that drove AMD’s recent re-rating will find our dedicated guide to AMD’s Q1 2026 results covers the segment-level revenue detail, Instinct MI350 GPU trajectory, and the competing analyst frameworks from Goldman Sachs and Bernstein that now bracket the $450-$525 bull case range.
Multiple independent valuation approaches, built on different methodologies and starting assumptions, converge around a fair value well below $424. The consistency of that convergence is what gives the bear case its quantitative spine.
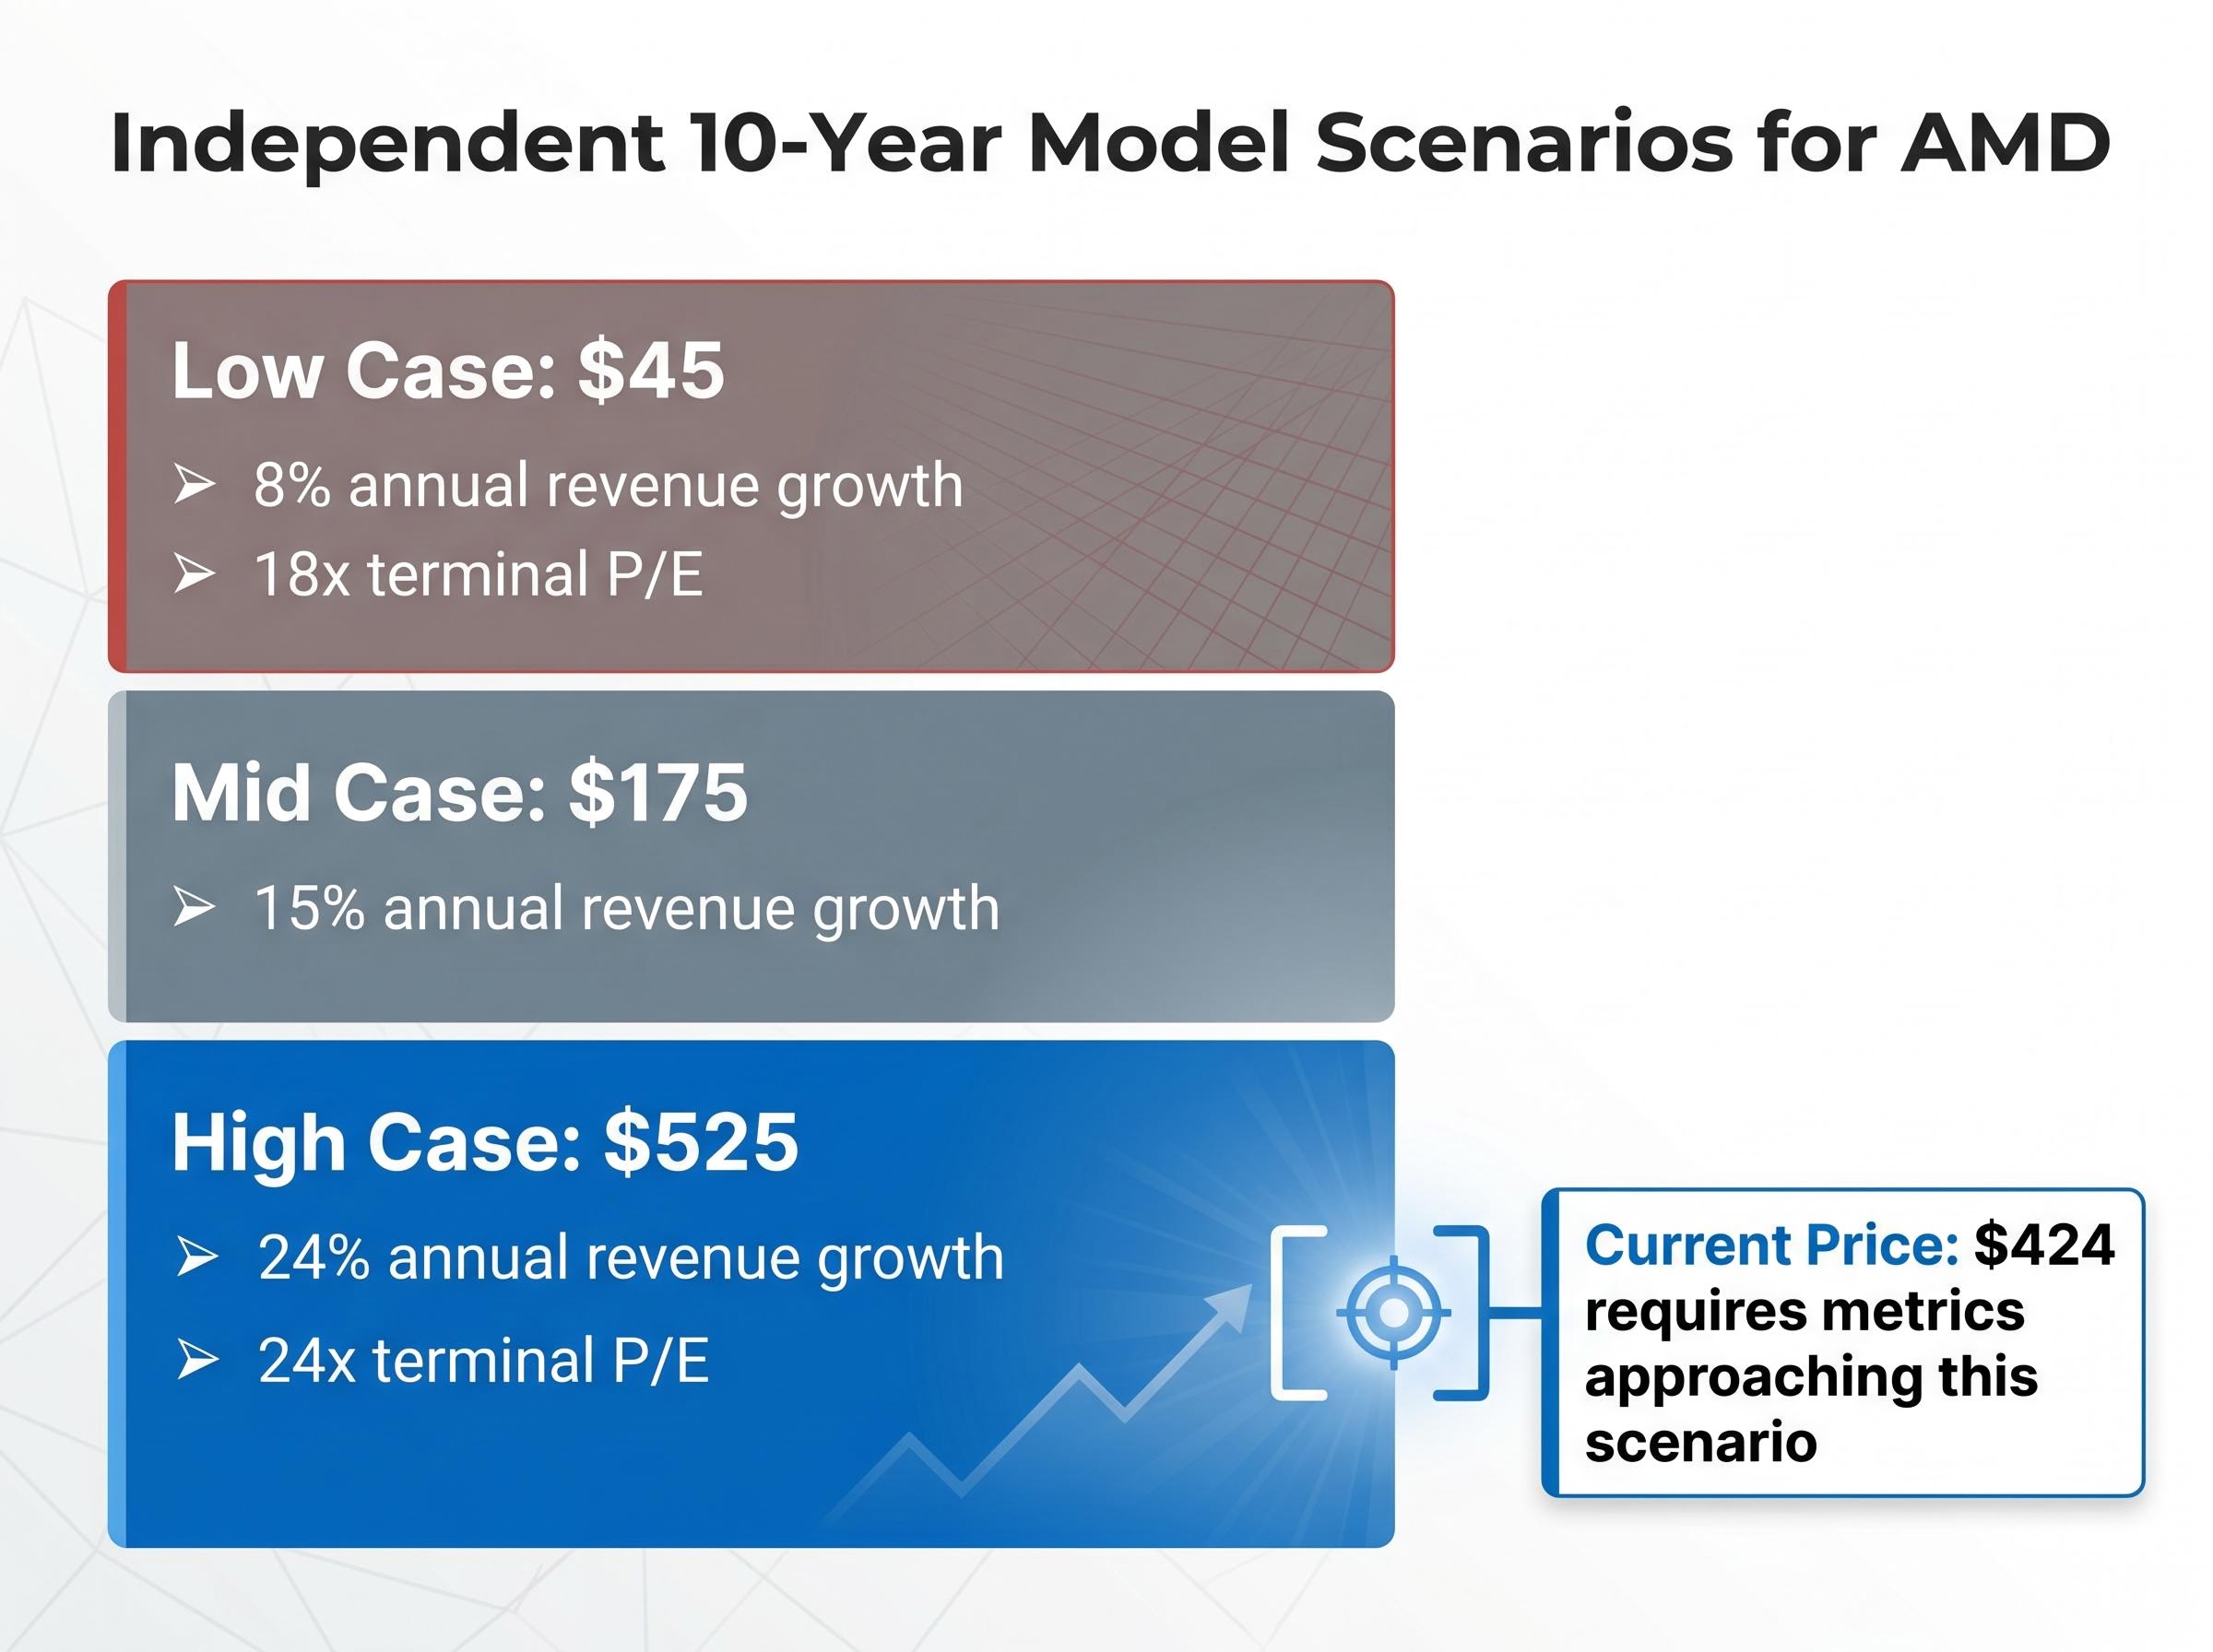
Four scenarios illustrate the range:
Even the most optimistic analyst downside scenarios produce implied values in the low $200s. That is not the bear case talking. That is the bull case’s own stress test.
AMD’s five-year return on invested capital sits at approximately 8.5%, with the one-year figure at roughly 3%. For a business commanding a premium multiple, those capital efficiency numbers are unusually low.
The three-scenario output illustrates the assumptions required at each level. The low case ($45) assumes revenue growth of approximately 8% annually with a terminal P/E of 18x. The mid case ($175) assumes roughly 15% annual growth. The high case ($525), the only scenario that supports a price near current levels, requires sustained revenue growth of approximately 24% annually with a terminal P/E of 24x across a full decade.
Analyst consensus projects EPS growing from approximately $6.69 to roughly $24 over four years. Applying a 25x P/E to that $24 figure yields approximately $600, representing only 25-30% total upside from current levels, with significant execution risk embedded across every year of that trajectory. Share dilution, already flagged by the model’s low ROIC readings, would compress per-share returns further.
AMD’s MI300 series accelerators are competitive on silicon specifications. On paper, they offer comparable or better performance-per-dollar in several workload categories. The bear case does not rest on hardware inferiority. It rests on what happens after the chip is purchased.
CUDA is Nvidia’s proprietary software platform for programming GPUs. It provides the libraries, tools, and documentation that AI engineers use to build and deploy models. After more than a decade of development, CUDA has become the default environment for production AI workloads. ROCm is AMD’s equivalent platform, designed to serve the same function for AMD hardware.
According to SemiAnalysis (February 2024), ROCm still lags CUDA in mixed-precision training, inference optimisations, and certain operations. CUDA’s decade-plus head start was characterised as a “massive switching cost” for enterprises with large existing codebases. The distinction between new and established buyers is where the moat becomes visible:
Industry benchmarking of CUDA and ROCm ecosystem trade-offs shows that while AMD’s MI300X closes the silicon gap with Nvidia’s B200 in several workload categories, the developer tooling maturity and library coverage gap continues to impose real migration costs on enterprises with established GPU pipelines.
Enterprise CIOs reported that existing CUDA shops viewed migration to ROCm as “high friction” due to the cost of retraining staff and rewriting pipelines, according to The Register (April 2024).
Meta’s PyTorch Engineering Blog (May 2024) explicitly acknowledged that some ROCm features are “rolling out gradually” and that performance parity with CUDA remains an ongoing, multi-year effort. The absence of ROCm as a notable category in developer tooling surveys reinforces that CUDA remains the de facto standard.
If AMD’s GPU revenue growth depends on converting established CUDA users, not just capturing greenfield projects, the pace of that conversion becomes the rate-limiting factor for the bull case.
AMD’s 10-K filings establish the baseline. Revenue from China (including Hong Kong) represented approximately 24% of total net revenue in FY2023, declining to approximately 22% in FY2024. The direction is already downward, and the regulatory trajectory suggests further compression.
The export control timeline shows successive tightening:
On AMD’s Q3 2024 earnings call, CEO Lisa Su acknowledged that updated US export rules would “modestly impact” data centre GPU revenue from China. No precise revenue loss figure was quantified, and no confirmed mitigation path has been publicly disclosed.
US AI chip export controls are grounded in national-security law with bipartisan Congressional backing, placing them structurally outside the jurisdiction of trade negotiators; any near-term diplomatic optimism from summit-level meetings does not alter the regulatory ceiling that AMD’s BIS filings already reflect.
AMD’s most advanced chips are manufactured exclusively by Taiwan Semiconductor Manufacturing Company (TSMC) in Taiwan. As a fabless chipmaker, AMD owns no fabrication facilities and has no alternative manufacturing source for leading-edge nodes. A geopolitical event affecting Taiwan would simultaneously disrupt AMD’s supply chain and its largest potential growth market. This is an industry-wide exposure, but AMD’s fabless model means it lacks the manufacturing optionality that an integrated producer could, at least theoretically, fall back on.
The four largest AI infrastructure buyers are all signalling the same shift. The pattern emerges not from any single earnings call but from the consistency across all of them:
Mark Zuckerberg stated Meta was “mindful of a period of digestion” after the surge in 2024-early 2025 AI infrastructure build-out, with capex beyond 2025 contingent on realised AI monetisation.
The absolute dollar figures remain large. What is decelerating is the growth rate, and for AMD, that distinction matters. As the newer entrant attempting to grow market share against an entrenched incumbent, AMD needs the total spending pie to expand fast enough to accommodate a second major GPU supplier. A slower expansion compresses that window.
The AI infrastructure spending cycle is approaching a critical inflection point, with Nvidia’s Q1 FY2027 results expected the week of 19 May 2026 carrying consensus estimates of $78.5 billion in revenue; management commentary on Blackwell supply normalisation and forward demand visibility will provide the most direct near-term read on whether hyperscaler capex commitments are translating into sustained semiconductor orders.
D.A. Davidson has estimated that if AI demand peaks, downside risk in semiconductor stocks could range from 40-50%. The Cisco dot-com parallel, cited in multiple bear case analyses, offers a historical precedent: a dominant infrastructure supplier whose stock remained flat for over two decades after a peak-cycle valuation.
Each of the three bear case pillars operates independently, but they compound when considered together.
| Risk Factor | Specific Quantifiable Impact | Bear Case Fair Value Implication |
|---|---|---|
| CUDA software moat | Switching costs slow enterprise GPU adoption even where AMD silicon is competitive | GPU share gains slower and more costly than bull cases assume |
| China/geopolitical exposure | ~22-24% of revenue at risk from further export tightening; no confirmed mitigation | Structural revenue ceiling already operational |
| Hyperscaler capex digestion | All four major buyers guiding to slower capex growth through 2026 | Limits runway for AMD to close GPU market share gap |
The bull case is real and quantifiable. Bank of America projects the server CPU market exceeding $120 billion by 2030 with AMD capturing approximately half. Lisa Su has articulated a path to above $20 EPS. Q1 2026 data centre revenue of $5.775 billion at 57% year-over-year growth demonstrates genuine business momentum:
The valuation convergence, however, is difficult to dismiss. Evercore’s bear case lands near $200. Barron’s independent DCF points to the low $200s. The independent 10-year model’s mid case produces approximately $175. A forward P/E of 48-65x compresses rapidly if any of these three risks materialises at even moderate severity.
This article is for informational purposes only and should not be considered financial advice. Investors should conduct their own research and consult with financial professionals before making investment decisions.
Past performance does not guarantee future results. Financial projections are subject to market conditions and various risk factors. Forward-looking statements regarding AMD’s earnings trajectory, market share, and revenue growth are speculative and subject to change based on market developments and company performance.
AMD may prove to be the right long-term strategic position on AI infrastructure diversification. The underlying business momentum is undeniable, and Q1 2026’s $5.775 billion in data centre revenue at 57% growth confirms that the company is executing against its product roadmap.
The question is not whether AMD is a good company. It is whether $424 adequately compensates for the probability-weighted downside across three independent risk pillars. The stock trades above every published analyst target, including those from firms that rate it a buy. Independent DCF models converge around a mid-case fair value near $175, roughly half the current price. Share dilution, if continued, compresses per-share returns further.
The semiconductor valuation debate is not one-sided: Bank of America analyst Savita Subramanian published a note on 18 May 2026 arguing that active long-only overweight in semiconductors sits at approximately 20%, half the 2017 cycle peak, and that over 20% earnings revisions combined with record free cash flow yields distinguish the current cycle from speculative bubble conditions, a counterpoint that investors applying AMD’s bear case framework should weigh alongside the DCF convergence data.
The variables to monitor are specific: China regulatory developments from BIS, enterprise adoption data for ROCm relative to CUDA, hyperscaler capex guidance in upcoming earnings cycles, and AMD’s own quarterly results as the bridge between management’s EPS ambitions and what the market is already pricing. At $424, the market has answered the question of whether AMD can win. The bear case asks whether the price has already collected the winnings in advance.
A discounted cash flow (DCF) model estimates a stock's fair value by projecting future cash flows and discounting them back to present value. Multiple independent DCF models applied to AMD converge around a mid-case fair value near $175, well below the current trading price of $424.
AMD has surged roughly 116% in three months, pushing its price to $424 and above every published analyst target, including KeyBanc's $340 and Bernstein's $325, as markets price in an optimistic scenario of sustained high revenue growth across the AI infrastructure cycle.
CUDA is Nvidia's proprietary GPU software platform with over a decade of development, giving it deep library coverage and engineer familiarity that creates high switching costs for enterprises. AMD's rival platform ROCm still lags in certain optimisations, meaning established CUDA users face significant migration friction before adopting AMD hardware.
China and Hong Kong represented approximately 22-24% of AMD's total net revenue in FY2023-2024, and successive rounds of US Bureau of Industry and Security export control tightening have directly restricted AMD's most advanced AI accelerators from that market, with no confirmed mitigation path publicly disclosed.
According to an independent 10-year valuation model, sustaining a price near $424-$525 requires approximately 24% annual revenue growth with a terminal P/E of 24x across a full decade, while the mid-case scenario of around 15% annual growth supports a fair value of only approximately $175.