Iran Walks Out of Swiss Talks, Sending US Stock Futures Lower
1 hr ago

In 1938, a Harvard doctoral student named John Burr Williams proposed a radical idea: that a stock’s true value is nothing more than the sum of all the dividends it will ever pay, discounted back to today. Nearly nine decades later, that idea still forms the foundation of one of the most practically useful valuation tools available to long-term investors. The dividend discount model occupies an unusual position in finance education: widely taught, frequently criticised, and often misunderstood. In the Australian context, where a large share of equity market returns flows through dividend-paying banks, REITs, utilities, and infrastructure companies, the model’s relevance is structural rather than incidental. What follows explains how the model actually works in practice, addresses the most common criticisms with appropriate nuance, and makes the case for why dividends matter to long-term investors well before any share is ever sold.
John Burr Williams was not an academic theorist working in isolation. He was a market practitioner who had watched the speculative mania of the 1920s destroy capital and erode trust in equity markets. He returned to Harvard to study what had gone wrong, and his doctoral thesis, The Theory of Investment Value, published in 1938, offered a direct intellectual response: the problem was speculative price-chasing, and the corrective was anchoring value in tangible, recurring dividend income.
Williams drew a sharp distinction between investors and speculators. Investors, in his framing, were buyers motivated by dividend income. Speculators were those primarily chasing price gains. His central argument was that a stock should be valued not by what someone else might pay for it tomorrow, but by the stream of cash it would return to its owner over time.
Williams compared stocks to productive assets: dairy cattle valued for their milk, fruit orchards for their harvests. The worth of an asset, he argued, derived from what it consistently yielded to its owner.
Benjamin Graham was among the first to review Williams’ published thesis and specifically praised its focus on dividends as a direct antidote to Wall Street speculation. Graham’s own The Intelligent Investor followed approximately 11 years later, building on many of the same principles. Understanding this origin reframes the DDM from a textbook formula into a principled philosophical stance, one where the dividend focus is a feature rather than a limitation.
The CFA Institute analysis of Williams’ investment value framework identifies the dividend-as-intrinsic-value principle as one of the most durable contributions to investment theory, reinforcing why the DDM is treated as a philosophically grounded tool rather than merely a computational convenience.
The DDM produces an intrinsic value estimate for a stock by summing the present value of all expected future dividends. The discount rate used is the cost of equity, not the weighted average cost of capital (WACC). This distinction matters: because the model discounts cash flows that belong exclusively to equity holders, it produces intrinsic equity value directly, without needing to subtract debt.
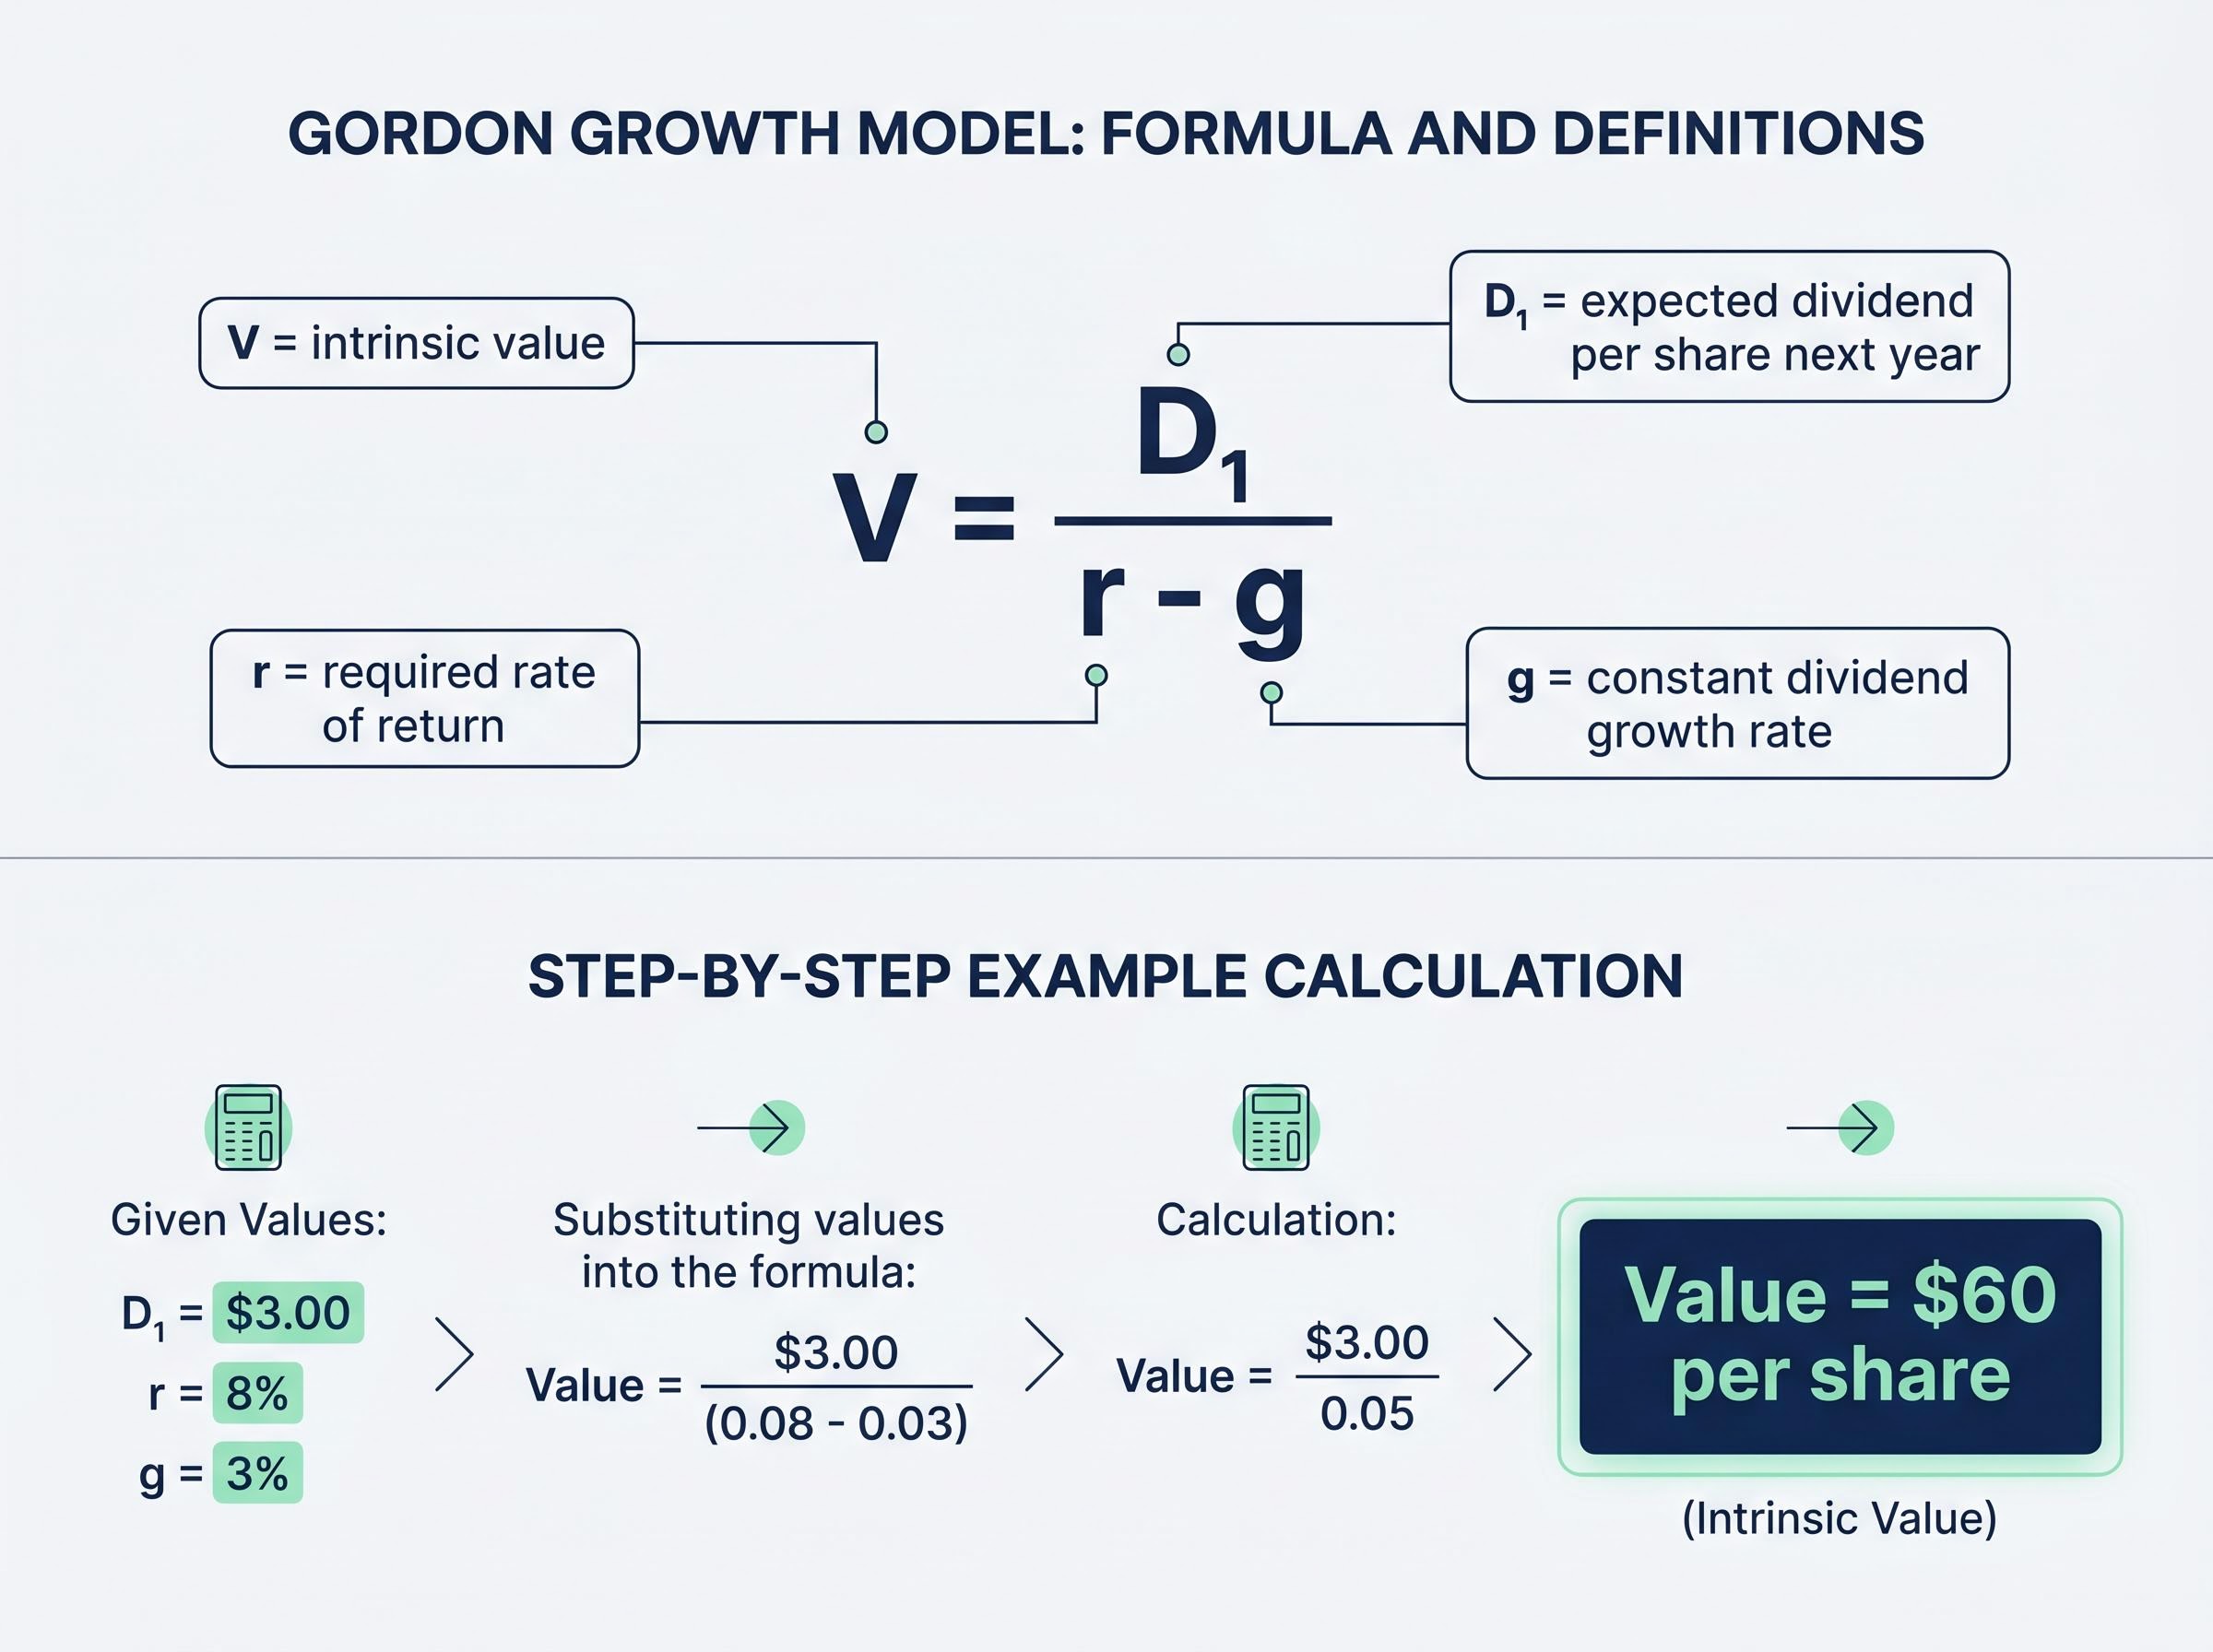
The most accessible variant is the Gordon Growth Model, which assumes dividends grow at a constant rate indefinitely.
Gordon Growth Model V = D₁ / (r – g)
Where V is intrinsic value, D₁ is the expected dividend per share next year, r is the required rate of return (cost of equity), and g is the constant dividend growth rate.
A brief illustration: if a company is expected to pay a $3.00 dividend next year, the required return is 8%, and dividends are expected to grow at 3% per year, the model produces a value of $60 per share. Small changes to either the discount rate or the growth assumption shift that figure materially, which is both the model’s analytical power and its principal sensitivity.
Three main DDM variants serve different situations:
Harvard Business School guidance positions the DDM as typically applied over a 5-10 year explicit forecast horizon before applying a terminal value.
The DDM can also be run in the opposite direction. If the current market price, the next expected dividend, and a reasonable long-run growth assumption are known, the formula can be rearranged to solve for the return the market is implicitly pricing in. The CFA Institute (2026) highlights this reverse application as one of the model’s practical strengths, particularly for relative valuation and market expectations analysis.
This implied return estimate serves as a cross-check: if the implied return falls below what an investor requires for the risk involved, the stock may be overvalued at its current price. If it exceeds the required return, the pricing may be favourable. For complex, multi-stage dividend streams, this implied return estimation typically requires iterative or trial-and-error numerical methods rather than a single algebraic step.
Three standard criticisms are levelled at the DDM with regularity. Each deserves fair treatment, but only one is genuinely distinctive to this model.
| Criticism | Applies to all DCF methods or only DDM? | Practical implication |
|---|---|---|
| Cannot be applied to non-dividend-paying companies | Only DDM | Limits the model’s domain of application to consistent dividend payers; does not diminish analytical quality within that domain |
| Outputs depend on the accuracy of future dividend forecasts | All DCF methods | Every discounted cash flow approach requires forecasting future cash flows; this is a property of DCF valuation generally |
| Results are highly sensitive to the chosen discount rate | All DCF methods | Discount rate sensitivity is inherent to present value calculations; not a weakness specific to the DDM |
The second and third criticisms collapse on inspection. Forecast dependence and discount rate sensitivity are properties shared by every discounted cash flow methodology. A free cash flow to the firm model is equally sensitive to both inputs. Attributing these characteristics specifically to the DDM misidentifies inherited features as distinctive flaws.
The first criticism, however, is genuine. The DDM is structurally unsuitable for companies that do not pay dividends, including most high-growth and early-stage businesses. This limits the model’s domain of application rather than its analytical quality within that domain.
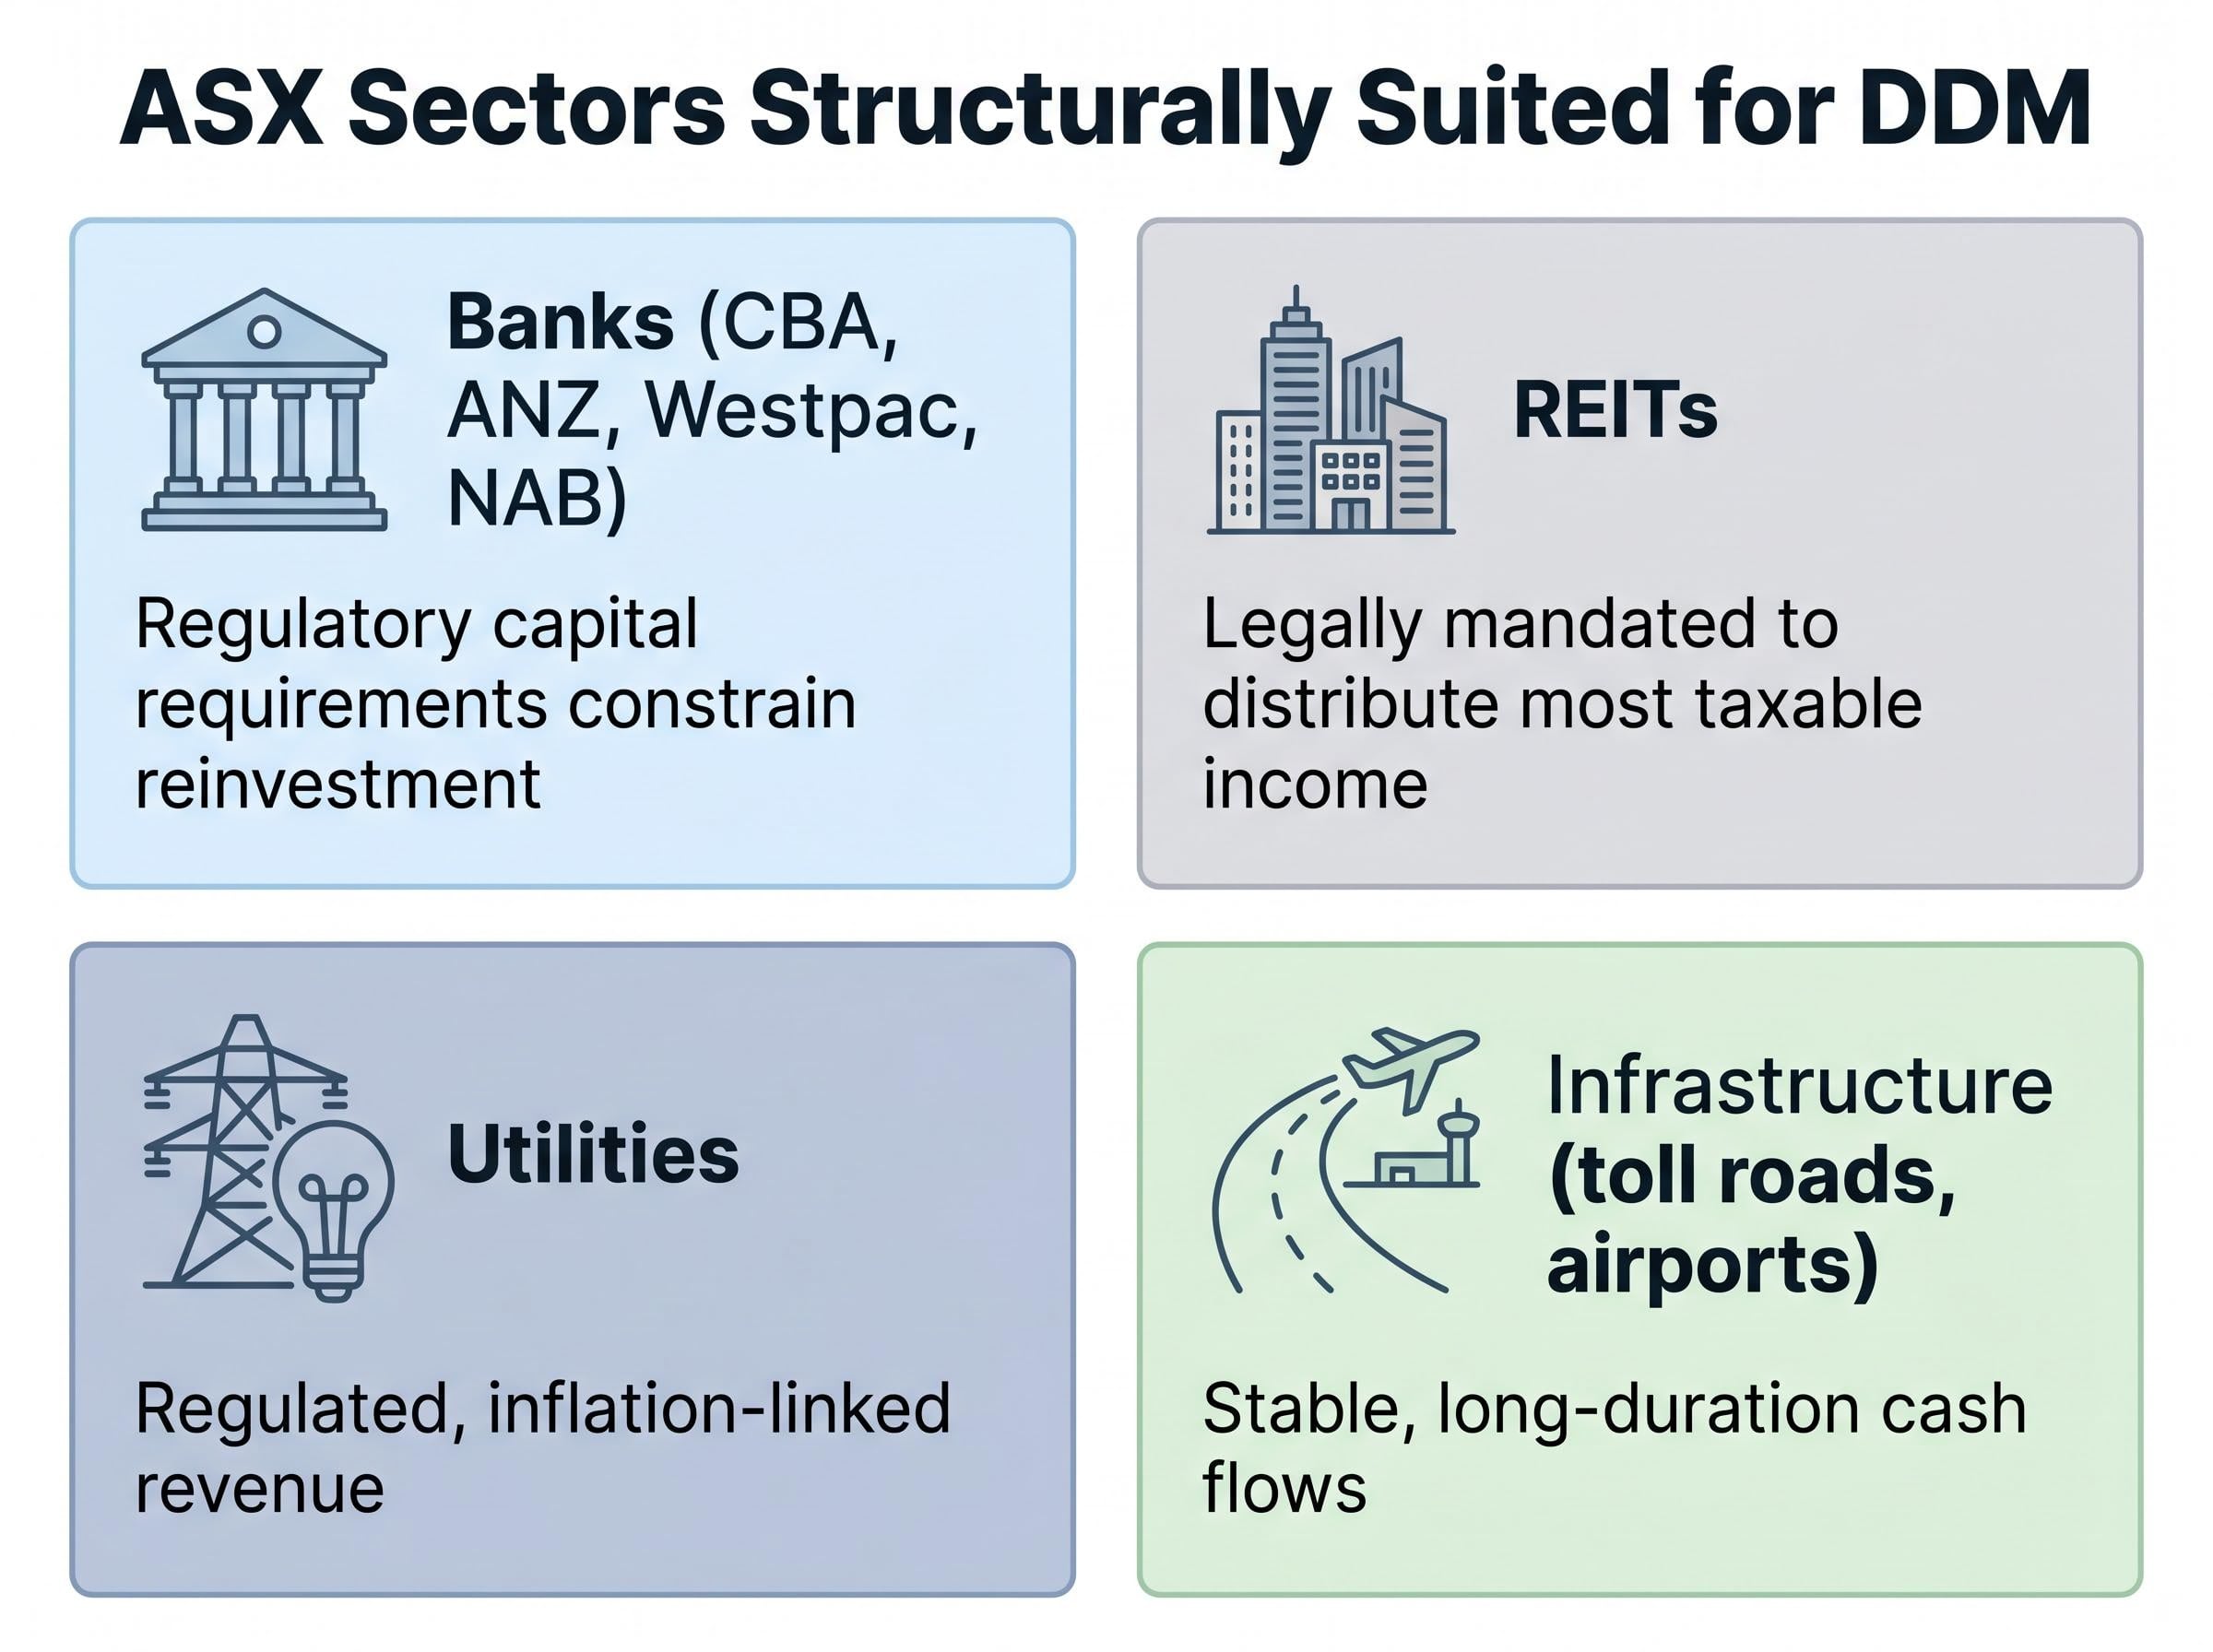
Reliability improves significantly when the model is applied to established companies in non-cyclical sectors where dividend trajectories are more predictable. Australian banks, REITs, utilities, and infrastructure companies fit this profile. For banks specifically, APRA’s capital adequacy requirements under the Basel III/IV framework constrain reinvestment flexibility, making dividends a primary return mechanism and strengthening the logical case for DDM application. ASX-listed REITs are legally required to distribute most taxable income, adding further predictability.
The discount rate input is a live variable in 2026. With the RBA cash rate projected in the 3-4% range and markets implying a 71% probability of a rate hike as of March 2026, Australian practitioners face real near-term uncertainty in calibrating this assumption.
Consider how a practitioner might apply the DDM to Commonwealth Bank of Australia (CBA) as an illustrative exercise, not as investment advice. The inputs would draw on analyst dividend forecasts for the next several years, historical payout ratios (which the major Australian banks have maintained at historically high and relatively stable levels), and a cost of equity derived via the capital asset pricing model using an equity beta.
In practice, a simplified estimation approach is workable for income-focused investors. Rather than building a full financial model, the primary analytical effort is directed at understanding the business itself: its competitive position, industry trajectory, and capacity to sustain and grow its dividend. Analyst projections and historical dividend data provide the quantitative inputs.
CBA dividend sustainability is a live debate among analysts in 2026, with 14 of 16 covering analysts rating the stock a sell on valuation grounds while acknowledging the bank’s unbroken fully franked payment record since 2006 and effective gross yields of up to 4.0% for SMSF holders in pension phase.
Four ASX sector categories are structurally suited to DDM application:
All other cash flows generated by a business ultimately serve the purpose of growing future dividends. This means those flows are implicitly captured through projected future distributions, making the DDM a more conservative approach than full cash flow models, consistent with Graham’s original framing.
Franking credits attach to dividends paid from corporate profits on which the company has already paid tax. For investors in low or zero tax brackets, particularly retirees and superannuation funds in pension phase, franking credits can be fully refunded. This significantly enhances the effective after-tax yield beyond what raw headline figures suggest.
The ATO guidance on franking credit refunds for individuals confirms that eligible taxpayers, including retirees and superannuation funds in pension phase, can receive cash refunds of excess franking credits where those credits exceed their tax liability, giving the effective after-tax yield a material uplift that unadjusted dividend figures do not capture.
For DDM purposes, this adjustment matters. When the investor base is dominated by tax-advantaged holders, the gross dividend including franking credits is the more accurate numerator. The required return estimate should reflect the investor’s actual after-tax cost of equity rather than a pre-tax rate. The result is that Australian dividend stocks are more attractive to the domestic investor base than unadjusted yield comparisons would indicate, and this has pricing implications for the shares themselves.
Grossed-up ASX bank yields vary materially across the Big Four once franking credit adjustments are applied correctly, with NAB’s effective gross yield reaching approximately 6.06% compared to CBA’s 3.99%, a spread that changes the relative income proposition significantly for tax-advantaged holders.
The ASX dividend yield profile is heavily concentrated in banks, materials, and utilities. Diversification of dividend income requires deliberate effort beyond index-weighted positions.
High yield ETFs on the ASX, such as the Vanguard Australian Shares High Yield ETF (VHY), implement the same structural tilt the DDM favours at the index level, concentrating exposure in financials and materials sectors whose dividend streams are most amenable to present-value analysis while mechanically excluding low or zero-yield sectors.
Investment returns are often discussed as though they are primarily realised at exit, when a share is sold. The period between purchase and sale is treated as merely transitional. For dividend-paying stocks, this framing misses something significant: the holding period itself is where much of the financial value is generated.
Dividends serve three distinct functions during the years an investor holds a position:
In the Australian retirement context, this matters acutely. For retirees in the superannuation drawdown phase, dividend income provides a structural mechanism for generating cash flow that can grow over time. Dividends from quality companies tend to increase over time, offering a natural inflation hedge that fixed-income instruments cannot replicate in a low-to-moderate rate environment.
The stated investment objective for many income-focused investors is building a passive income stream that grows at a rate exceeding inflation over time.
Sticky inflation through 2025-2026 has intensified interest in dividend-growing equities as a real-return-preserving strategy. Approximately 80% of Australian retirees have reported adjusting spending patterns in response to cost-of-living pressures, heightening concern about longevity risk and reinforcing the case for income streams that grow rather than remain fixed.
For investors wanting to build on these principles across a broader portfolio context, our dedicated guide to inflation investment strategy for Australian investors examines how six ASX-listed ETFs spanning capital preservation, bond income, and quality equity exposure can be combined when real cash returns are negative, including practical dollar cost averaging approaches suited to the current rate environment.
The DDM is one tool among several. Investors with meaningful exposure to non-dividend-paying growth companies will need other valuation approaches. No single model captures every type of business or every investment thesis.
For investors whose portfolios are anchored in mature, dividend-paying companies, however, the DDM’s focus on real cash flows received by shareholders is more intellectually honest than models built on cash flows the investor never directly handles. Many Australian equity investors fall into this category, given the structural composition of the ASX.
The philosophical thread runs from Williams through Graham to current practice: the logic of focusing on what a business actually returns to its owners, consistently and tangibly, is not an outdated constraint but a durable principle. The model’s simplicity is a practical virtue. By concentrating analytical effort on whether a business can sustain and grow its dividend, the investor is forced to focus on the quality of the underlying business, its competitive position, and its industry trajectory, rather than on elaborate multi-variable models.
The DDM is most reliably applied under four conditions:
When these conditions are met, the model offers a valuation framework that is both analytically sound and aligned with a long-term, income-focused investment philosophy.
Williams designed the DDM as a corrective to speculative behaviour, and its durability across nearly nine decades reflects the enduring logic of anchoring value in what a business actually returns to its owners. Two practical takeaways emerge from this framework: how to apply the model (with appropriate variant selection, franking credit adjustment for Australian investors, and a simplified inputs approach), and why dividends matter beyond their role as model inputs, through spending capacity, reinvestment optionality, and independence from exit pricing.
The distinction Williams drew between investing and speculation remains as relevant in 2026 as it was in 1938. The question for any investor examining their portfolio is straightforward: are returns being built on recurring, tangible income, or on assumptions about what someone else will pay in the future?
This article is for informational purposes only and should not be considered financial advice. Investors should conduct their own research and consult with financial professionals before making investment decisions.
The dividend discount model is a valuation method that estimates a stock's intrinsic value by summing the present value of all expected future dividends, discounted at the investor's required rate of return. The most common version is the Gordon Growth Model, which uses the formula V = D1 divided by (r minus g), where D1 is next year's expected dividend, r is the required return, and g is the constant dividend growth rate.
Australian banks (CBA, ANZ, Westpac, NAB), REITs, utilities, and infrastructure companies are structurally well suited to the dividend discount model because they have stable, predictable dividend streams. REITs are legally required to distribute most taxable income, while bank dividends are constrained by APRA capital requirements that limit reinvestment flexibility.
Franking credits represent corporate tax already paid, and eligible investors such as retirees and superannuation funds in pension phase can receive full cash refunds of excess credits, materially boosting the effective after-tax yield. For DDM purposes, the gross dividend including franking credits should be used as the numerator, and the required return should reflect the investor's actual after-tax cost of equity.
The DDM cannot be applied to companies that do not pay dividends, which limits its use to mature, consistent payers and excludes most high-growth or early-stage businesses. Sensitivity to the discount rate and dividend growth assumptions is a shared property of all discounted cash flow methods, not a flaw unique to the DDM.
The DDM is most reliable when the company is mature with an established operating history, operates in a stable and non-cyclical industry, has a consistent dividend payment record, and the investor's time horizon is five years or longer. Under these conditions it provides a valuation framework that is analytically sound and aligned with a long-term income-focused investment philosophy.