
How to Decode ASX Bank Valuations Using NIM, ROE, and CET1
9 hrs ago

Two investors look at the same ASX bank share. One checks the price-to-earnings ratio, sees a number well below the sector average, and concludes the stock is cheap. The other runs a dividend discount model, plugs in a conservative growth rate, and arrives at a fair value 40% higher than the current price. Both used legitimate tools. Both followed reasonable steps. Yet their conclusions sit so far apart that one would buy and the other would pass. The gap is not a flaw in either method; it is a feature of how bank stock valuation works when the inputs are live and contested. With the RBA cash rate at 4.35% following the 6 May 2026 hike, those inputs are shifting in real time. This guide walks through the two most common quantitative approaches to valuing ASX bank shares, explains how franking credits create a genuine fork in the calculation, and shows why neither method should be used alone to make an investment decision.
The price-to-earnings ratio is one of the simplest tools in equity analysis. It divides the current share price by annual earnings per share, producing a single number that represents how much an investor pays for each dollar of profit. A PE of 12 means the market is pricing the stock at 12 times its annual earnings.
The ratio becomes useful when compared across peers. If a bank trades at a PE well below the sector average, it may represent value. If it trades well above, investors are either paying a premium for quality or overpaying for hype. The technique is straightforward: calculate the PE, compare it to peers, and use the sector average to estimate what a “normally priced” version of the stock would cost.
Bendigo and Adelaide Bank (ASX: BEN) illustrates this. At a trading price of $10.49 with FY24 earnings per share of $0.87, BEN’s trailing PE sat at approximately 12x. The Big Four sector average on FY24 earnings was closer to 14-15x. Using a sector average of roughly 18x (which includes CBA’s structural premium), a sector-adjusted estimated value for BEN would be approximately $15.70 per share.
That figure looks compelling. It is also potentially misleading.
| Bank | FY24 PE (approx.) | Interpretive note |
|---|---|---|
| CBA | ~19x | Structural quality premium |
| WBC | ~14-15x | Mid-range among majors |
| NAB | ~13x | Below sector average |
| ANZ | ~12x | Lower end of Big Four |
| BEN | ~12x | Mid-tier discount |
| BOQ | ~10x | Deepest discount to sector |
Trailing PEs are distorted by credit cycle positioning. Higher loan loss provisions compress earnings per share, inflating the PE optically. One-off remediation charges and restructuring costs do the same. Raw cross-bank comparisons using a single reporting period can mislead investors who read the number literally.
PE ratio limitations for ASX banks become especially pronounced when NIM trajectories are diverging across the sector, because a compression in net interest margin that has already played out at one bank will appear in current earnings but will not yet be visible in a trailing multiple calculated from an earlier reporting period.
CBA has traded near 19x FY24 earnings, well above the sector average. Applying the sector-average PE to CBA would imply the stock is overvalued. That conclusion ignores the qualitative differentiation the ratio cannot capture: structurally higher return on equity, a technology platform that peers have not matched, and a franchise quality that the market has consistently priced at a premium for years. The higher multiple reflects perceived lower risk and superior earnings quality, not irrational exuberance.
“A low PE can reflect genuine undervaluation or genuine problems. The ratio alone cannot tell you which.”
The dividend discount model takes a different approach. Instead of comparing price to earnings, it asks a forward-looking question: what is this stream of future dividends worth to me today?
The formula is straightforward once the inputs are understood.
Price = D1 / (r – g)
The estimated share price equals the annual dividend divided by the difference between the required return and the expected dividend growth rate.
Three inputs drive the calculation, and each one deserves careful selection:
Banks are particularly suited to DDM analysis. They are mature, regulated, dividend-paying businesses with relatively predictable payout histories. The model’s assumption of ongoing dividends is less heroic for a major bank than for a growth company that may never pay one.
Using BEN’s $0.56 dividend, a 9% discount rate, and a 3% growth rate, the DDM produces an estimated fair value of approximately $9.33 per share. Change the discount rate to 8% and the output shifts to $11.20. The sensitivity is immediate and material, a point the guide returns to shortly.
Franking credits are not a bonus on top of the analysis. They are a variable that materially changes the output depending on who is doing the calculation.
When a bank declares a fully franked dividend, it means the company has already paid 30% corporate tax on the profit from which that dividend was distributed. An Australian resident taxpayer receives a tax credit for that amount, which either reduces their tax bill or generates a refund.
The gross-up calculation converts the cash dividend into its pre-tax equivalent:
The franking credit gross-up formula converts a cash dividend into its pre-tax equivalent by dividing the cash amount by 0.70 at the 30% corporate tax rate, a calculation that holds for fully franked dividends but must be adjusted where franking is partial or where the investor cannot utilise the credits.
Plugging the grossed-up figure into the DDM instead of the cash dividend produces a materially higher fair value estimate. Research modelling from Rask Invest illustrated this clearly with BEN: using the researcher’s adjusted dividend figures, the DDM produced $13.32 on a cash dividend basis and $19.64 on a grossed-up basis. The gap between those two numbers is not rounding error. It is a genuine fork in the methodology.
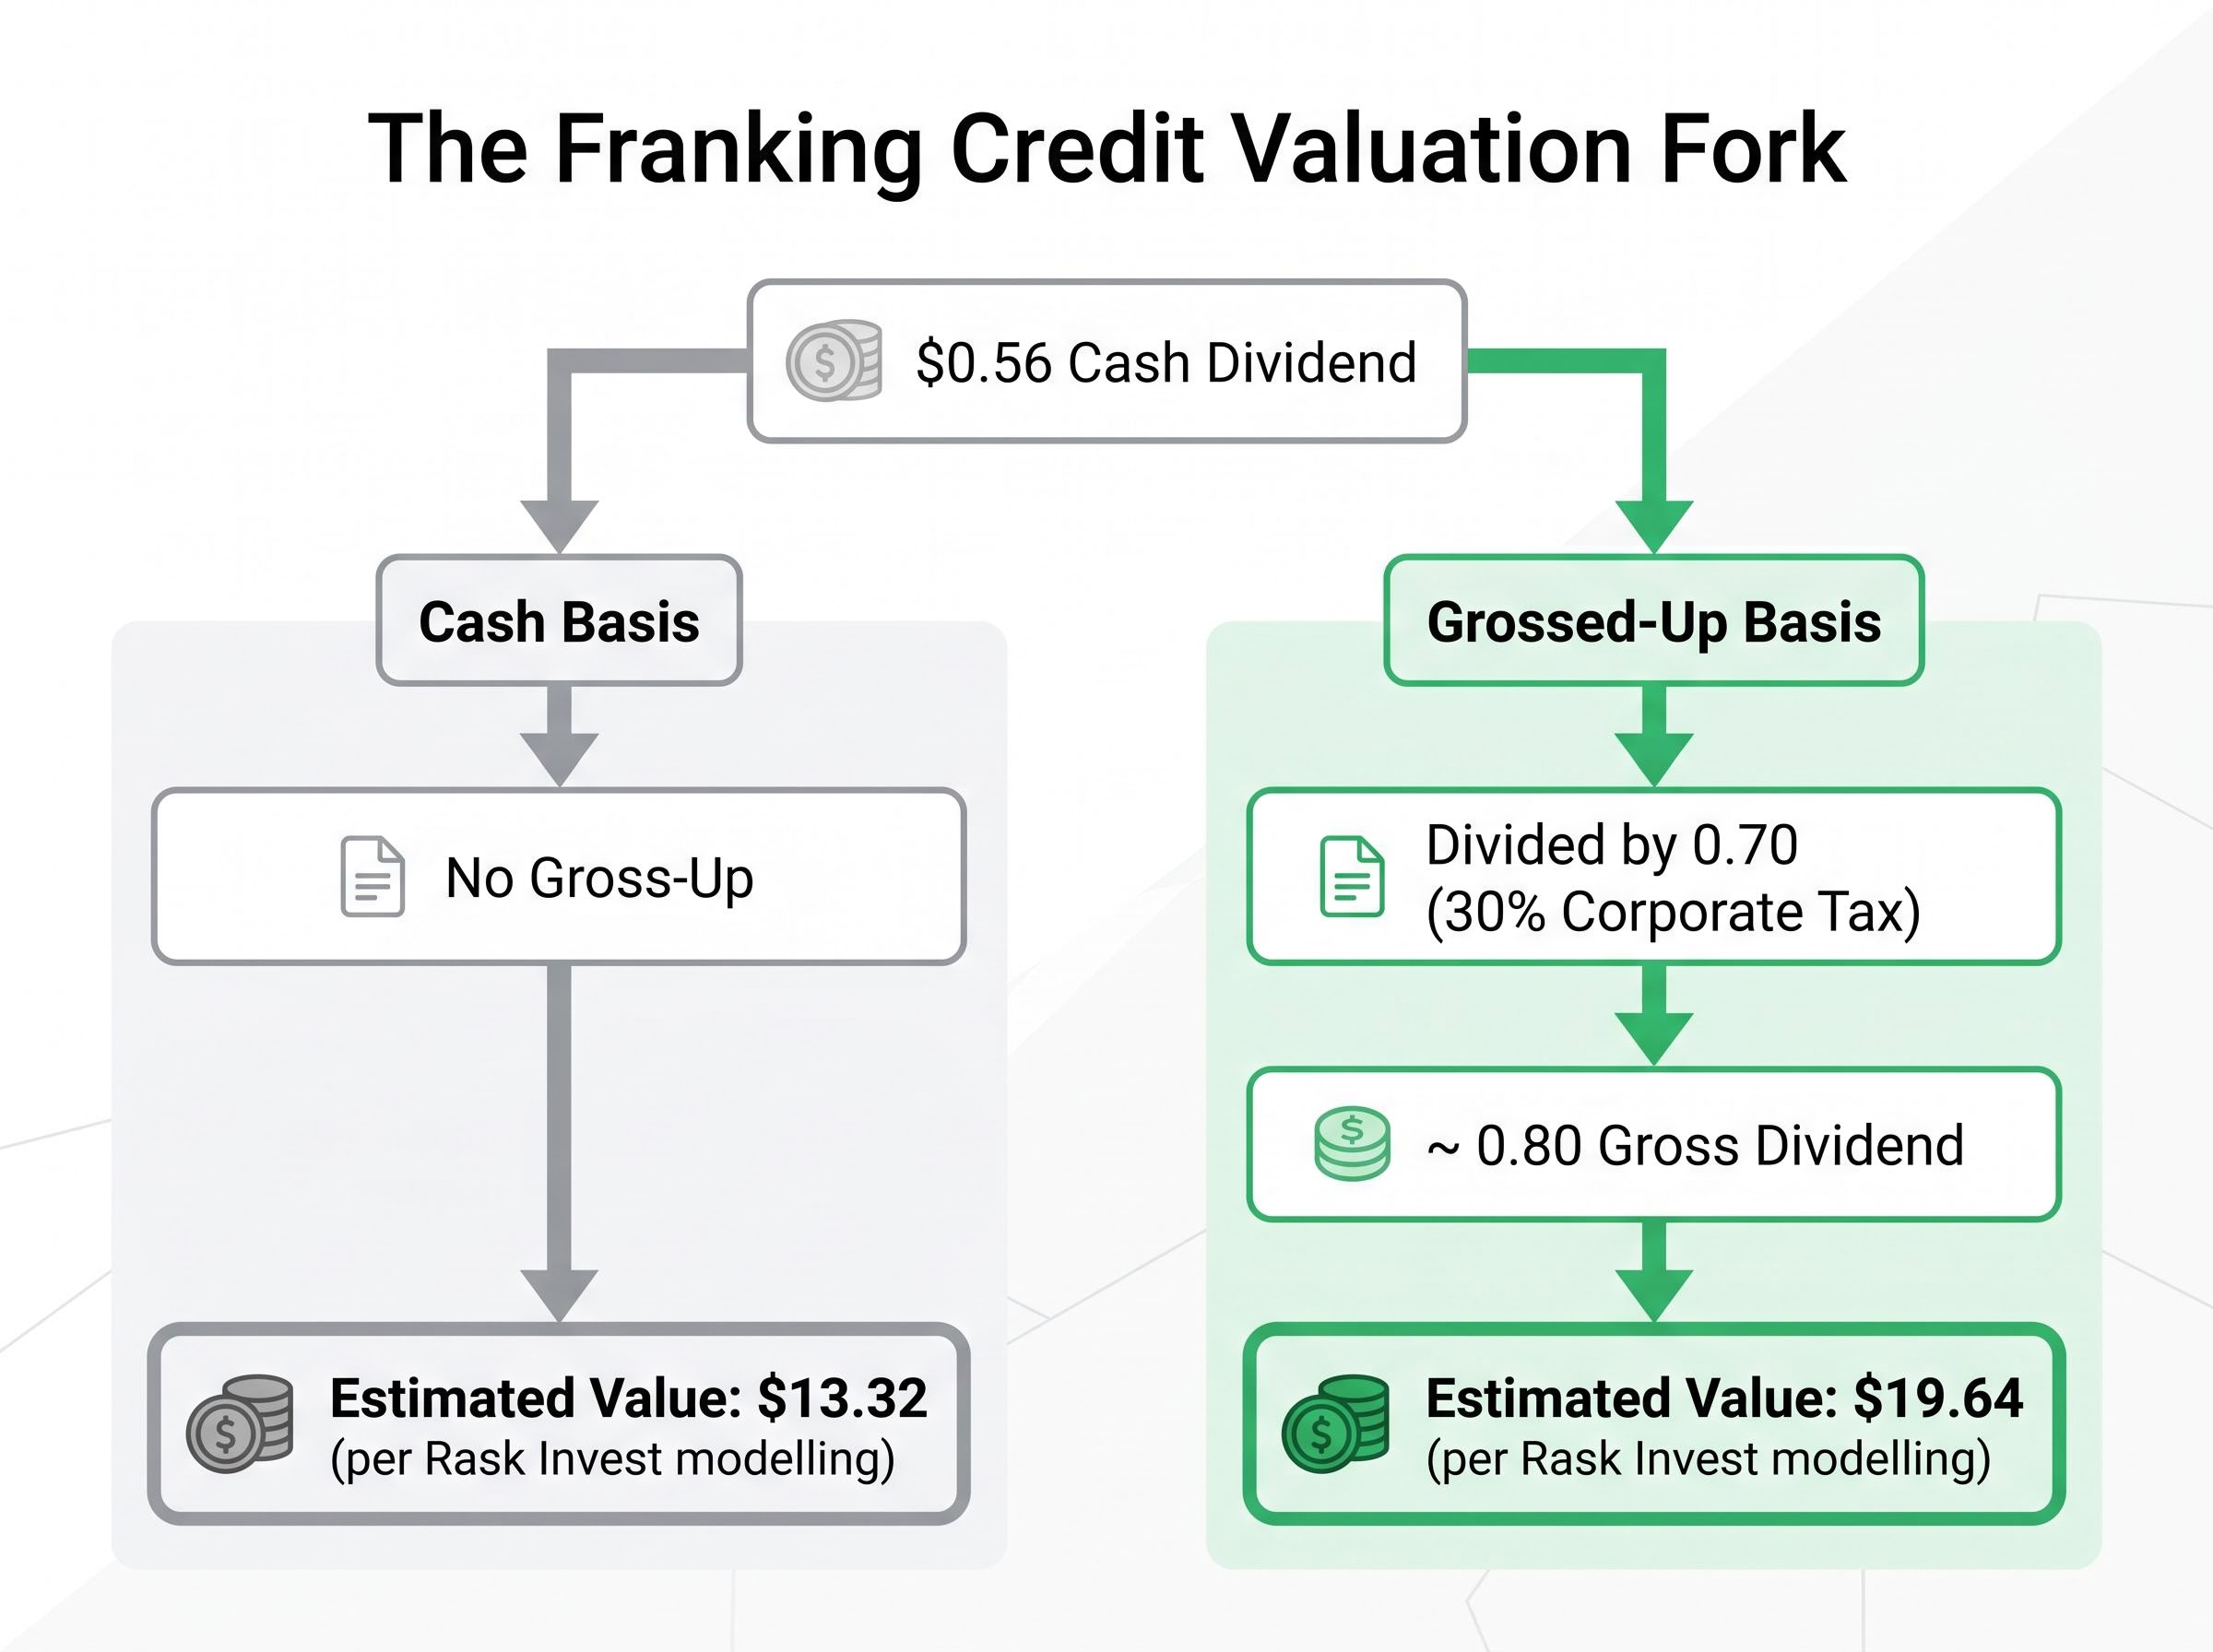
“The same DDM formula can produce two materially different valuations for the same share depending solely on the investor’s tax position.”
The gross-up applies to taxable Australian resident investors, particularly those at the 30-47% marginal tax rate brackets who can utilise the credits. Foreign investors cannot claim Australian franking credits and should use the cash dividend only.
Super funds in pension phase receive cash refunds on franking credits, but the mechanics differ from the standard retail calculation. Investors in this category should seek tax-specific advice rather than applying the standard gross-up formula.
The recommended approach is to run both calculations, with and without the gross-up, to understand how sensitive the valuation is to tax treatment.
A single DDM output is not a fair value. It is one point on a surface that shifts dramatically with small changes in assumptions.
Changing the discount rate from 9% to 11%, or adjusting dividend growth by 1-2 percentage points, can move the DDM fair value by 30-40%. Research modelling on BEN demonstrated the extremes: using the researcher’s inputs, the range stretched from $7.22 (at an 11% discount rate with 2% growth) to $32.50 (at a 6% discount rate with 4% growth). The spread between those figures is wider than many investors expect from what appears to be a simple formula.
The sensitivity of macro assumptions in bank valuation is illustrated sharply by NAB, where the same model produces a fair value range from $19.00 to $85.50 depending entirely on the growth and discount rate inputs chosen, a spread that dwarfs the typical premium-to-discount gap observed in standard PE comparisons across the sector.
The following illustrative matrix shows how fair value estimates shift across plausible assumption combinations for a hypothetical bank share paying a $0.56 annual dividend:
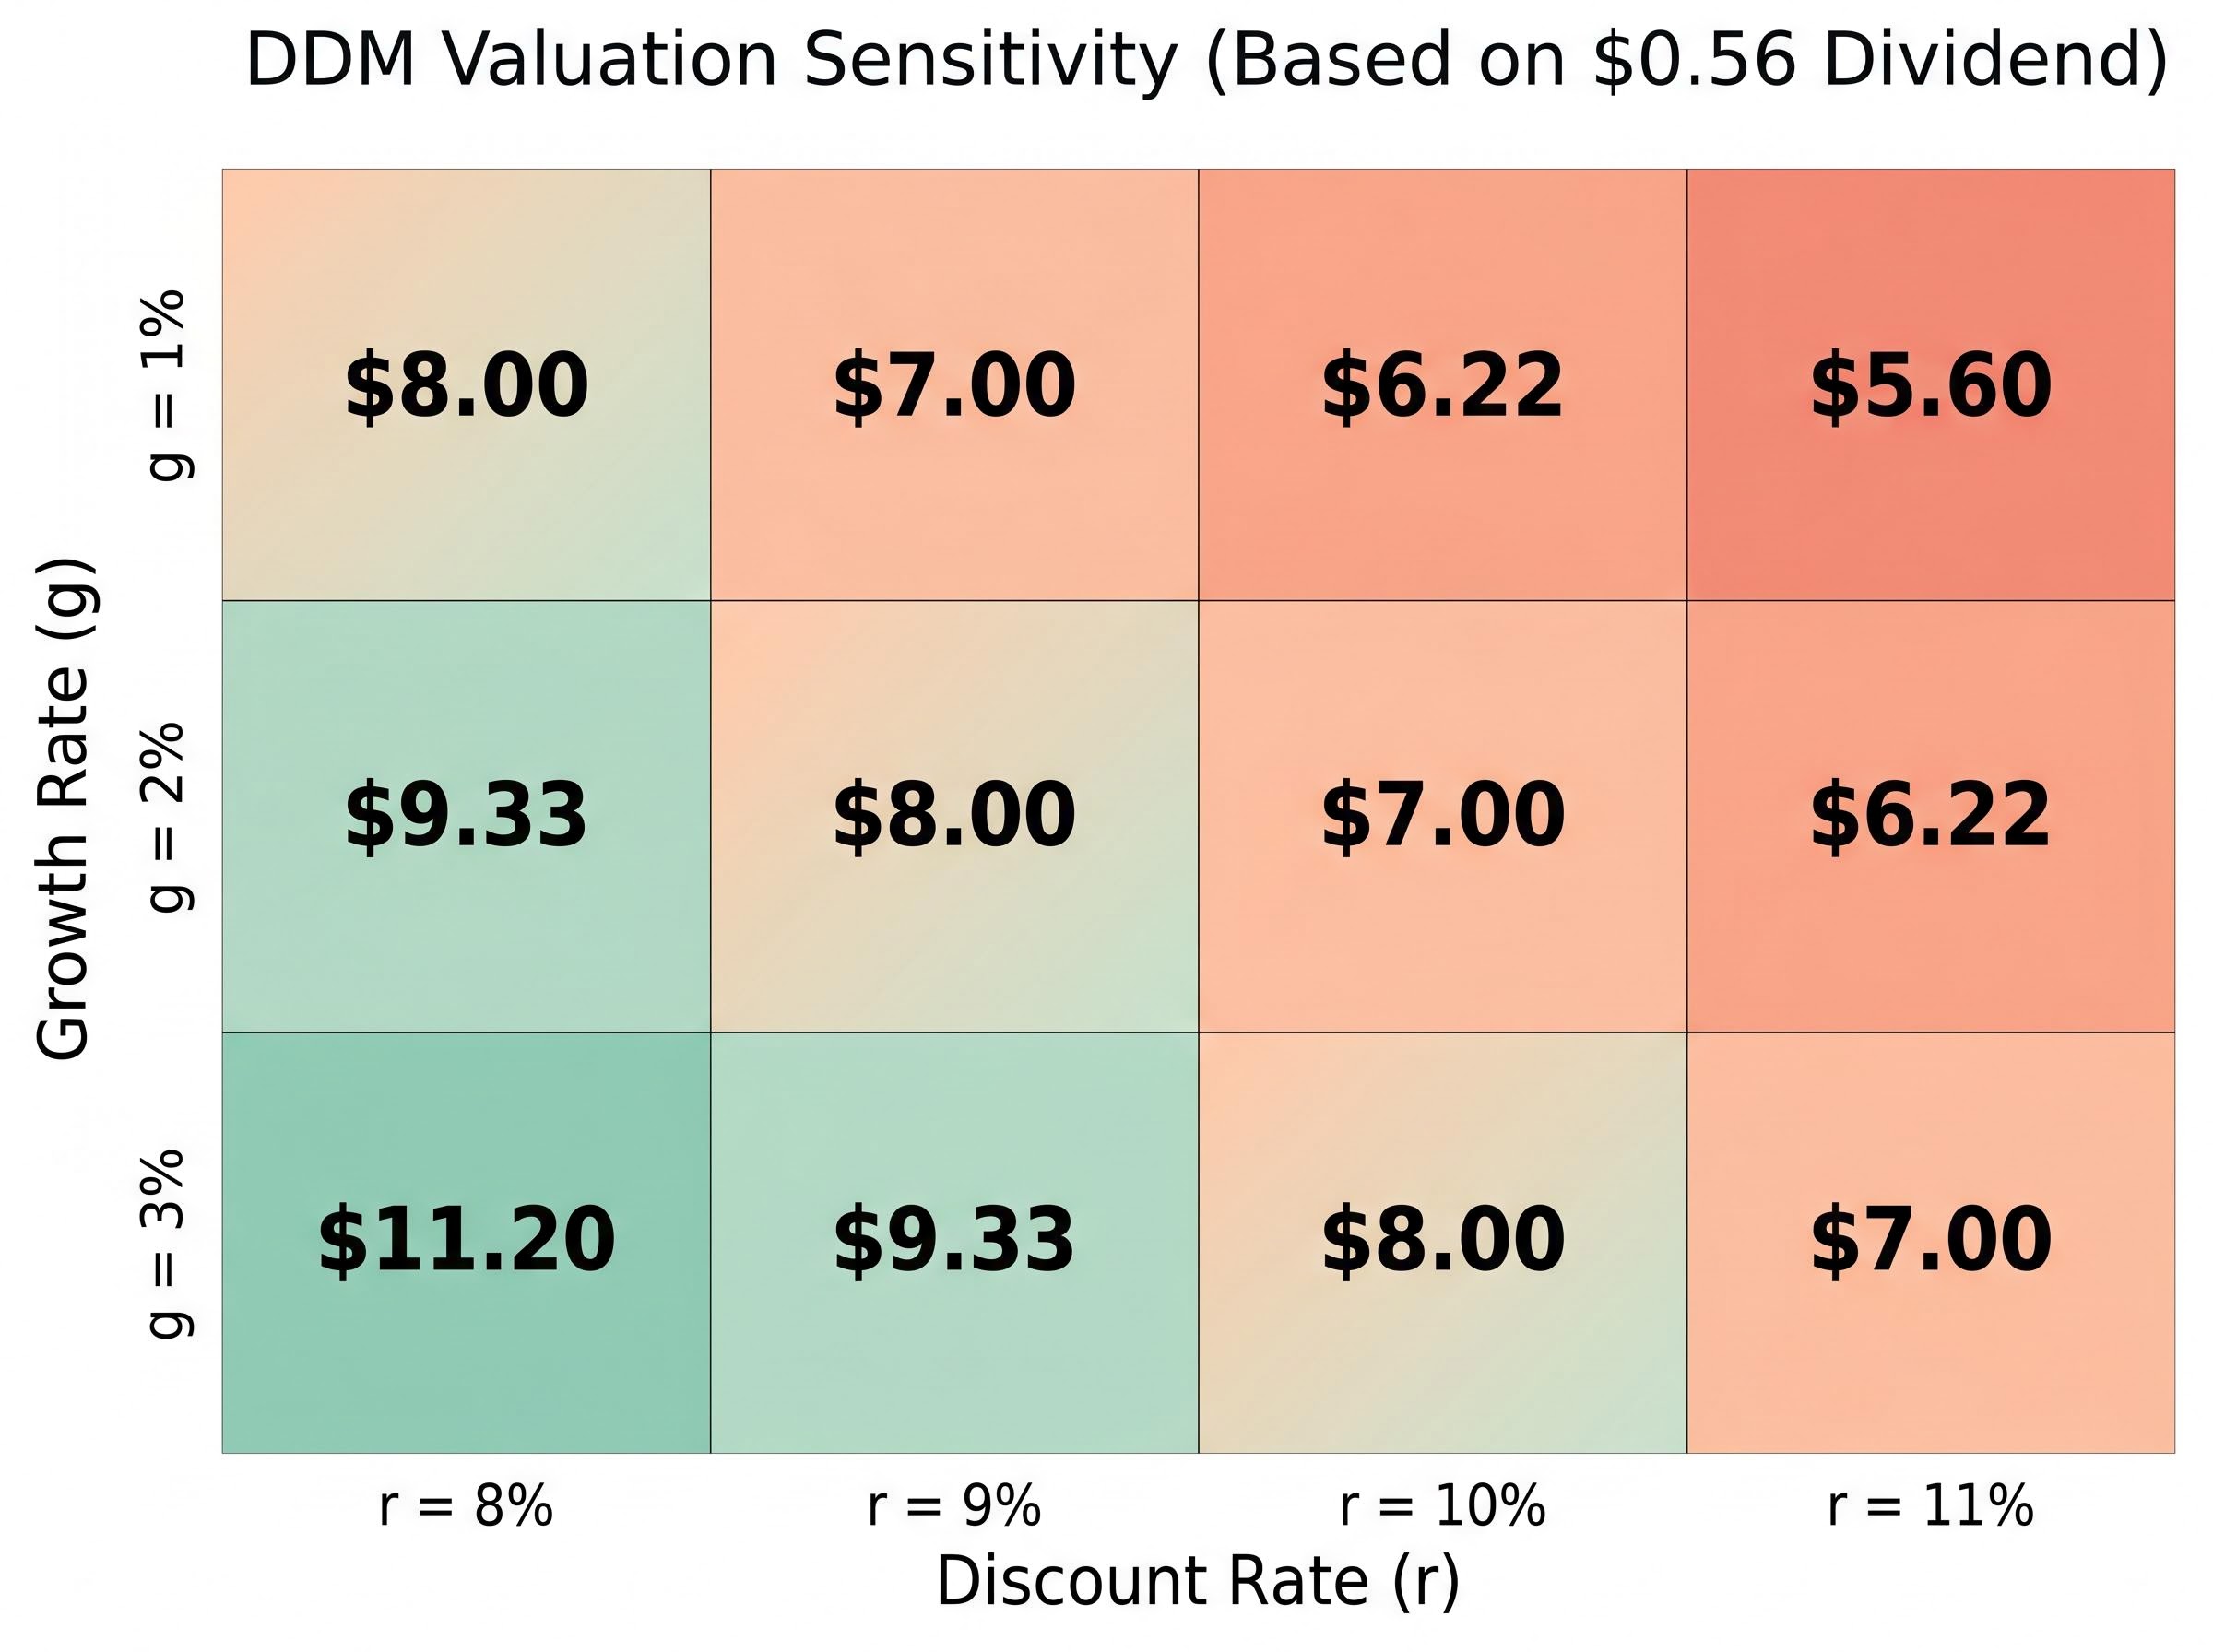
| Growth rate | r = 8% | r = 9% | r = 10% | r = 11% |
|---|---|---|---|---|
| g = 1% | $8.00 | $7.00 | $6.22 | $5.60 |
| g = 2% | $9.33 | $8.00 | $7.00 | $6.22 |
| g = 3% | $11.20 | $9.33 | $8.00 | $7.00 |
The table makes the sensitivity visible. A two-percentage-point shift in the discount rate, holding growth constant at 2%, moves the output from $9.33 to $6.22. That is a 33% decline in estimated fair value from an input change well within the range of reasonable disagreement.
Multiple sources, including Rask Media, Morningstar, and AFR commentary, describe the DDM as “a compass, not a GPS”: useful for directional thinking about whether a stock looks broadly over- or undervalued, but not reliable as a single-point estimate.
With the RBA resuming hikes in May 2026, anchoring a DDM to a single discount rate is especially risky. The input itself is in motion. Running at least three discount rate scenarios (8%, 9%, 10%) across at least three growth rate scenarios (1%, 2%, 3%) and treating the matrix as a valuation range is the recommended practice.
PE ratios and DDMs process numbers. They do not process judgment. The gap between a model output and an investment decision is filled by factors the formula was never designed to capture.
Four forces sit outside both frameworks for Australian banks:
APRA’s capital requirements deserve particular attention. Higher regulatory capital buffers reduce available leverage and constrain return on equity in ways that directly affect sustainable dividend capacity. Standard retail DDM models rarely account for this explicitly. According to Rask Invest commentary, comprehensive bank analysis can require well over 100 hours of qualitative work before financial modelling begins.
APRA’s unquestionably strong capital framework sets the CET1 ratio benchmarks and capital buffer requirements that constrain how much leverage Australian banks can carry, placing a structural ceiling on return on equity that standard PE or DDM models do not automatically reflect.
A DDM or PE analysis that suggests a stock looks cheap is a reason to investigate further. It is not a reason to buy.
The investigation phase covers the qualitative factors listed above and typically involves reading annual reports, APRA regulatory updates, and broker research with a critical lens. A model output that survives that scrutiny is worth considerably more than one that has never been tested against it.
The RBA cash rate sits at 4.35% following the 6 May 2026 hike. That decision reversed the rate-cutting narrative that had dominated market commentary through early 2025. For investors applying the methods in this guide, the rate environment changes both the inputs and the confidence with which those inputs can be set.
The RBA’s May 2026 rate decision reversed a rate-cutting narrative that had dominated market commentary through early 2025, with eight of nine Board members voting for the hike and forward guidance language that preserved full optionality on a fourth move at the July meeting.
The RBA’s May 2026 cash rate decision confirmed the target rate at 4.35 per cent, providing the risk-free rate anchor that directly feeds into the discount rate range any DDM applied to Australian bank shares must incorporate.
Higher rates create two opposing forces for bank valuations:
The resumed hiking cycle makes the discount rate input particularly important to stress-test. A discount rate that was appropriate six months ago may understate the current required return. With term deposits paying above 4%, discount rates below 8% for bank DDMs are not defensible in the current environment. The implied range of 8.35-10.35% (cash rate plus a 4-6% equity risk premium) provides a principled starting point that readers can update as monetary policy shifts.
“FY24 figures are now approximately 18 months old. Always verify current PE multiples and DPS figures from the latest ASX announcements before applying these methods to a live decision.”
The FY24 PE and dividend data cited throughout this guide was reported in 2024. FY25 results are available from multiple banks. Readers should verify current figures from ASX announcements and bank investor relations pages (CBA, WBC, NAB, ANZ, BEN) before applying any worked examples to live investment decisions.
PE ratios and DDMs are both useful. Both are limited. Used together, with explicit acknowledgment of their inputs and assumptions, they help investors identify stocks worth investigating. Used carelessly, they produce false precision that feels like analysis but functions as guesswork.
The practical framework for applying these methods to ASX bank shares involves a consistent sequence:
The franking credit fork means the same share is worth a different number depending on who is holding it. The sensitivity matrix means the same formula produces a range, not a point. Both realities argue against treating any single output as a target price.
In a rate environment where the RBA is actively hiking, both the earnings outlook for banks and the appropriate discount rate are in motion. Models built today should be revisited when the rate environment shifts. The investor who treats a DDM output as a hypothesis to test, rather than a verdict to act on, is using the tool the way it was designed to be used.
This article is for informational purposes only and should not be considered financial advice. Investors should conduct their own research and consult with financial professionals before making investment decisions. Past performance does not guarantee future results. Financial projections are subject to market conditions and various risk factors.
The dividend discount model estimates a share's fair value by dividing the expected annual dividend by the difference between the required return and the expected dividend growth rate. It is particularly suited to mature, regulated, dividend-paying banks because the assumption of ongoing dividends is more reliable than for growth companies that may never pay one.
Franking credits represent corporate tax already paid by the bank, and Australian resident investors can gross up the cash dividend to its pre-tax equivalent by dividing it by 0.70 at the 30% tax rate. Using the grossed-up figure instead of the cash dividend in a DDM produces a materially higher fair value estimate, so running both versions and understanding your own tax position is essential.
PE ratio analysis compares current earnings multiples to sector peers, while a DDM projects future dividends and discounts them at a required return, and each method uses different inputs that can be set within wide ranges of reasonable disagreement. Small changes in the discount rate or growth rate assumption alone can shift a DDM fair value by 30-40%, which is why the two approaches frequently produce divergent results.
A higher cash rate raises the risk-free rate anchor, pushing the required return in any DDM to a principled range of approximately 8.35-10.35% (cash rate plus a 4-6% equity risk premium), which compresses fair value estimates for the same dividend stream. At the same time, elevated rates support bank net interest margins, creating opposing forces that make stress-testing multiple discount rate scenarios more important than ever.
Trailing PE ratios are distorted by credit cycle positioning, one-off loan loss provisions, and restructuring charges that compress earnings per share in ways that inflate the multiple optically and do not reflect underlying earnings quality. Cross-bank comparisons are also complicated by structural premiums, such as CBA trading near 19x, where a higher multiple reflects superior franchise quality rather than overvaluation.


