Samsung Q2 2026 Profit Forecast to Hit 86 Trillion Won, Up 18x
27 mins ago
Australian bank stocks have generated reliable franked dividends for decades, but the analytical habits most retail investors bring to evaluating them stop at the price-to-earnings ratio. That is precisely where the most important questions begin. With the big four collectively representing roughly 30% of the ASX by market capitalisation, and with net interest margin (NIM) headwinds, regulatory scrutiny of fee income, and genuine cultural divergence between the banks now visible in financial results, the qualitative layer of analysis has never mattered more. In May 2026, valuations across the sector sit in a narrow band, making the non-numerical differences between banks the primary driver of long-term relative returns. What follows is a structured qualitative framework for evaluating the big four before buying, and a clear-eyed view of when an ETF is actually the better answer.
Standard valuation models give investors a numerical anchor. They do not capture the variables that most affect whether a bank grows or erodes earnings over a decade. The price-to-earnings ratio and the dividend discount model (DDM), a method for estimating a stock’s value based on the present value of its expected future dividends, are backward-looking inputs. Both embed assumptions about NIM, fee income, and credit quality that require independent qualitative verification.
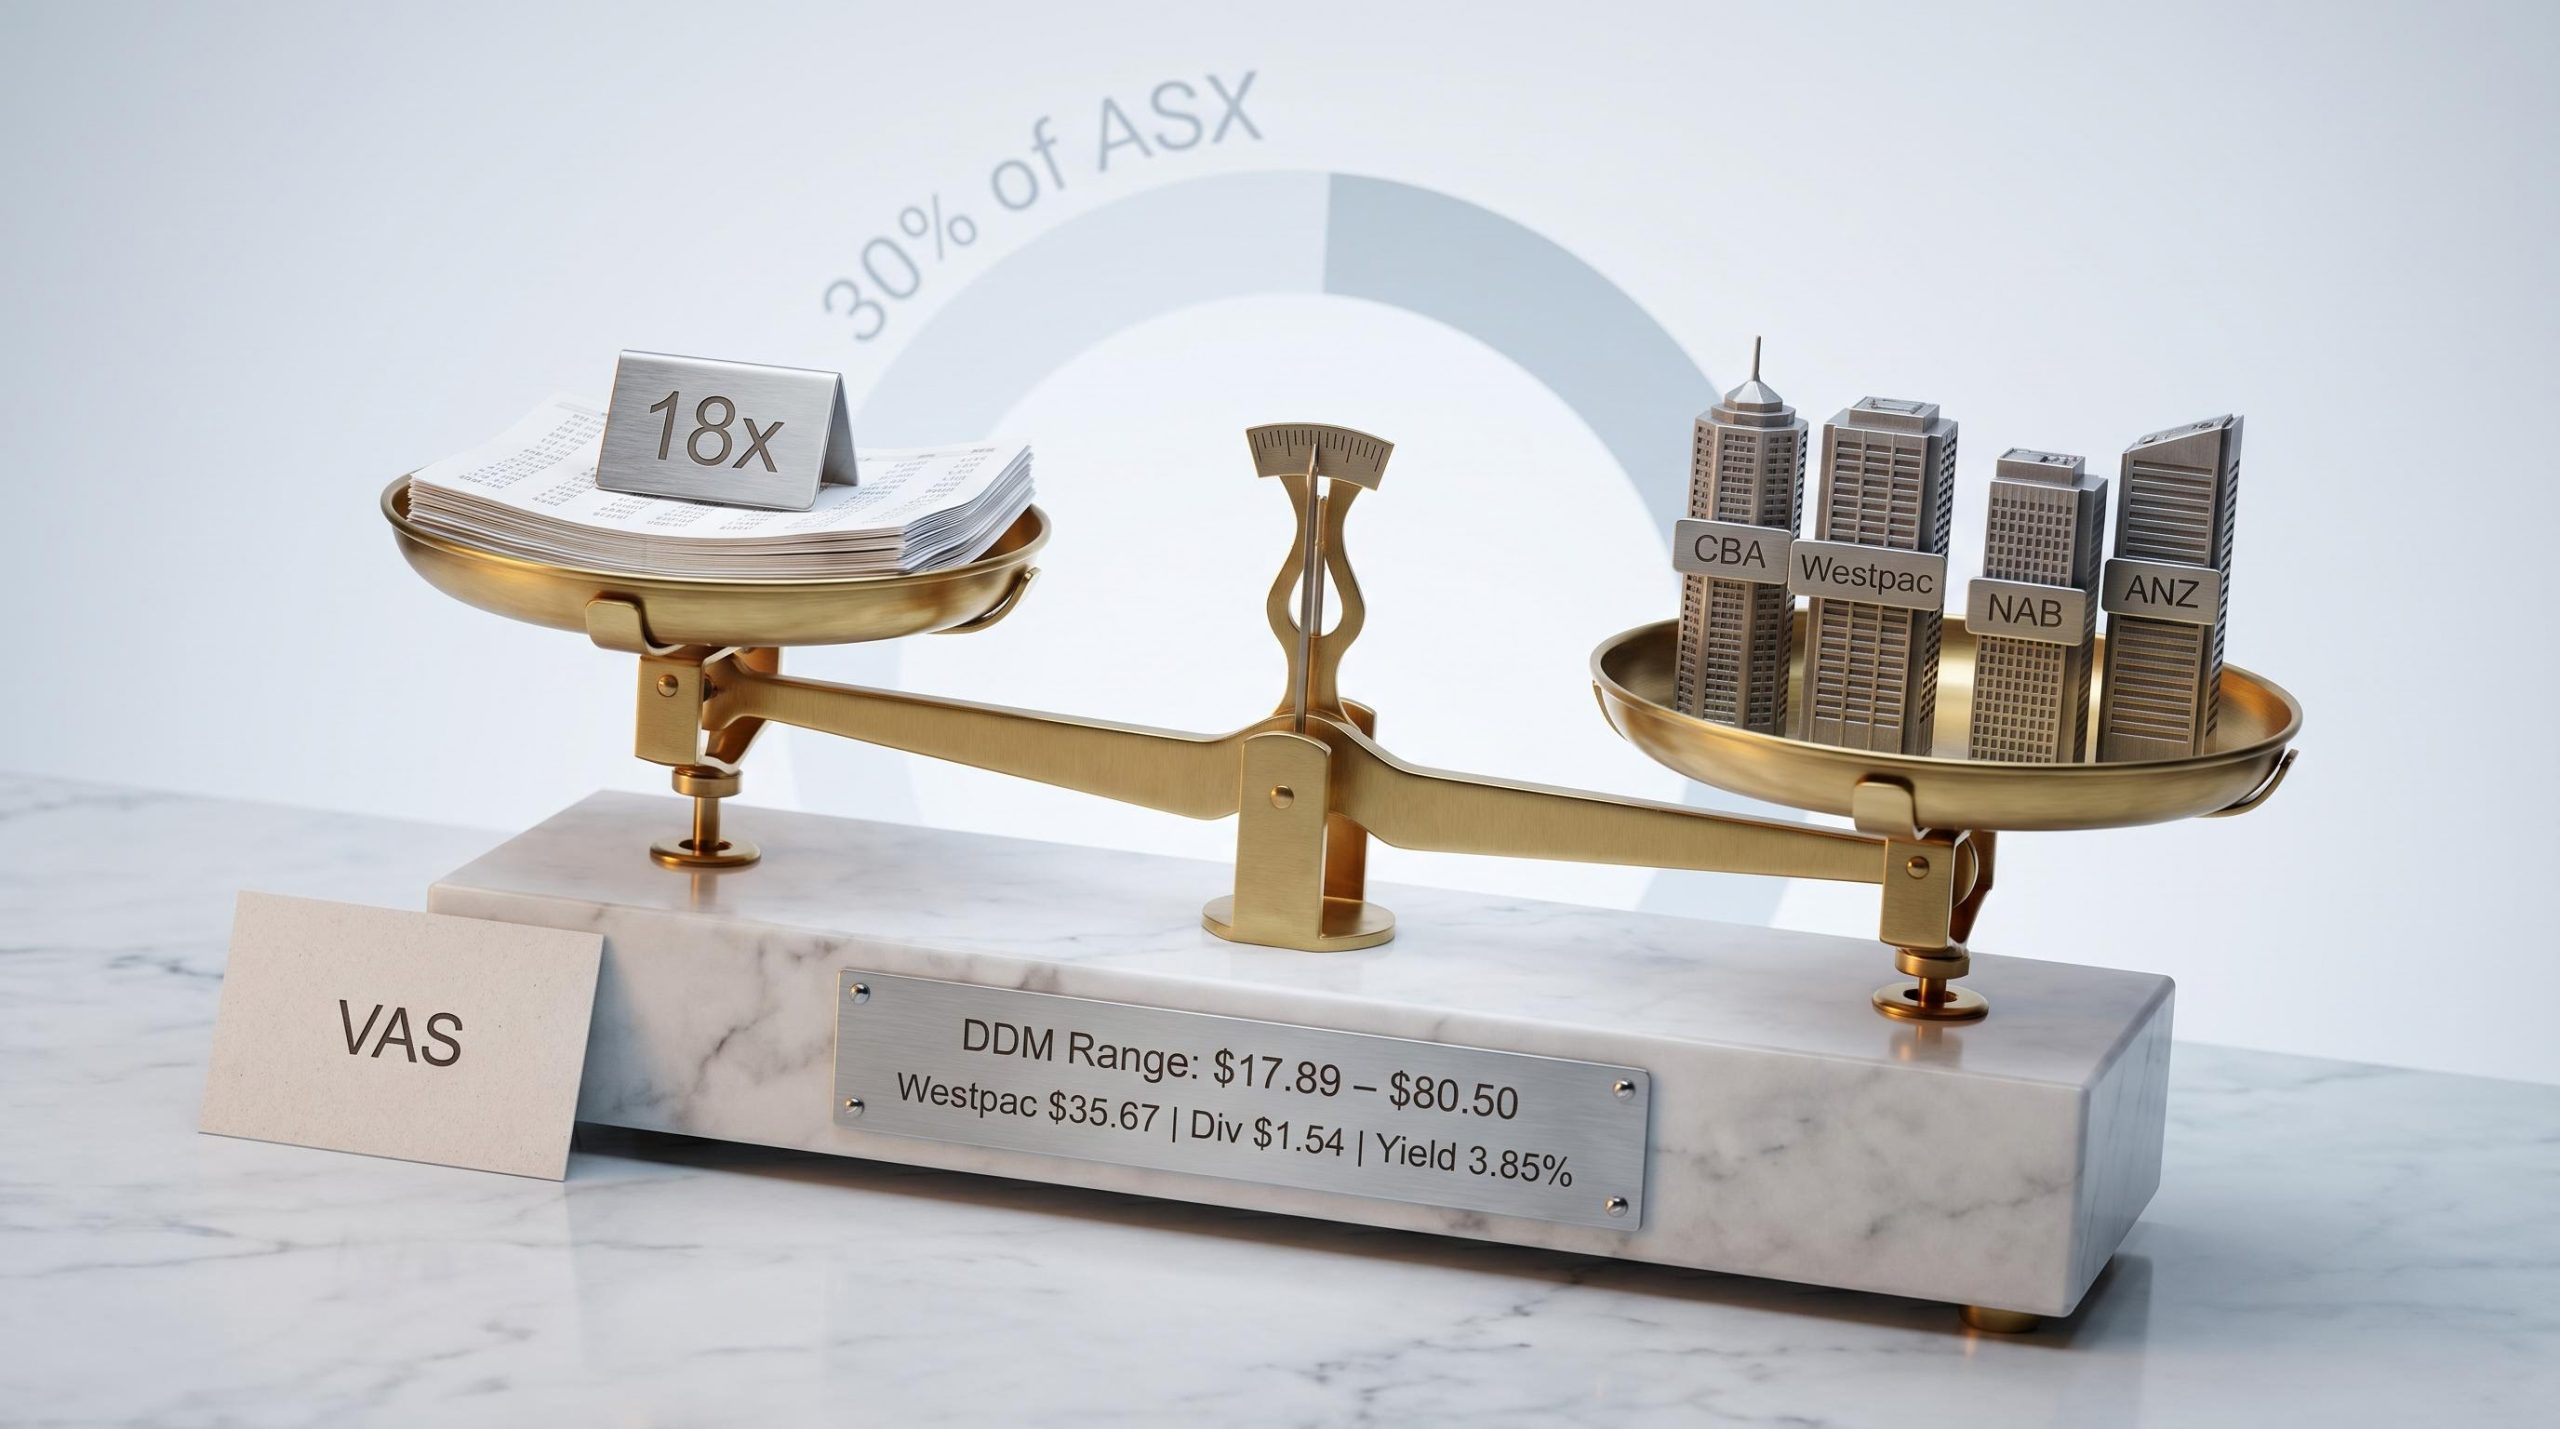
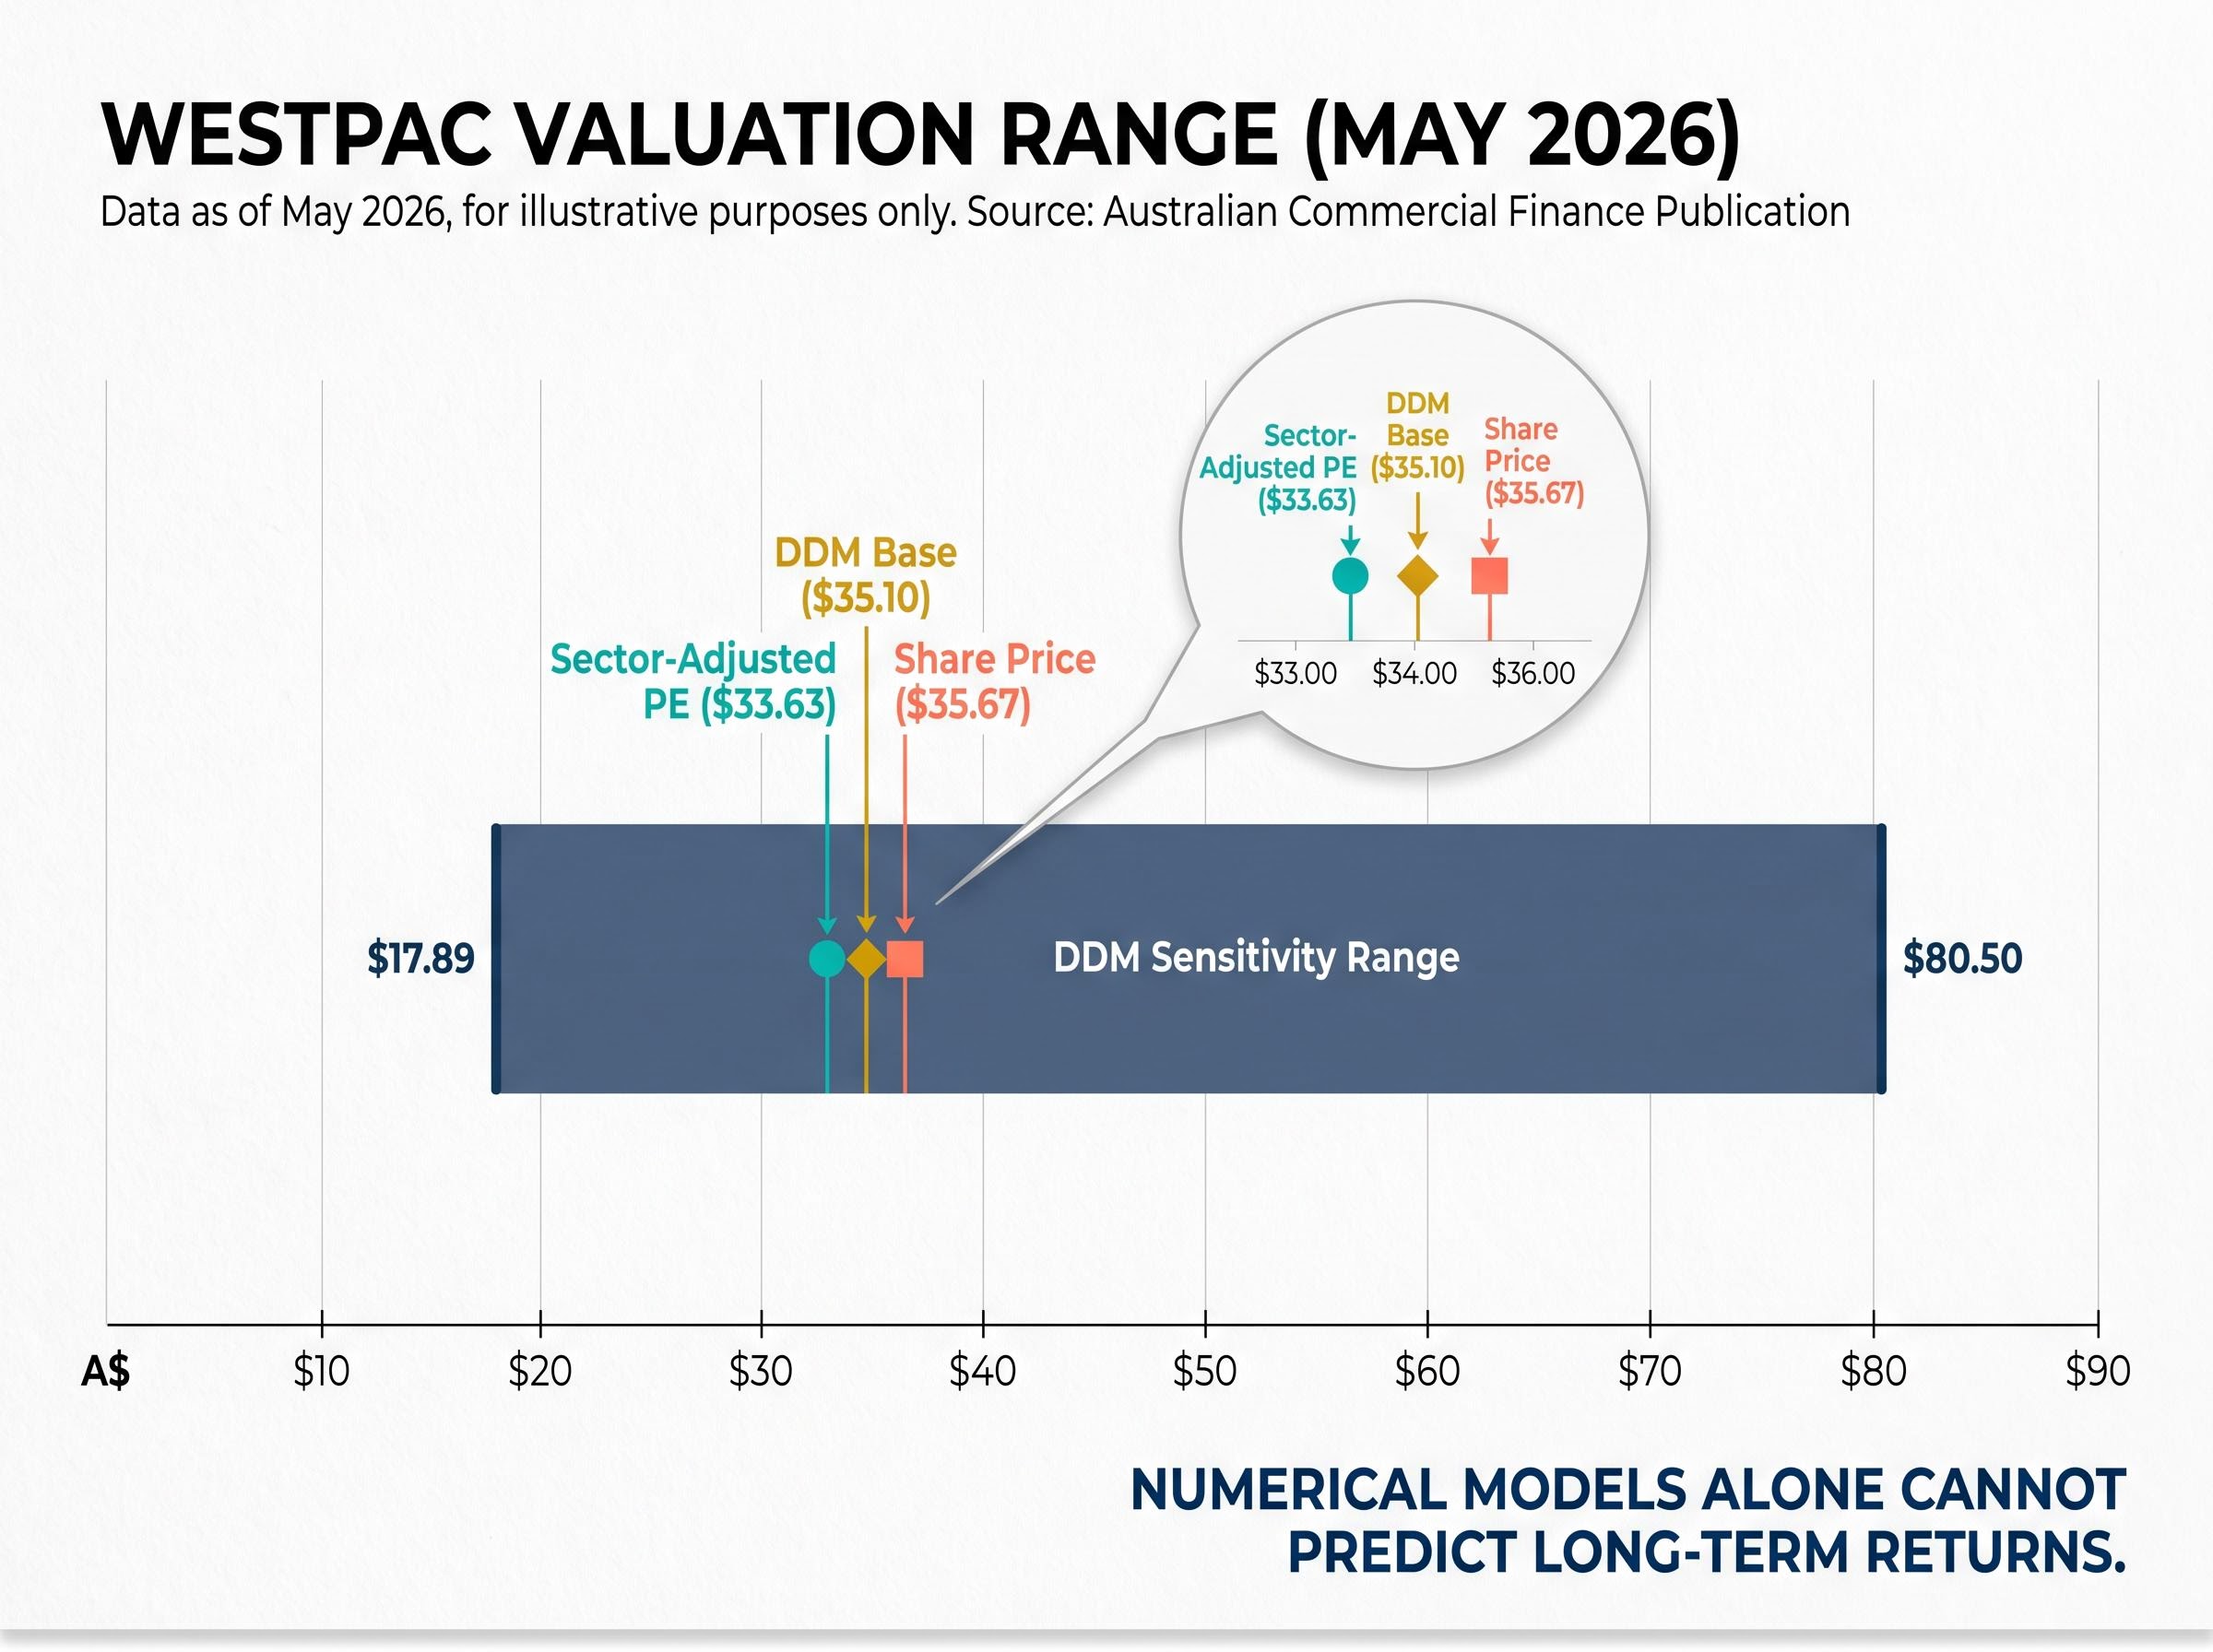
Consider Westpac. It trades at approximately 18.6x trailing earnings against a sector average of roughly 18x, producing a sector-adjusted valuation of about $33.63 against a May 2026 share price of $35.67. That looks like a modest premium. A DDM approach returns a base valuation near $35.10, which appears to confirm the market’s pricing.
The DDM’s sensitivity range tells a different story. Depending on the growth and discount-rate assumptions used, the same model produces valuations ranging from $17.89 to $80.50, a spread so wide it exposes how little the model alone can tell an investor.
Because the big four are so closely valued, the differentiation between them is almost entirely qualitative: NIM trajectory, regulatory exposure, management execution, and portfolio concentration. Those are the subjects that follow.
For investors who want to build the quantitative foundation before applying this qualitative framework, our dedicated guide to ASX bank stock valuation methods walks through PE, price-to-book, DDM, and DCF in detail, covering why each carries specific limitations for banks where earnings can be distorted by credit cycles, remediation charges, and regulatory capital changes.
The intuitive assumption is straightforward: higher interest rates benefit banks. They did. During the Reserve Bank of Australia’s rate-hike cycle of 2022-2023, NIMs expanded sharply across the sector. That tailwind has largely played out.
| Bank | FY24 NIM range | NIM trajectory | Primary future NIM driver |
|---|---|---|---|
| CBA | 1.90-1.95% | Flat to slightly lower | Mortgage competition, deposit switching |
| Westpac | 1.85-1.90% | Stabilising | Business lending offset by mortgage pressure |
| NAB | 1.72-1.78% | Stabilising | Business and institutional mix |
| ANZ | 1.65-1.75% | Stabilising | Deposit pricing discipline, cost reduction |
CBA retains the strongest NIM, reflecting its deposit franchise and pricing power. ANZ sits at the bottom, though its May 2026 half-year result showed a cost-to-income ratio falling to approximately 49-50% and return on equity (ROE) rising to roughly 10-11%, with NIM described as “stabilising.” NAB management noted in December 2024 that deposit margin compression had “largely played out.”
Two structural pressures keep NIM capped across the sector:
Investors who extrapolate the 2022-2023 NIM expansion forward will significantly overestimate future earnings-per-share growth. The easy margin gains are already in the numbers.
Regulation is not a background concern for bank investors. It is an active earnings headwind, particularly for the non-interest income streams that banks have historically relied on to diversify revenue.
The structural decline began with the Hayne Royal Commission. All four banks have since exited large parts of wealth management and financial advice, removing what were once meaningful fee-income lines. ASIC and APRA enforcement through 2024-2025 on fees-for-no-service and remediation costs reinforced the exit.
Three regulatory pressure points remain in order of earnings materiality:
The Financial Accountability Regime (FAR), which strengthens personal accountability for bank executives around conduct and product design, limits how aggressively banks can launch products with complex or opaque fee structures. The CDR continues to erode the information asymmetry that supported higher fees.
The strategic response, growing transaction banking, foreign exchange, and SME services, involves equally competitive and scrutinised revenue lines. Westpac’s approximately $153 million support package for regional in-person banking illustrates the reputational and political exposure that further constrains pricing decisions. Investors who underwrite bank earnings on the assumption that non-interest income will grow steadily are likely to be disappointed.
Morgans’ simultaneous sector-wide sell ratings on all four major banks, issued ahead of the May 2026 reporting season, reflected the same convergence of stretched valuations, rising provisions, and deteriorating household credit quality that makes the qualitative layer of bank analysis so consequential; by April 2026, the firm was forecasting total Big Four provisions rising from approximately $2.4 billion in FY25 to $5.5 billion by FY27.
The four banks are not interchangeable franchises with slightly different multiples. They are organisations at genuinely different points on a cultural trajectory, and the investor question is not just “which is best now” but “which trajectory is most likely to close or widen the valuation gap over the next decade.”
| Bank | CEO and tenure | Cultural assessment | Key risk | Turnaround upside |
|---|---|---|---|---|
| CBA | Matt Comyn (since 2018) | Best-in-class execution and risk culture | Already priced for quality | Low |
| Westpac | Peter King (since 2020) | Repair and turnaround; improving but under scrutiny | AUSTRAC legacy, operational risk | Medium-High |
| NAB | Ross McEwan (since 2019) | Steady, business-bank-centric; fewer recent missteps | Lacks CBA’s technology advantage | Low-Medium |
| ANZ | Nuno Matos | Active transformation; “reset then outperform” | Execution slippage | Medium-High |
CBA under Matt Comyn has been widely assessed as having executed the most credible cultural reset post-Royal Commission, with AFR and Morningstar commentary through 2024-2025 citing its technology platform and disciplined risk culture. The premium multiple reflects that perception. NAB under Ross McEwan is described as steady and relationship-focused, particularly in SME and business banking, with no high-profile misconduct since 2024. ANZ’s recent half-year result showed ROE improvement to approximately 10-11% from a prior 6-7% range, signalling meaningful operational progress under its current leadership.
The core investor question for the sector: can Westpac and ANZ close the execution and culture gap enough to justify their valuation discounts versus CBA, or will the gap persist?
Culture is not a soft metric. It shows up in remediation costs, regulatory capital requirements, customer retention, and the quality of revenue growth. For a ten-plus year holding period, management execution matters more than the current-year earnings delta.
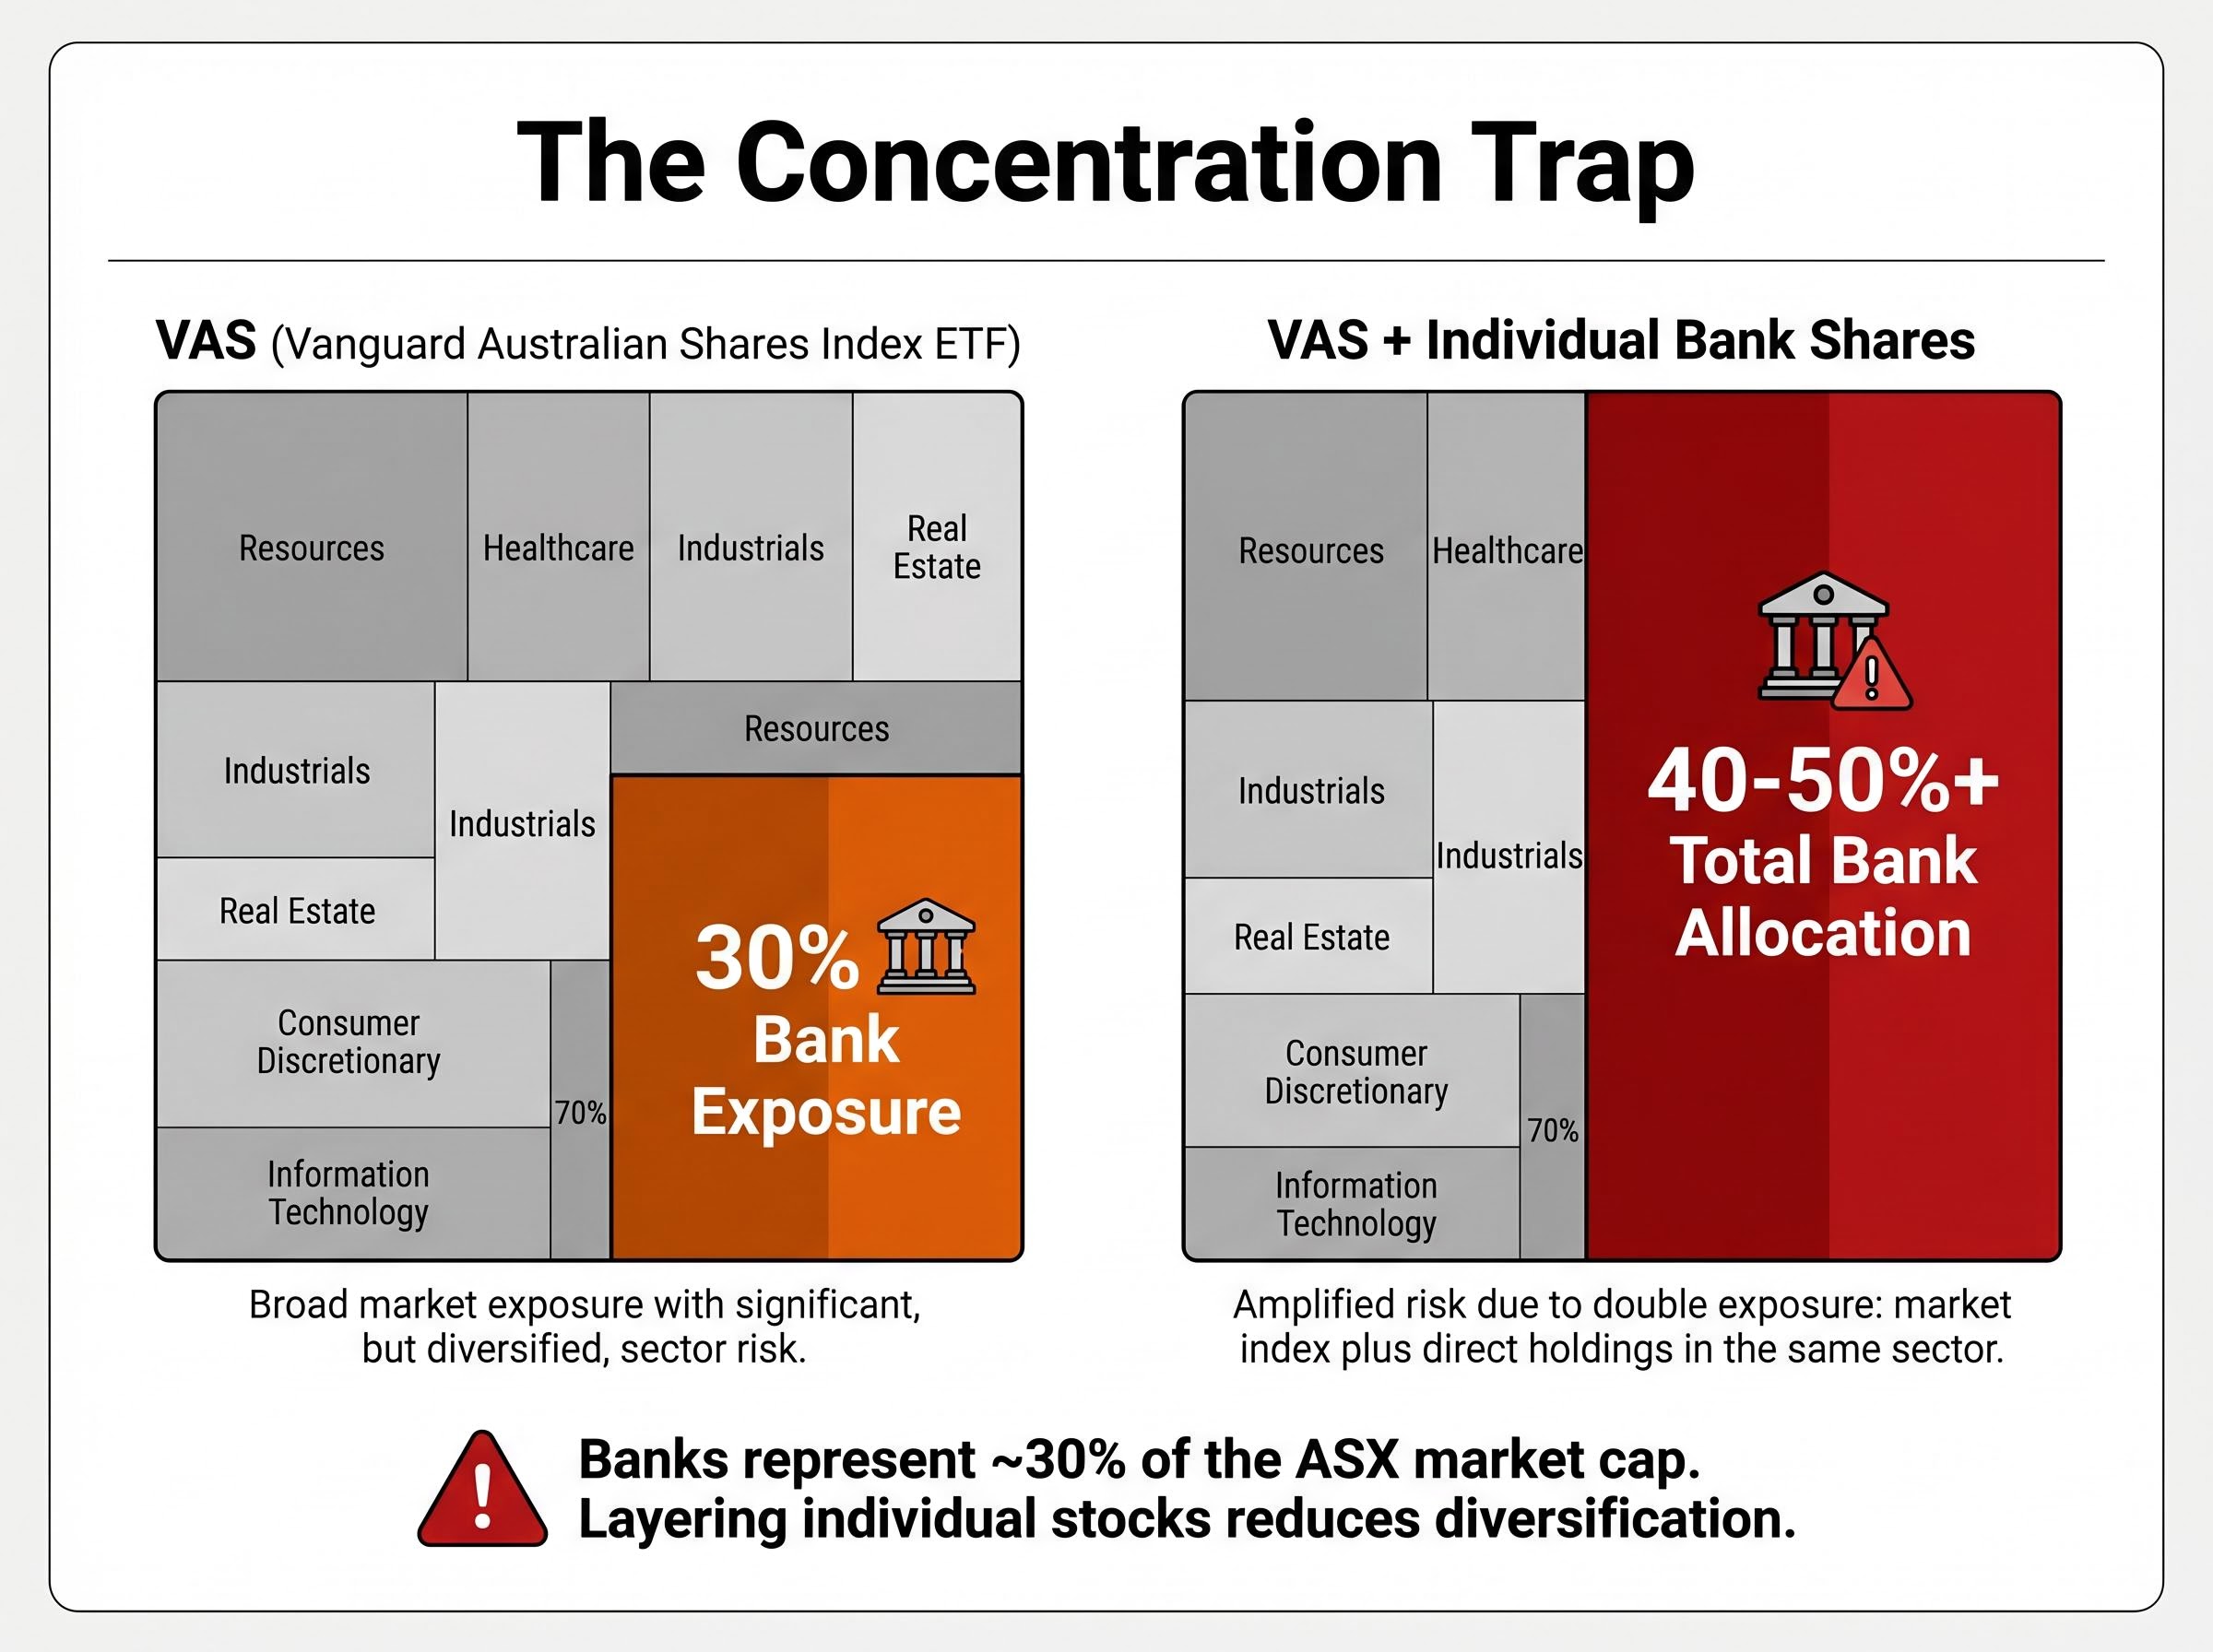
Banks represent approximately 30% of ASX market capitalisation. An investor holding VAS (Vanguard Australian Shares Index ETF) or any broad Australian index product is already running a significant bank position before buying a single bank share.
That creates a three-way risk convergence in any portfolio with additional bank stock positions:
APRA’s System Risk Outlook from November 2025 specifically identifies high household debt and housing price sensitivity as systemic vulnerabilities in the Australian financial system, providing the regulatory basis for treating concentrated bank exposure as a structural portfolio risk rather than a cyclical one.
Bank dividends, while attractive for their franking credits, are not guaranteed. They were cut during COVID, and APRA retains powers to limit payout ratios in stress scenarios. Income investors relying on bank dividends carry simultaneous capital and income risk in a downturn.
The layering problem is straightforward. VAS at roughly 30% bank exposure plus individual bank positions can push total bank allocation well above 40-50% of a domestic equity portfolio without the investor noticing. Setting an explicit maximum bank allocation, as a portfolio-construction discipline rather than a market call, is one of the simplest risk-management steps available to Australian retail investors.
Investors who want to understand exactly how index construction mechanics translate VAS’s 30% bank weighting into their total portfolio exposure will find our full explainer on cap-weighted versus equal-weighted ETFs useful, covering how the top 10 ASX 200 companies account for 48.6% of the index in May 2026 and why equal-weight alternatives like MVW produce structurally different sector tilts that affect bank concentration in ways the fund name alone does not signal.
The question of individual bank shares versus a broad ETF is not philosophical. It is a function of two conditions: whether genuine valuation dispersion exists between the banks, and whether the investor has the willingness and capacity to actively monitor qualitative changes in NIM, culture, and regulation.
A three-step decision framework applies:
Owning a bank-heavy ETF and then adding individual bank shares does not diversify a portfolio. It concentrates it further.
The stock selection odds on the ASX are structurally more difficult than most retail investors assume; a Morningstar Australia analysis found that only 36% of the 210 largest ASX companies outperformed the ASX 300 index over 15 years, with just 10 stocks generating 56% of all wealth created, a distribution that reinforces why the decision to tilt toward individual bank shares rather than index exposure needs to rest on genuine qualitative edge rather than familiarity or yield-chasing.
PE ratios and DDM models are starting points, not conclusions. The qualitative layer, NIM trajectory, regulatory environment, culture, and concentration, is where long-term returns are actually made or lost.
The practical takeaway for each factor is specific. NIM is structurally capped, so do not extrapolate rate-cycle gains. Regulatory direction is toward fee compression, so stress-test non-interest income assumptions. Culture and management execution are measurable through cost-to-income trends, remediation history, and APRA scrutiny levels. Concentration in the ASX already skews most portfolios toward bank risk before a single individual bank share is purchased.
The investor posture that follows is binary. Either commit to ongoing qualitative monitoring of the banks held in a portfolio, or own the index and accept the diversified exposure it provides. Defaulting to individual bank picks without the analytical work this framework describes is the most common and least-discussed source of uncompensated risk in Australian retail portfolios.
This article is for informational purposes only and should not be considered financial advice. Investors should conduct their own research and consult with financial professionals before making investment decisions. Past performance does not guarantee future results.
Net interest margin (NIM) is the difference between the interest income a bank earns on loans and the interest it pays on deposits, expressed as a percentage of earning assets. It is one of the most important drivers of bank profitability, and after expanding sharply during the 2022-2023 rate-hike cycle, NIMs across the big four have largely stabilised or face modest compression.
Beyond price-to-earnings ratios, investors should assess each bank's NIM trajectory, regulatory and remediation exposure, management execution quality, and cultural progress since the Hayne Royal Commission. CBA trades at a premium reflecting its technology platform and risk culture, while Westpac and ANZ carry higher turnaround upside at lower valuations.
The main regulatory pressures on big four earnings include the structural decline in wealth and advice fee income following the Hayne Royal Commission, RBA interchange fee caps on merchant acquiring revenue, and the Consumer Data Right expansion which increases customer switching and compresses cross-sell economics. The Financial Accountability Regime also limits how aggressively banks can design complex fee-based products.
Yes. VAS already allocates roughly 30% of its weight to the big four banks, so adding individual bank share positions on top can push total bank exposure well above 40-50% of a domestic equity portfolio, creating concentrated exposure to Australian housing, regulatory intervention, and credit cycle risk without the investor necessarily realising it.
A broad ETF is the better choice when an investor lacks the time or willingness to monitor ongoing qualitative changes such as APRA actions, NIM disclosures, management shifts, and regulatory developments. VAS provides diversified franked dividend income from the sector without the idiosyncratic risk of holding individual bank positions.