
Bank of Queensland earned $4.70 in profit for every $100 of shareholder equity in FY24. Commonwealth Bank of Australia earned $14.30. Both are regulated Australian banks. Both hold similar capital ratios under the same prudential framework. The gap between those two numbers, and what it signals about each institution’s commercial engine, is what bank valuation metrics exist to diagnose.
Three metrics sit at the core of that diagnosis: net interest margin (NIM), return on equity (ROE), and Common Equity Tier 1 (CET1) capital adequacy. These are not abstract accounting constructs. They describe how efficiently a bank converts its funding advantage into profit, how well it rewards shareholders for the capital they provide, and how much buffer it holds against potential losses. For investors comparing ASX-listed banks, understanding what each metric measures, and what a persistent gap between peers actually signals, is the foundation that makes everything else legible.
This article explains each metric from the ground up, shows how they interact to produce BOQ’s current profitability profile relative to the major banks, and provides a reusable framework for evaluating any bank stock on the ASX.
Why net interest margin is the heartbeat of bank profitability
Net interest margin measures the spread between what a bank earns on its loans and what it pays for the deposits and wholesale funding that finance those loans. It is expressed as a percentage of the bank’s total interest-earning assets.
The formula has three components:
- Interest income earned on loans and other interest-bearing assets
- Interest expense paid on deposits and wholesale borrowings
- Average interest-earning assets over the period
For Australian banks, NIM is the dominant profitability driver. Lending income accounted for 93% of BOQ’s total revenue in its most recent full year. When NIM compresses, almost everything else in the profit and loss statement comes under pressure.
The widest gap in the dataset: CBA’s NIM of 1.97% versus BOQ’s 1.56%, a spread of 41 basis points, illustrates the commercial distance between the strongest major and the weakest regional.
That gap is not random. The major banks hold large at-call and transaction deposit bases, which are far cheaper to service than the term deposits and wholesale funding that regional banks rely on. Scale compounds the advantage: a larger balance sheet means pricing power in lending markets and lower per-dollar funding costs.
Wholesale funding composition adds another dimension to the NIM picture: ANZ carries approximately 30% wholesale funding exposure compared with CBA at 26%, meaning rate cycle sensitivity varies materially across the major banks even when their reported NIMs appear close, a dynamic that becomes relevant when assessing whether a regional bank’s funding disadvantage is structural or cyclical.
| Institution | Type | NIM (FY24) | Reporting Period End |
|---|---|---|---|
| CBA | Major | 1.97% | 30 Jun 2024 |
| Westpac | Major | 1.78% | 30 Sep 2024 |
| NAB | Major | 1.71% | 30 Sep 2024 |
| ANZ | Major | 1.63% | 30 Sep 2024 |
| Bendigo | Regional | 1.86% | 30 Jun 2024 |
| Suncorp Bank* | Regional | 1.84% | 30 Jun 2024 |
| BOQ | Regional | 1.56% | 31 Aug 2024 |
*Suncorp Bank acquired by ANZ on 31 July 2024; FY24 metrics reflect the pre-acquisition period only.
NIM is the single number that most reliably signals a bank’s capacity to grow earnings over time. A persistent gap of 20-plus basis points below the major bank average means a regional bank must either grow its loan book faster or cut costs harder just to hold earnings steady.
RBA research on interest rates and bank profitability has identified that larger institutions tend to respond differently to rate cycle shifts than smaller banks, a finding consistent with the structural NIM gap observed between the major banks and regional peers such as BOQ across multiple rate environments.
When big ASX news breaks, our subscribers know first
What return on equity reveals about capital efficiency
Return on equity measures how much profit a bank generates for every dollar of equity its shareholders have contributed. The calculation has two steps:
- Net profit after tax (the numerator)
- Divided by average shareholders’ equity (the denominator)
The resulting percentage tells investors whether the capital locked inside the business is producing adequate returns. For banks specifically, ROE is the primary lens through which institutional investors assess whether a stock justifies trading at a premium or discount to its book value.
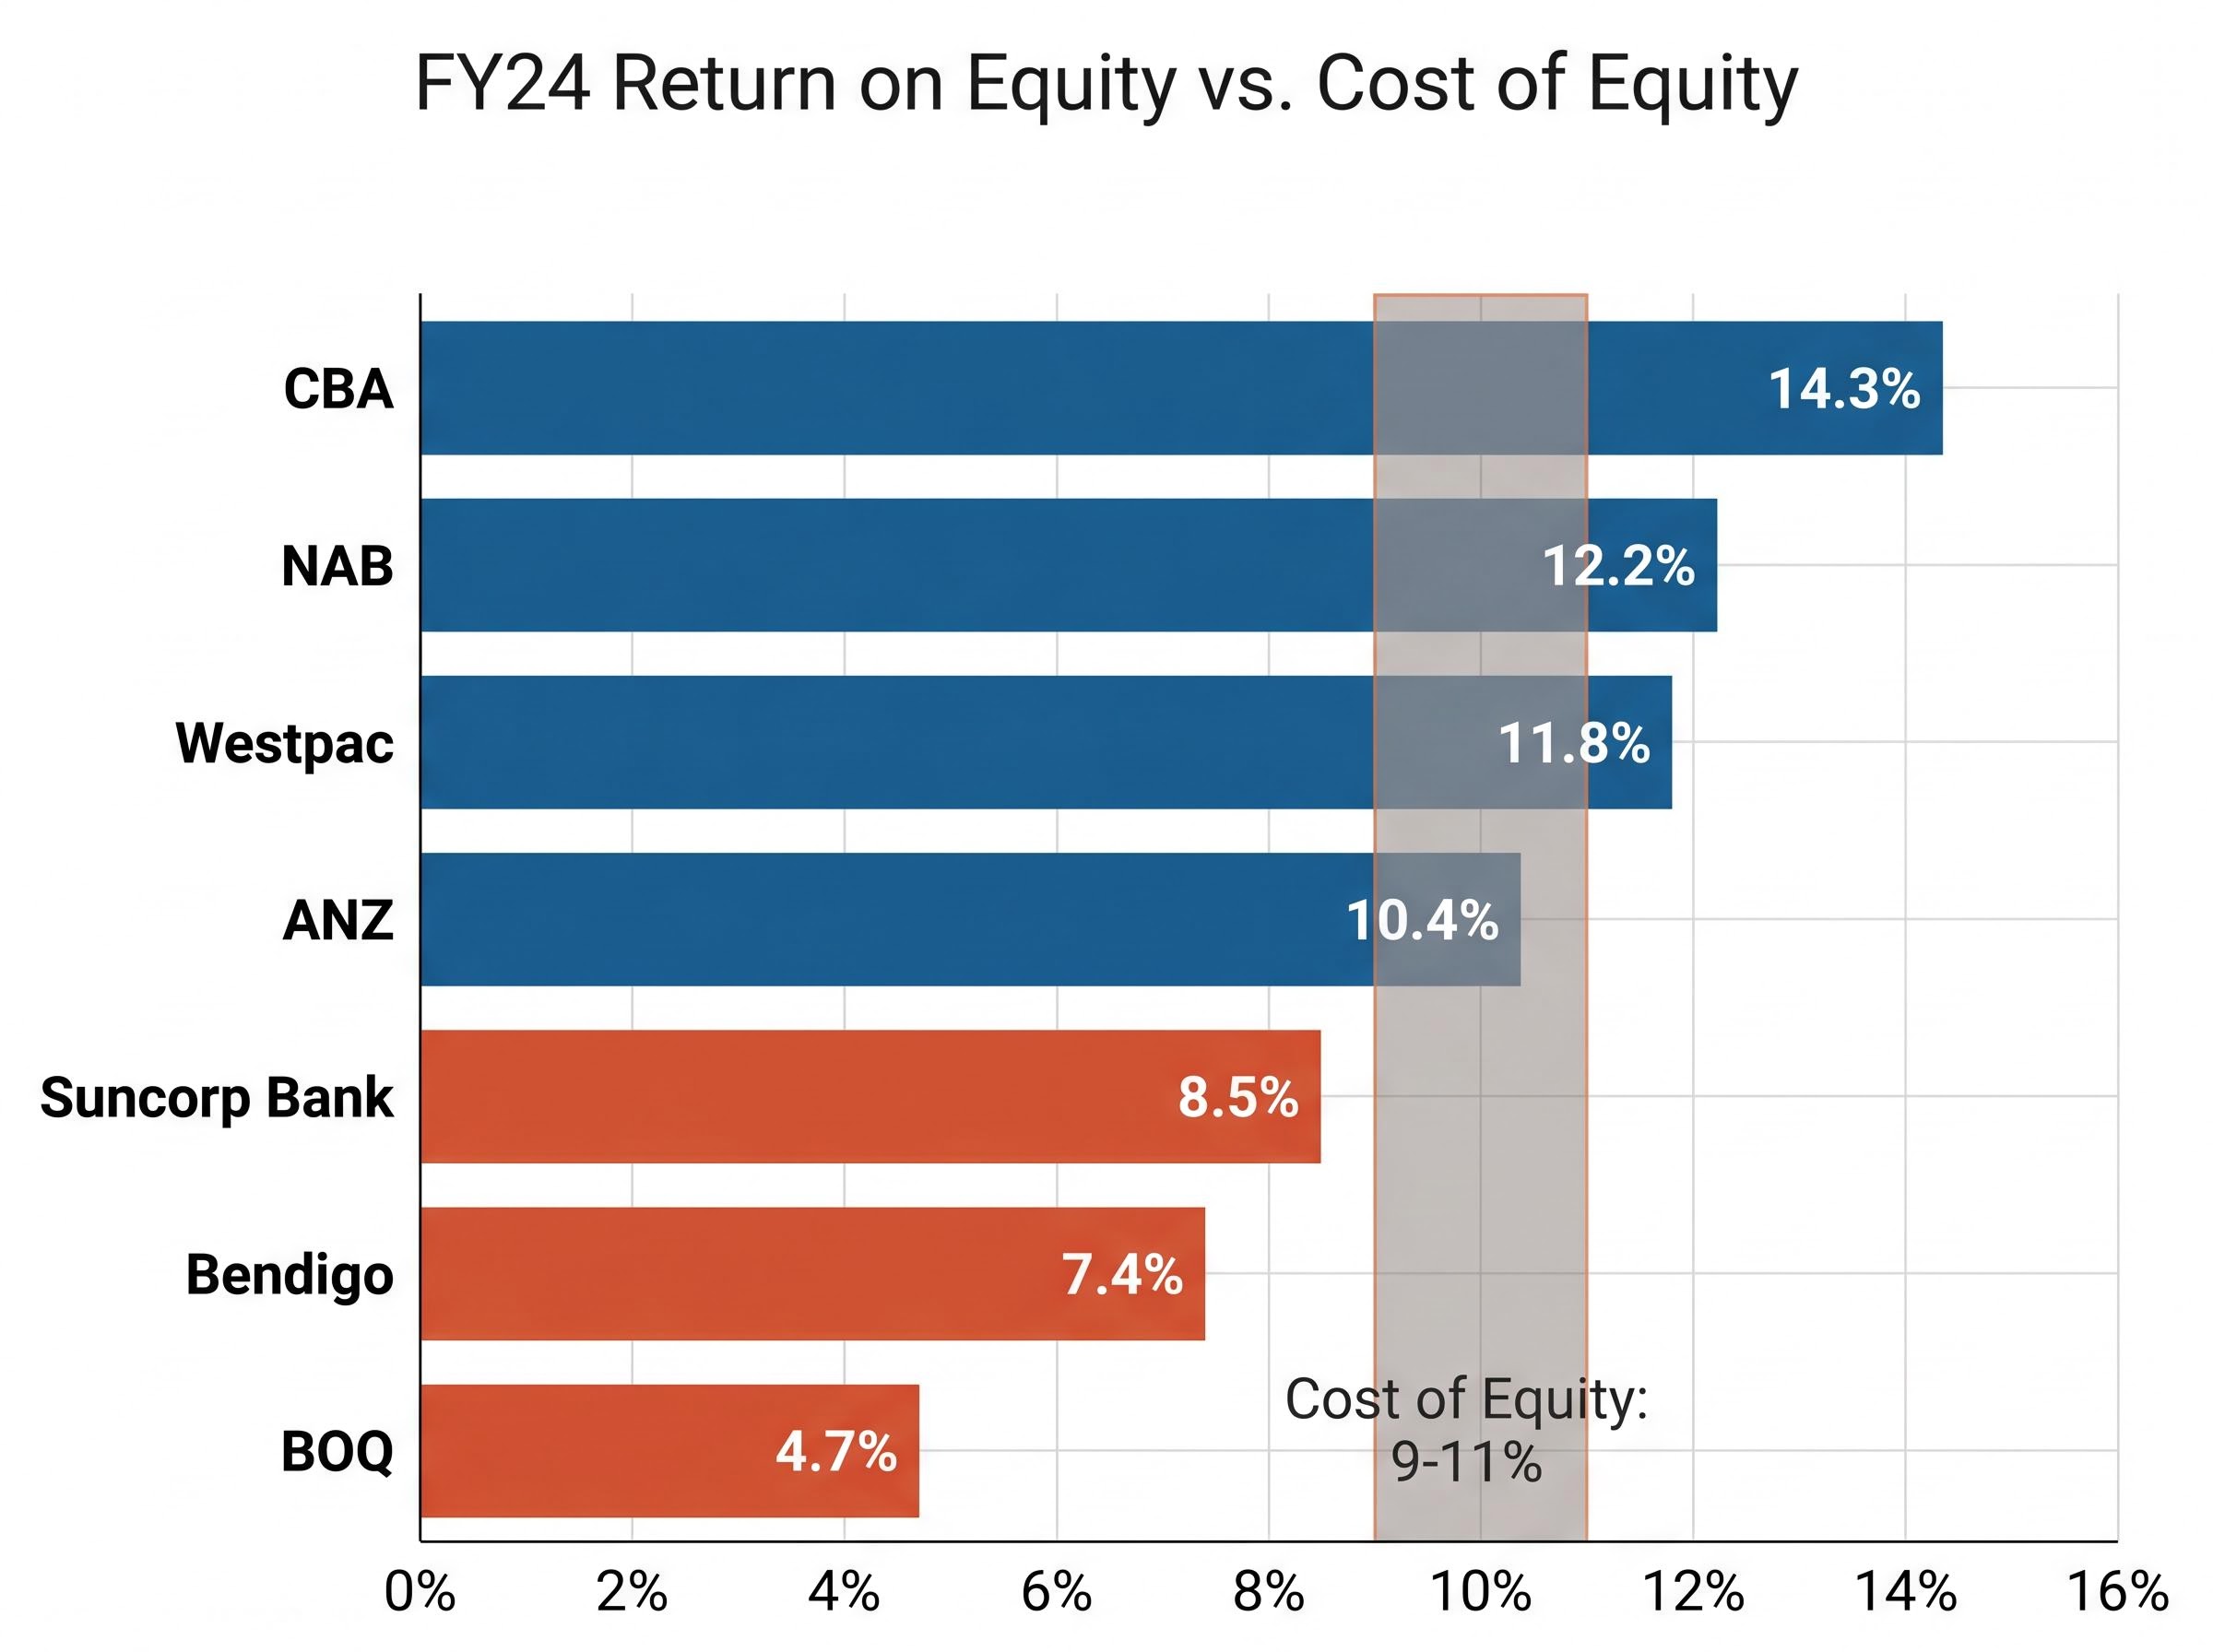
BOQ’s statutory ROE of 4.7% in FY24 sits less than half the sector average of 9.35%. CBA, at the other end, delivered 14.3%, a gap of 9.6 percentage points on the same metric.
The major bank range reinforces the scale of the gap. NAB reported cash ROE of 12.2%, Westpac at 11.8%, and ANZ at 10.4%. Bendigo, the strongest active regional peer, reported an underlying cash ROE of 7.4%. Even with definitional variation (some banks report statutory ROE, others cash ROE), the ordering is consistent.
Major bank results interpretation is complicated by the gap between statutory and cash ROE definitions, as NAB’s 1H26 ex-notable items cash ROE of 11.6% and NIM expansion of 3 basis points both pointed to operational improvement even as the share price fell nearly 3% on results day, illustrating how the same three metrics can produce different verdicts depending on which earnings basis is applied.
When ROE falls below the cost of equity
The cost of equity is the minimum return investors require to hold a bank stock rather than a risk-free alternative. Most analysts estimate the cost of equity for Australian banks at 9-11%.
BOQ’s ROE of 4.7% sits materially below that threshold. In accounting terms, a bank earning less than its cost of equity is destroying value even while paying dividends. The market’s response is predictable: the stock is priced at a discount to book value until the gap closes.
This does not make the stock uninvestable. It does mean any investment case must include a credible path to ROE improvement, and that path needs to be measured against the three metrics discussed here.
CET1 capital adequacy: the safety buffer that constrains returns
Common Equity Tier 1 (CET1) capital adequacy is the ratio of a bank’s highest-quality capital to its risk-weighted assets. “Highest-quality” in regulatory terms means:
- Ordinary shares (paid-up capital)
- Retained earnings
- Other disclosed reserves that absorb losses without the bank ceasing to operate
APRA’s Prudential Standard APS 110, effective 1 January 2023, embeds the “unquestionably strong” capital objective by requiring CET1 ratios above Basel III minimums for all authorised deposit-taking institutions (ADIs). The Reserve Bank of Australia’s April 2025 Financial Stability Review noted that all Australian banks maintain CET1 ratios well above minimum requirements.
APRA Prudential Standard APS 110 establishes the capital adequacy requirements that all authorised deposit-taking institutions must meet, including the minimum CET1 ratios and capital conservation buffers that underpin the ‘unquestionably strong’ benchmark applied to the Australian banking system.
APRA’s “unquestionably strong” framework requires both major and regional banks to hold CET1 ratios above baseline minimums, ensuring the Australian banking system maintains resilience against stress scenarios.
BOQ reported a CET1 ratio of 10.7% at 31 August 2024. The major bank range: CBA at 12.4%, NAB at 12.5%, Westpac at 12.3%, and ANZ at 13.4%, giving a Big Four indicative average of approximately 12.7%. Bendigo reported 10.2%, and Suncorp Bank (pre-acquisition) sat at 10.8%.
How the same capital rule hits regionals harder
APRA’s APS 110 applies to all ADIs. Regional banks cannot, however, spread fixed compliance, technology, and operational costs across the same asset base as the majors. The result is a structural compression: regional banks face a similar capital denominator constraint with a weaker earnings numerator.
CET1 tells investors two things simultaneously. First, how safe the bank is in a stress scenario. Second, how much capital is sitting in the denominator suppressing ROE. A regional bank with a CET1 ratio close to the major bank average but less than half the ROE is a bank where capital is not working hard enough for shareholders.
How NIM, ROE, and CET1 interact to produce BOQ’s profitability profile
The three metrics are not independent gauges. They form a linked system where weakness in one feeds weakness in the others. BOQ’s profile makes the mechanism visible.
The compounding works in three steps:
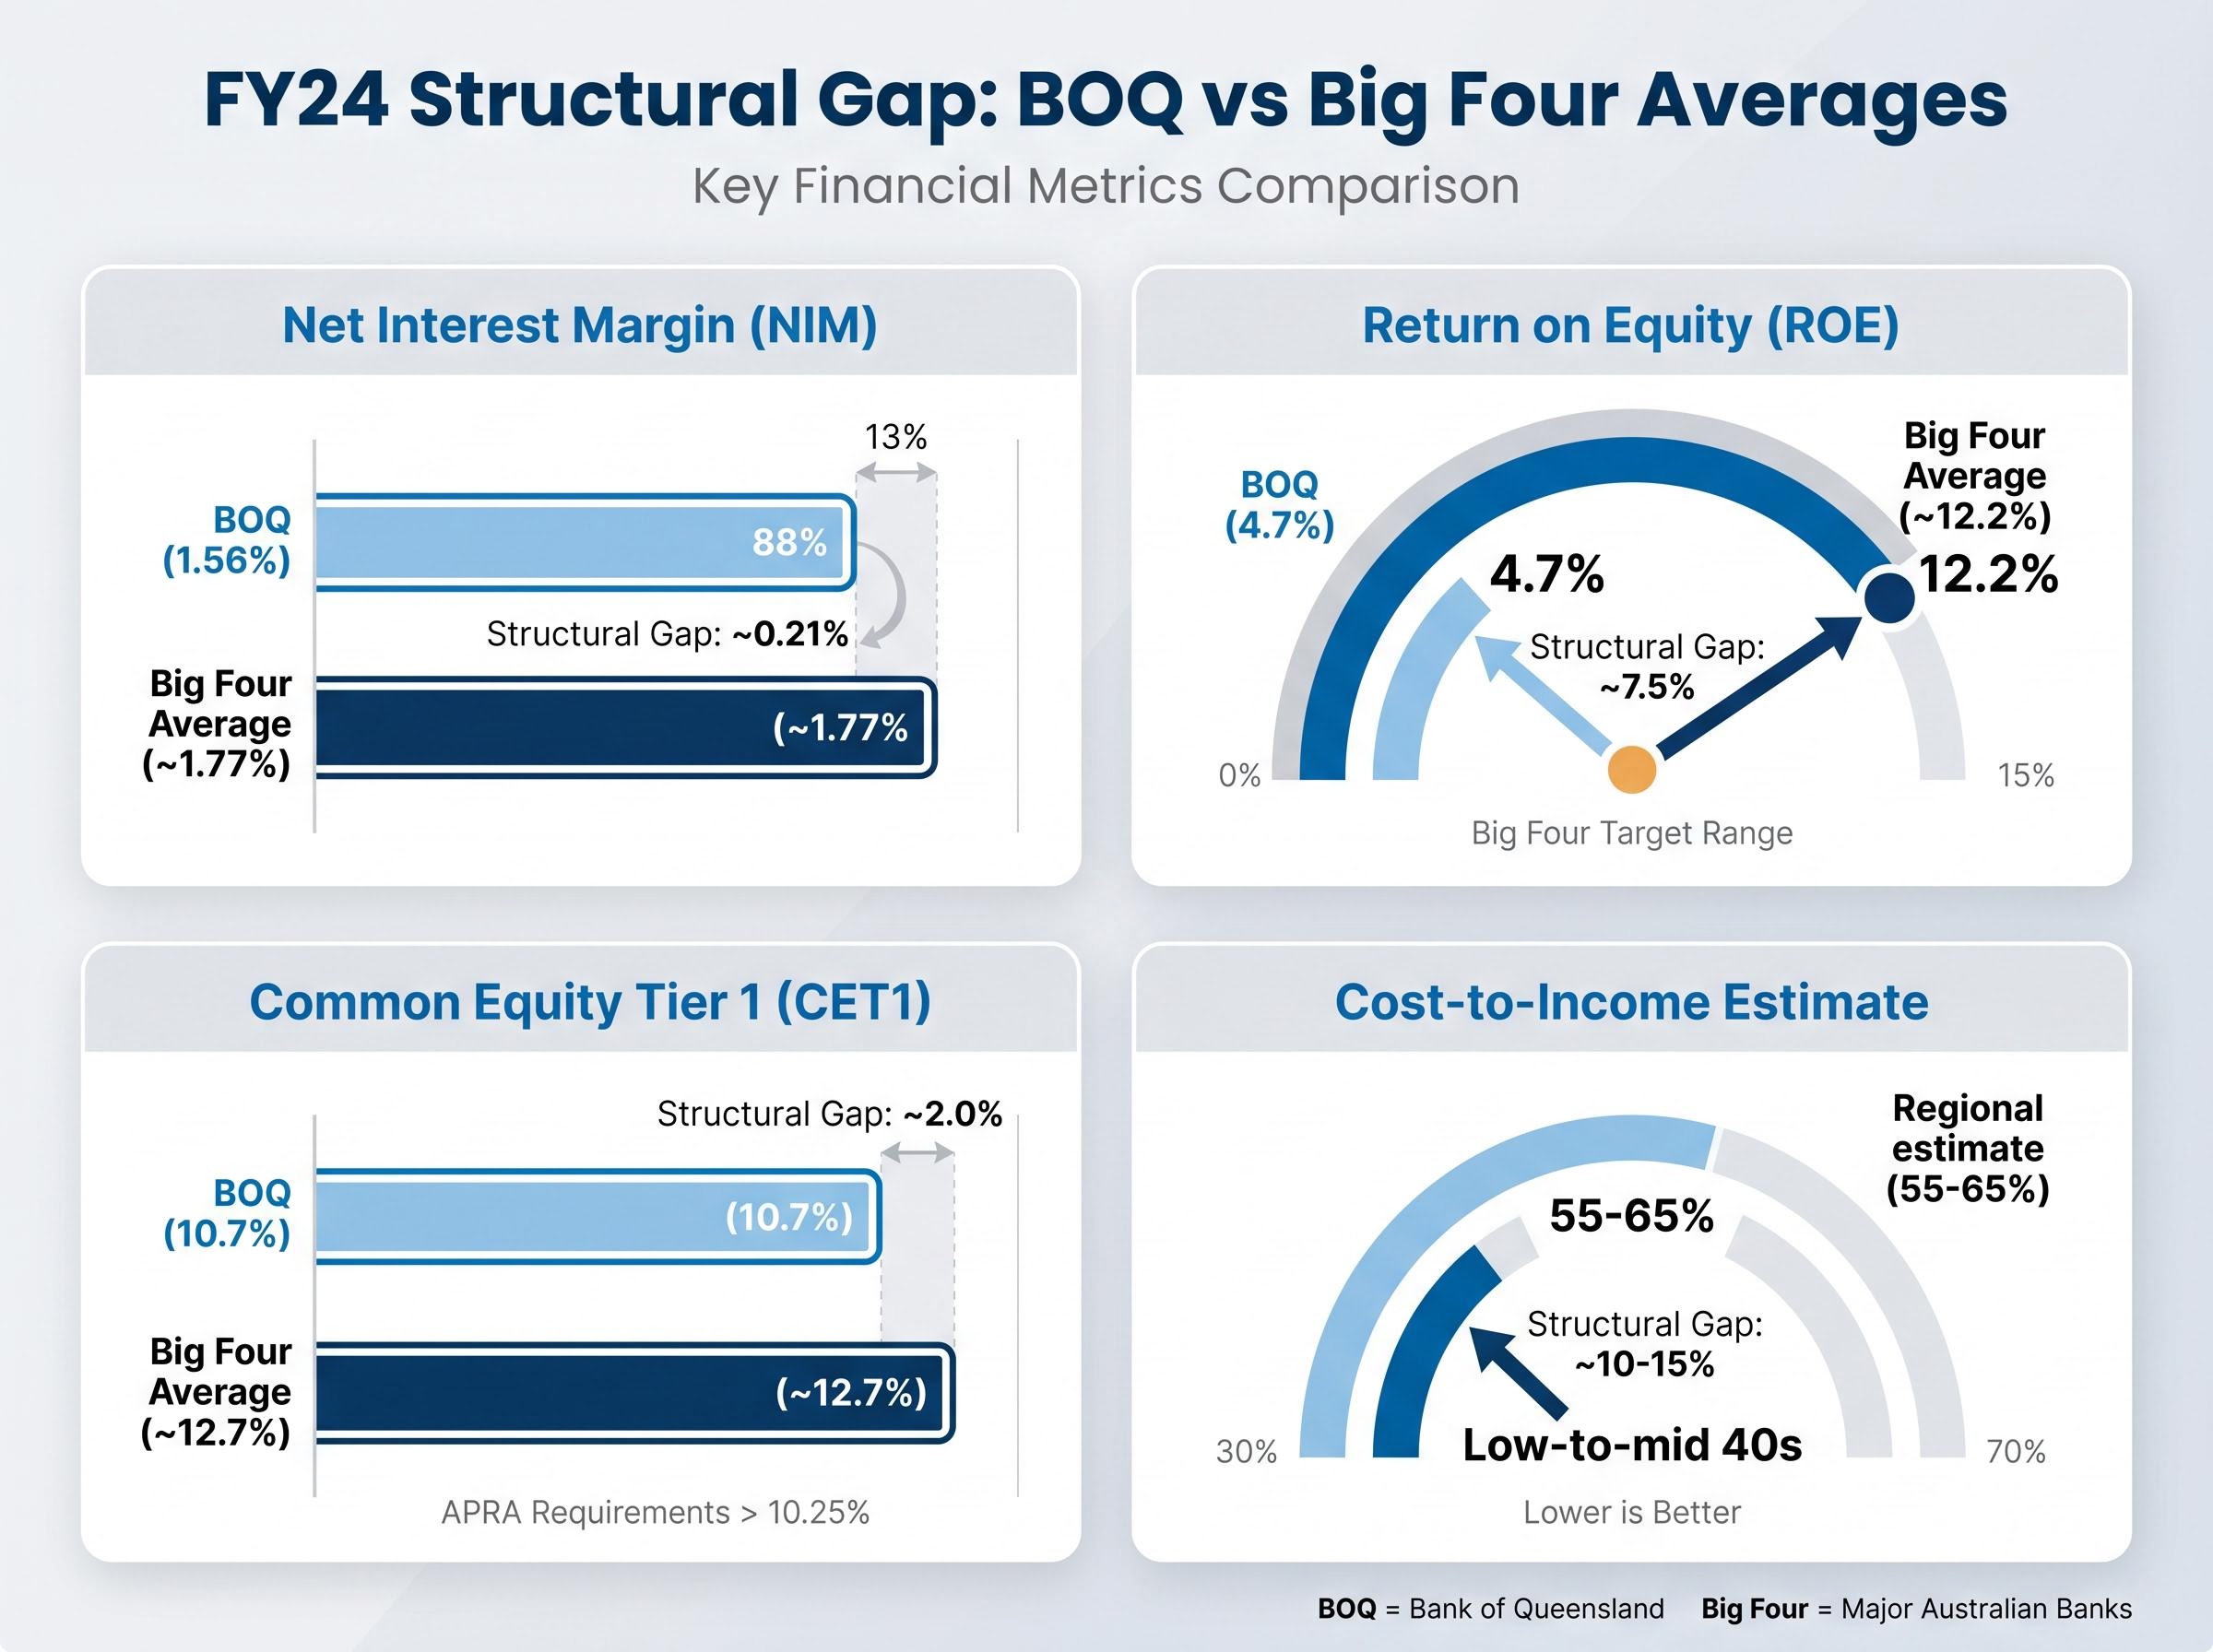
- NIM compression reduces net interest income. BOQ’s 1.56% NIM versus the Big Four average of approximately 1.77% means fewer dollars of revenue per dollar of lending asset.
- A high cost-to-income ratio erodes what remains. Macquarie Equities Research estimates regional cost-to-income ratios in the 55-65% range, versus the major bank low-to-mid 40s. Fixed technology, compliance, and operational costs consume a larger share of already-compressed revenue.
- Weaker earnings divided by a similar capital base produces depressed ROE. BOQ’s 4.7% ROE sits against a CET1 of 10.7%, while CBA’s 14.3% ROE sits against a CET1 of 12.4%. The major banks hold more capital in absolute terms and still generate triple the return.
| Metric | BOQ (FY24) | Big Four Average (FY24) | Cost-to-Income Range |
|---|---|---|---|
| NIM | 1.56% | ~1.77% | 55-65% (regional est.) |
| ROE | 4.7% | ~12.2% | Low-to-mid 40s (major est.) |
| CET1 | 10.7% | ~12.7% | n/a |
Cost-to-income estimates sourced from Macquarie Equities Research; these figures have not been independently verified.
BOQ’s transformation programme targets approximately $80-100 million in cost reductions over three years, an attempt to interrupt the compounding dynamic. Execution risk remains high, and the structural funding disadvantage on NIM cannot be cost-cut away. The dividend payout ratio of approximately 79% on a 4.7% ROE leaves limited retained earnings for organic capital growth, further constraining the path to recovery.
When all three metrics trail the sector simultaneously, the signal is not just that the bank is performing below average today. It is that the forces producing that underperformance are self-reinforcing.
What these metrics look like across the broader regional bank peer group
Is BOQ an outlier within the regional tier, or does the structural disadvantage apply to the entire group?
Bendigo and Adelaide Bank reported a NIM of 1.86%, underlying cash ROE of 7.4%, and CET1 of 10.2% for FY24 (year ended 30 June 2024). It outperforms BOQ on both margin and returns while carrying a lower CET1 ratio.
Suncorp Bank reported a NIM of 1.84%, segment ROE of 8.5%, and CET1 of 10.8% for FY24. These figures are presented for reference only; ANZ completed its acquisition of Suncorp Bank on 31 July 2024, and the entity no longer operates independently.
| Regional Bank | NIM (FY24) | ROE (FY24) | CET1 (FY24) |
|---|---|---|---|
| Bendigo | 1.86% | 7.4% (underlying cash) | 10.2% |
| Suncorp Bank* | 1.84% | 8.5% (segment) | 10.8% |
| BOQ | 1.56% | 4.7% (statutory) | 10.7% |
*Pre-acquisition period only; Suncorp Bank no longer operates as an independent entity.
BOQ sits at the bottom of the regional group across all three metrics. Analyst commentary from Morningstar, Macquarie, and Bell Potter has identified both BOQ and Bendigo as most exposed to structural profitability pressures, though the severity differs between the two.
Bendigo’s underlying cash ROE of 7.4% still trails ANZ’s 10.4%, the lowest ROE in the major bank group. Even the stronger regional performer cannot close the gap to the major bank floor.
Understanding where a stock sits within its own peer tier, not just against the majors, is what separates a measured assessment from a headline comparison. BOQ at the bottom of the regional group is a different risk profile from BOQ as simply a below-average bank.
The next major ASX story will hit our subscribers first
Applying the three-metric framework to any ASX bank stock
The framework used to diagnose BOQ’s profitability profile is not company-specific. Any investor evaluating an ASX bank stock can apply the same sequence:
- Check NIM first for earnings quality. Is the bank’s margin above, at, or below its peer group average? A persistent gap signals a structural funding or scale disadvantage.
- Check ROE second relative to the cost of equity. A bank earning below 9-11% ROE is, in analytical terms, not generating sufficient returns to justify its capital base at face value.
- Check CET1 third for safety buffer relative to earnings power. A high CET1 ratio paired with a low ROE means capital is not working efficiently.
When low valuation signals structural impairment, not just cheap pricing
A persistent price-to-book discount is the market’s verdict on long-run ROE, not just a short-term sentiment call. A bank trading below book value where ROE already sits below the cost of equity requires a credible path to improvement before the discount is likely to close.
Supplementary checks add further depth:
- Payout ratio sustainability. BOQ’s approximately 79% payout ratio on a 4.7% ROE leaves limited room for dividend growth without earnings recovery. Bendigo’s approximately 70% on 7.4% ROE is similarly constrained, though less acutely.
- Cost-to-income trajectory. Is the ratio declining as transformation benefits materialise, or holding steady?
- Transformation execution risk. For banks in restructuring phases, track half-yearly progress against stated cost-reduction targets.
Dividend discount model (DDM) estimates offer one valuation lens: BOQ’s forecast dividend of approximately $0.35 per share against a share price of approximately $6.35 (as of 22 May 2026) produces an estimated average DDM valuation of approximately $7.40 per share. These estimates are highly sensitive to growth rate and discount rate assumptions, and a high payout ratio on a low ROE limits the dividend growth input.
For investors wanting to build a fully worked model from these inputs, our dedicated guide to DDM valuation for ASX bank stocks uses BOQ’s live share price, the RBA cash rate as the risk-free rate anchor, and a franking-adjusted fair value calculation to walk through each step, including why a two-percentage-point shift in the discount rate moves the output by more than three dollars per share.
The three-metric framework removes opacity from what can appear to be a complex sector. NIM, ROE, and CET1 are the opening screen before any valuation model, and simultaneous below-average readings across all three are a signal that demands structural explanation.
The structural gap is real, but metrics tell you where to look next
NIM, ROE, and CET1, read together, reveal whether a valuation gap reflects cyclical underperformance or structural impairment. For BOQ, the simultaneous underperformance across all three metrics points toward the structural end of that spectrum.
Structural gaps can close. BOQ’s transformation programme, cost discipline, and capital management initiatives are all aimed at improving these numbers. Investors following the story should track half-yearly results against the specific metrics outlined here: NIM trajectory, ROE relative to the cost of equity, and whether the cost-to-income ratio begins to converge toward the major bank range.
For any ASX bank stock, this three-metric framework is the starting point. Treat simultaneous below-average readings across all three as a signal requiring deeper investigation, not as an automatic reason to dismiss or embrace the stock.
PE and DDM approaches for major bank stocks produce very different base estimates when applied to CBA, where a PE-implied fair value of approximately $101 compares with a franking-adjusted DDM estimate of approximately $144, a divergence that reflects the outsized weight of CBA’s premium franchise in discounted income models relative to sector-average earnings multiples.
This article is for informational purposes only and should not be considered financial advice. Investors should conduct their own research and consult with financial professionals before making investment decisions. Past performance does not guarantee future results. Financial projections are subject to market conditions and various risk factors.