How to Read Trading Volume Before Every Trade
2 hrs ago

Bank of Queensland shares closed at $6.35 on 22 May 2026, yet a dividend discount model produces fair value estimates ranging from $7.19 to $10.57 depending on which assumptions an investor selects. That spread is not a flaw in the methodology. It is the methodology working as intended, revealing how sensitive a bank valuation is to three decisions most retail investors make without examining them closely. The dividend discount model (DDM) remains one of the most practical tools for valuing ASX-listed bank stocks, which pay large, predictable, franked dividends. What follows is a complete DDM walkthrough applied to BOQ (ASX: BOQ) as at May 2026, covering every input decision, the franking credit adjustment that can shift an estimate by more than $3 per share, and the assumptions that separate a useful valuation range from a number-generating exercise.
Banks generate most of their value through recurring income streams rather than capital asset appreciation. BOQ derives approximately 93% of total revenue from lending income, which makes cash flow predictability high relative to growth-stage companies where discounted cash flow models depend on speculative terminal values. For a dividend-paying bank, the income stream is the investment thesis.
At $6.35 per share, BOQ’s cash yield alone is approximately 5.4%, with the most recent full-year dividend at $0.34 per share, fully franked. Income is not a secondary consideration for holders of this stock. It is the primary reason capital is allocated here.
The DDM, specifically the Gordon Growth Model, is designed for exactly this kind of security. It works best when three conditions hold:
All three broadly describe the major and mid-tier ASX banks, including BOQ, though the degree to which each condition holds varies and directly affects the model’s reliability.
ASX sectors suited to DDM application share a common structural characteristic: regulatory or business-model constraints that produce predictable, recurring distributions, a feature present in banks, REITs, utilities, and infrastructure companies, and largely absent in technology or early-stage resource stocks where capital appreciation rather than income drives the investment case.
The formula is straightforward:
Fair value = Annual dividend / (Required return minus Dividend growth rate)
Three variables, three decisions. The annual dividend is the income the investor receives. The required return is the minimum rate of return the investor demands to hold the stock. The dividend growth rate is the pace at which that income is expected to grow indefinitely. Every section that follows builds on this formula.
Before selecting any DDM inputs, an honest look at BOQ’s financial position explains why the assumption choices ahead are not arbitrary. This is a bank with metrics that lag both the majors and the sector average, and that context matters.
| Metric | BOQ | Sector Average / Peer Benchmark | What This Signals for DDM Inputs |
|---|---|---|---|
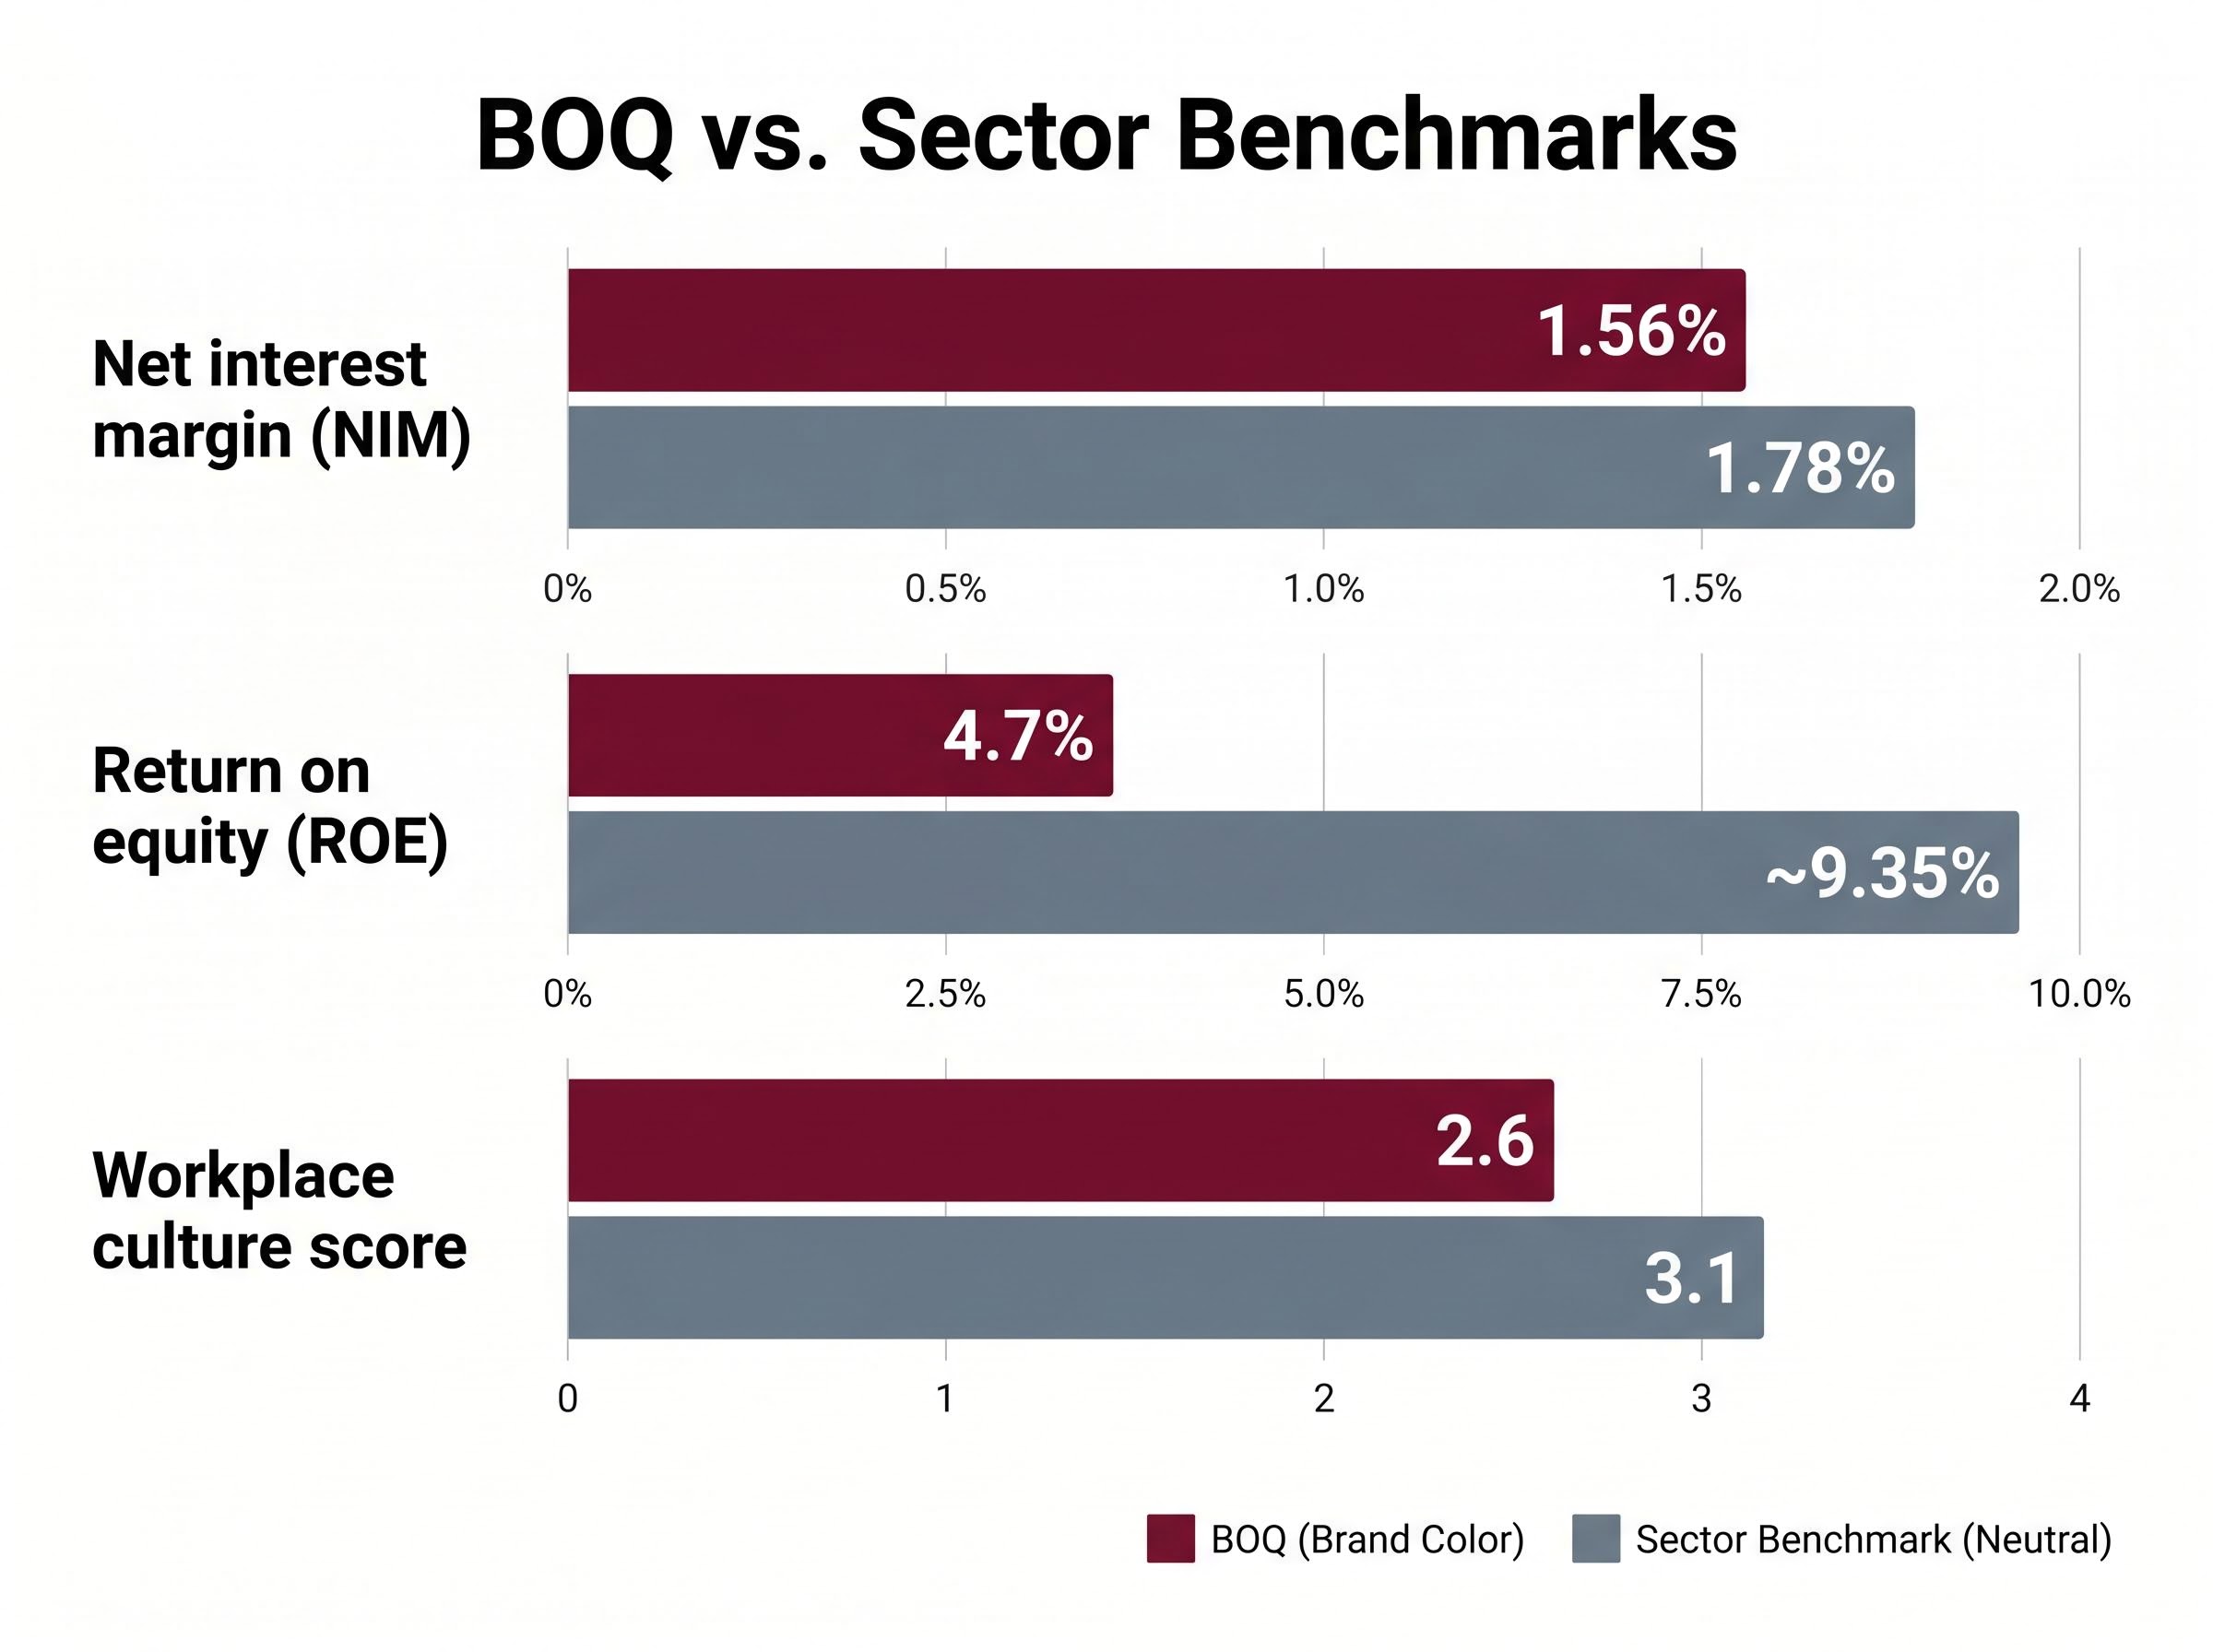
| Net interest margin (NIM) | 1.56% | 1.78% (major bank average) | Lower earnings power constrains dividend growth assumptions |
| Return on equity (ROE) | 4.7% | ~9.35% (sector average) | Sub-par profitability limits sustainable payout growth |
| CET1 capital ratio | ~11.18% (1H26) | Above APRA minimums | Adequate capital, but limited headroom for aggressive payout increases |
| Cash dividend yield | ~5.4% | Varies by peer | Income appeal is high; sustainability depends on earnings trajectory |
BOQ is executing a simplification and capital efficiency programme. The April 2026 whole-of-loan sale of equipment finance assets to Challenger was part of this direction, and CET1 has improved from approximately 10.87% in February 2025 to approximately 11.18% as at the 1H26 results. The trajectory is positive, but the ROE of 4.7% tells a clear story: profitability improvements have not yet materialised at a pace that would support aggressive growth assumptions.
Workplace culture scores sit at 2.6 out of 5 versus a sector benchmark of 3.1, a soft qualitative factor rather than a valuation input, but one that colours the execution risk narrative.
14 analysts set a 12-month consensus target of approximately AUD 6.38, with estimates spanning AUD 5.50 to AUD 7.50.
That consensus range sits well below even the conservative end of most DDM outputs, a point worth returning to later.
Each DDM input is a deliberate choice. Understanding the reasoning behind each one matters more than the number itself.
The dividend. BOQ’s most recent full-year dividend was $0.34 per share, fully franked. A forward estimate of $0.35 per share reflects modest consensus expectations for incremental growth. Even this $0.01 difference shifts the model output, which is why specifying which dividend figure is being used is not a minor detail.
The growth rate. A range of 2% to 4% is applied in this worked example. The lower bound reflects BOQ’s sub-par ROE of 4.7% and compressed NIM of 1.56%, both of which limit the bank’s capacity to grow dividends meaningfully without improving profitability first. The upper bound assumes the simplification programme delivers some margin benefit over time. This range connects directly to the fundamental picture covered above; it is not pulled from thin air.
The required return. Construction follows three steps:
The RBA capital market yields data publishes monthly interpolated yields for Australian government bonds across all maturities, including the 10-year tenor that serves as the standard risk-free rate input for Australian equity valuation models.
A required return range of 6% to 11% is applied in the worked example to capture the uncertainty across these components.
Because the Gordon Growth formula divides by (required return minus growth rate), small changes in either variable produce disproportionately large swings in the estimated value. If the required return is 8% and growth is 3%, the denominator is 5%. Move growth to 4% and the denominator drops to 4%, a 20% reduction in the divisor that amplifies the output significantly. This mathematical sensitivity is the core reason a valuation range is more honest than a point estimate.
Most retail investors who run a DDM on an ASX bank stock use the cash dividend as the input. For BOQ, that means $0.34 per share. The number is correct, but incomplete.
Fully franked dividends carry an attached tax credit based on the 30% corporate tax rate already paid by the company. Australian resident taxpayers can use these credits to offset personal tax liability, which means the total economic value of a fully franked dividend is higher than the cash amount received.
The grossing-up formula makes this explicit:
Grossed-up dividend = Cash dividend / (1 minus corporate tax rate)
Applied to BOQ: $0.34 / (1 minus 0.30) = approximately $0.486 per share.
That is not a marginal adjustment. Substituting the grossed-up figure into the DDM shifts the average valuation estimate materially.
| Dividend Input Used | Average DDM Estimate | Vs Current Price ($6.35) |
|---|---|---|
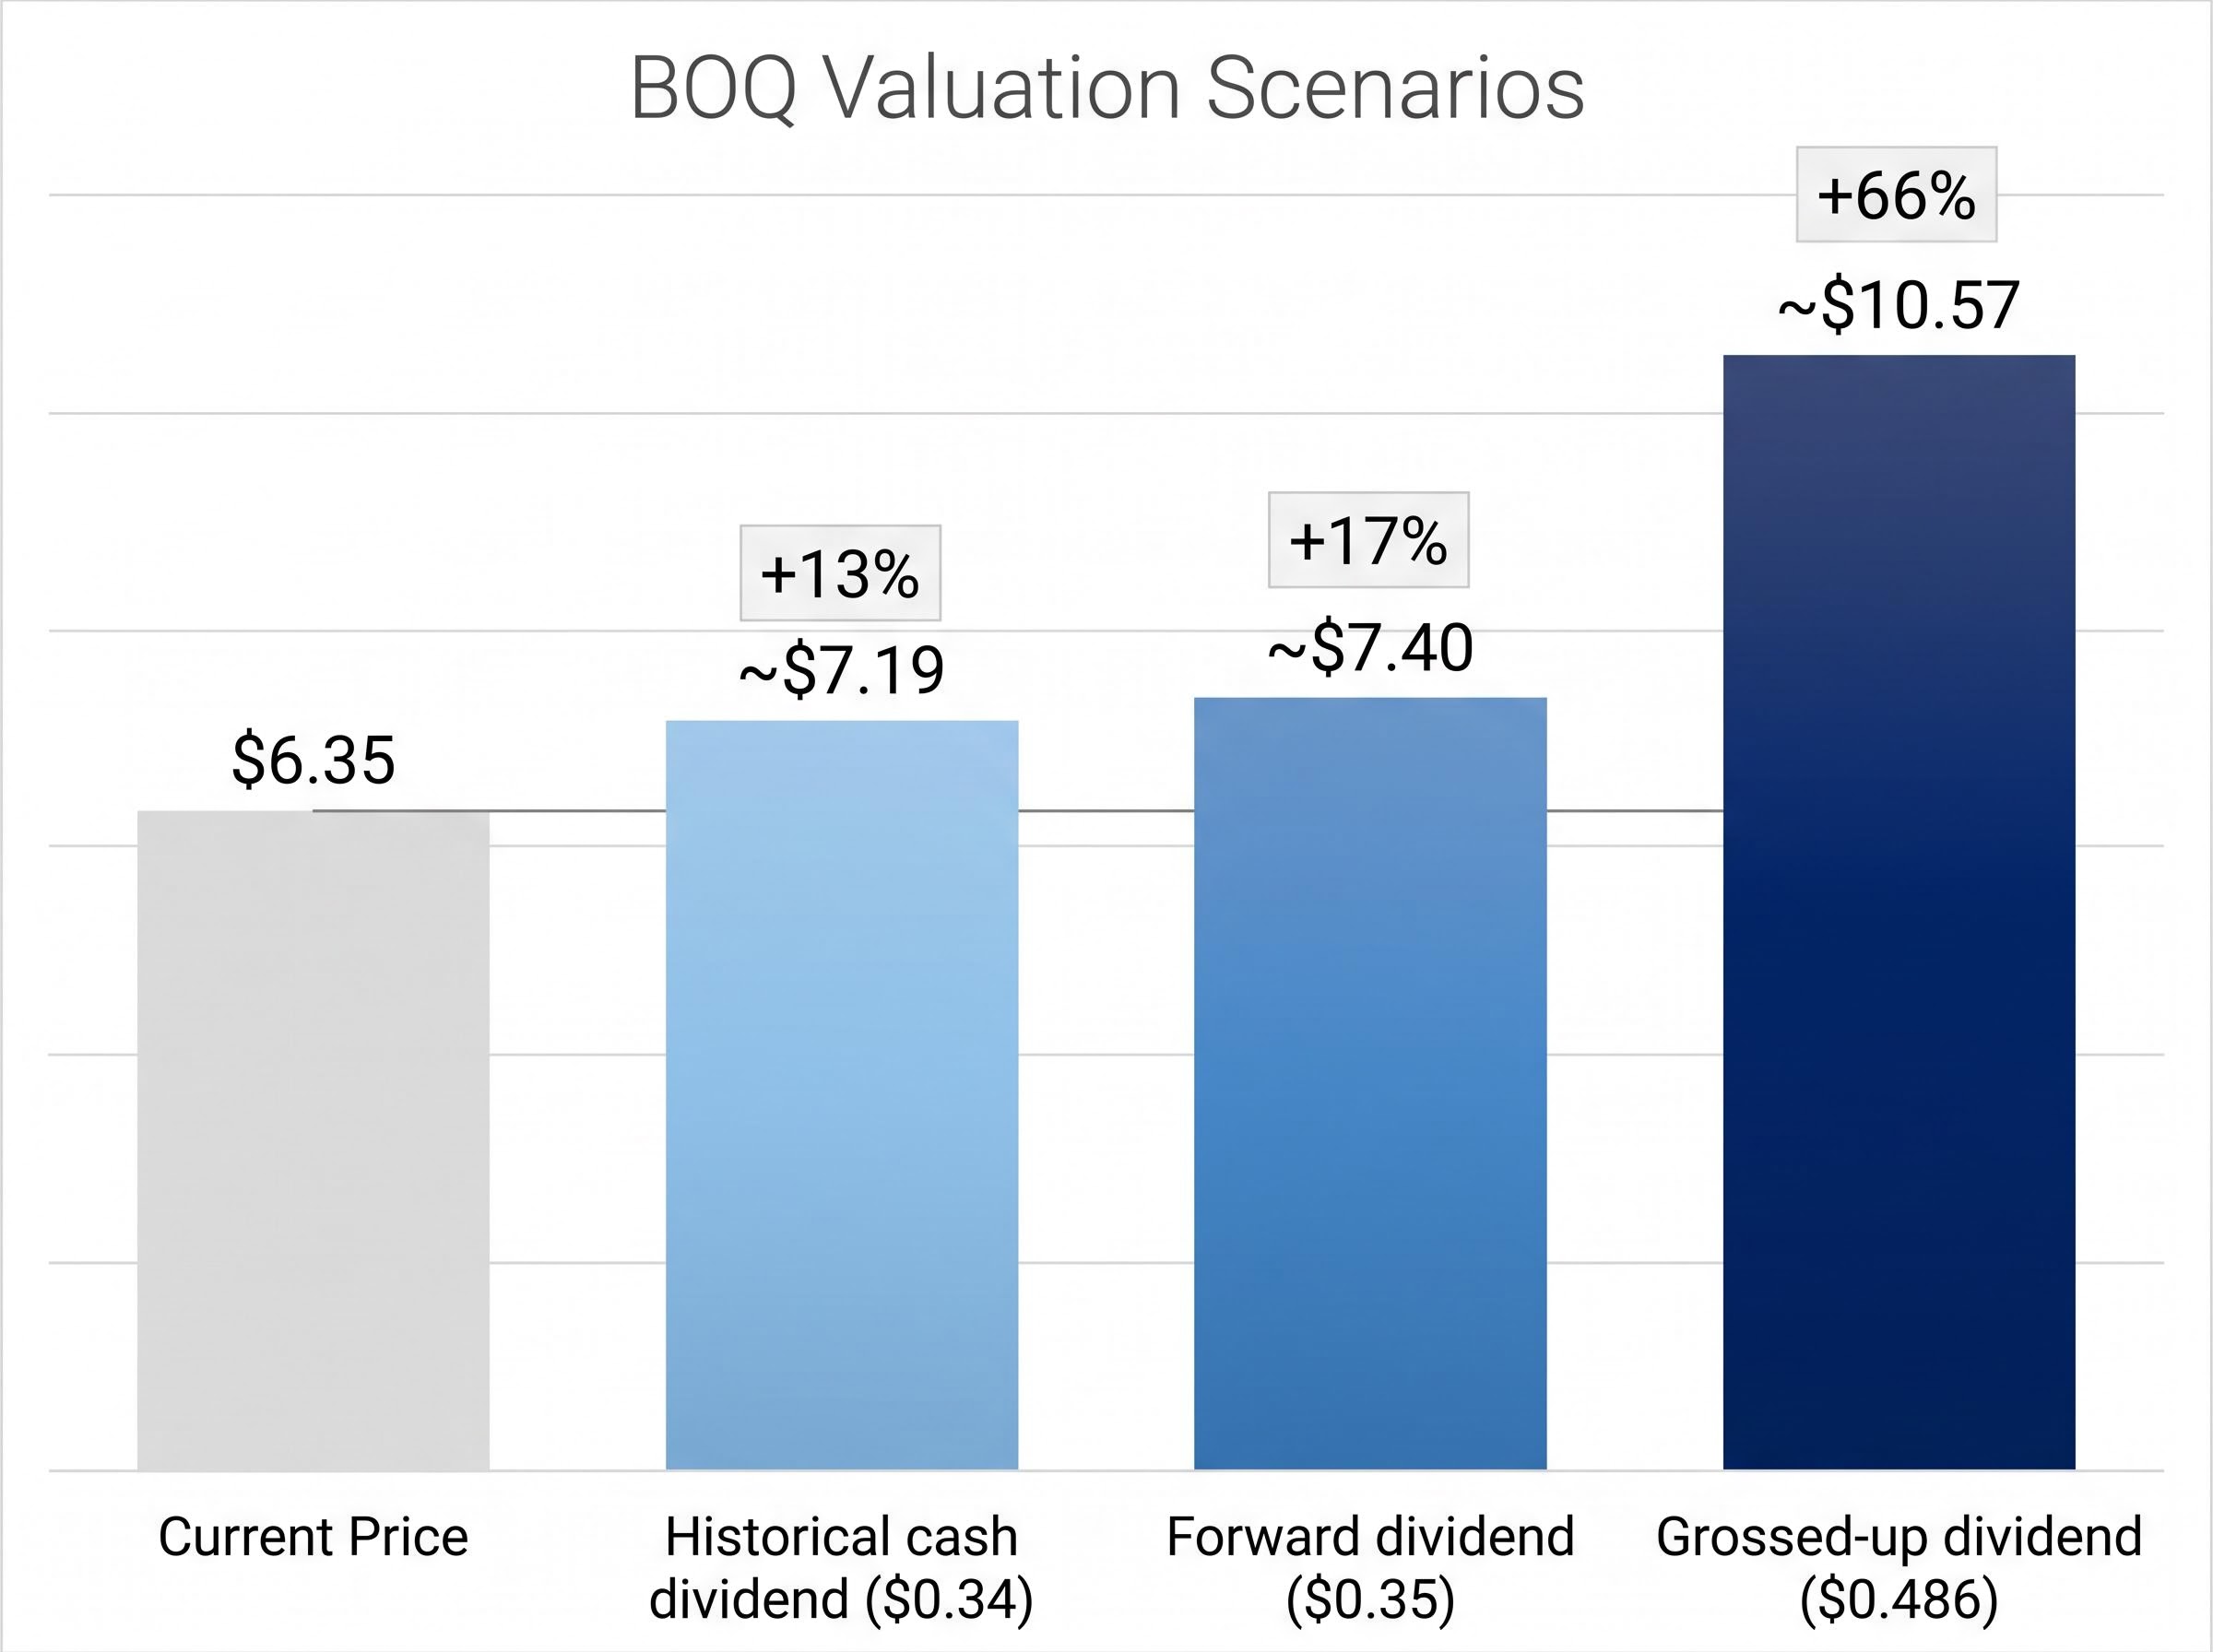
| Historical cash dividend ($0.34) | ~$7.19 | +13% above current price |
| Forward dividend ($0.35) | ~$7.40 | +17% above current price |
| Grossed-up dividend ($0.486) | ~$10.57 | +66% above current price |
A fully franked cash dividend of $0.34 grosses up to approximately $0.486 when franking credits are included, lifting the average DDM fair value estimate from $7.19 to $10.57.
For Australian resident investors in a tax-paying position, ignoring franking credits in a DDM is not a conservative assumption. It is an analytical omission that systematically understates the total return of holding fully franked bank shares relative to other asset classes.
Franking credit refunds for SMSF investors in pension phase represent the most tax-efficient application of fully franked bank dividends on the ASX, because a zero tax rate means the entire imputation credit attached to each distribution can be claimed back from the ATO as a cash payment rather than simply used to offset a personal tax liability.
One qualification applies: the grossed-up valuation is most directly relevant to Australian resident taxpayers who can fully utilise the credits. Non-resident investors and tax-exempt entities should apply the cash dividend only.
The full DDM range across all assumption combinations spans $7.19 (conservative cash dividend, higher discount rate) to $10.57 (grossed-up dividend, lower discount rate). That width is not model weakness. It reflects genuine uncertainty about BOQ’s execution trajectory.
Against a current share price of $6.35, even the most conservative DDM estimate sits 13% above the market price. The analyst consensus target of approximately AUD 6.38, however, arrives at a figure barely above the current quote.
That gap deserves examination. Broker models incorporate more inputs than the simple DDM allows: they can model dividend cuts, payout ratio compression, capital-raising dilution, and scenario-weighted earnings paths. The Gordon Growth Model assumes a stable, perpetually growing dividend, which is a generous assumption for a bank with an ROE of 4.7% and an ongoing turnaround programme.
The DDM’s core limitations in this context are worth stating directly:
The fact that 14 broker analysts, using more sophisticated models with more granular inputs, arrive at a consensus well below even the conservative DDM output suggests the market is pricing in execution risk that the simple DDM does not fully capture. BOQ’s ROE of 4.7% is the fundamental constraint those broker models are likely weighting more heavily.
The PE ratio as a cross-check on DDM outputs adds a useful constraint to the analysis, because when both methods point toward a similar valuation range the convergence carries more analytical weight than either number alone, and when they diverge sharply that gap itself becomes a signal worth investigating before acting on either estimate.
The DDM produces a range, not a price target. Across the assumptions applied in this guide, that range spans $7.19 to $10.57 for BOQ as at May 2026, with the franking credit adjustment representing the single most impactful decision most retail investors are not making.
BOQ’s fundamental position, sub-par ROE, NIM compression, and turnaround-stage execution risk, means the lower end of any DDM range is more defensible than the upper end today. The model’s output should be treated as one input into a broader assessment that also considers the analyst consensus, BOQ’s earnings trajectory, and the investor’s own tax position regarding franking credits.
The next step is to build a personal sensitivity table. Source the current 10-year Australian CGS yield from the RBA, use BOQ’s announced dividend from the most recent results, and run the formula across at least three growth rate scenarios. The discipline is in the process, not the output.
Investors who want to move beyond the DDM output and build a more complete picture of BOQ’s investment case will find our full explainer on qualitative factors in ASX bank valuation, which covers management track record, governance history, loan book quality, and APRA capital requirements, the factors that ASIC research identifies as consistently underweighted by retail investors relative to their actual impact on outcomes.
This article is for informational purposes only and should not be considered financial advice. Investors should conduct their own research and consult with financial professionals before making investment decisions. Past performance does not guarantee future results. Financial projections are subject to market conditions and various risk factors.
A dividend discount model (DDM) estimates the fair value of a stock by dividing the expected annual dividend by the difference between the required return and the dividend growth rate. Applied to BOQ, it produces a fair value range of $7.19 to $10.57 per share depending on the inputs selected.
Fully franked dividends carry attached tax credits based on the 30% corporate tax rate already paid by the company. For BOQ, grossing up the $0.34 cash dividend to approximately $0.486 lifts the average DDM fair value estimate from $7.19 to $10.57, a material difference most retail investors overlook.
A range of 2% to 4% is appropriate given BOQ's sub-par return on equity of 4.7% and compressed net interest margin of 1.56%, both of which limit the bank's capacity to grow dividends meaningfully without first improving profitability.
The 14-analyst consensus target of approximately AUD 6.38 sits well below most DDM outputs because broker models incorporate more granular inputs such as dividend cut scenarios, payout ratio compression, and capital-raising dilution, whereas the Gordon Growth Model assumes a stable, perpetually growing dividend.
The standard risk-free rate for Australian equity valuation is the yield on 10-year Australian Commonwealth Government Bonds, available via the RBA's capital market yields data tables. The RBA cash rate of 4.35% provides environmental context but is not itself the risk-free rate used in equity models.