How to Read Trading Volume Before Every Trade
2 hrs ago

Two investors can look at the same ASX stock, apply different valuation methods, and reach opposite conclusions about whether it is cheap or expensive. The disagreement is rarely about the data. It is about the lens. Australian retail investors frequently default to familiar metrics, most commonly dividend yield, without considering whether that metric suits the type of company they are assessing. This mismatch between metric and business model is one of the most common sources of poor valuation judgements on the ASX. What follows is a practical guide to two widely used stock valuation methods: dividend yield and price-to-sales (P/S) ratio. Each is explained with real ASX companies, Amcor (ASX:AMC) and Sonic Healthcare (ASX:SHL), used throughout as illustrations. Readers will learn which metric suits which type of business, how to avoid the most common mistakes with each, and when to move beyond simple multiples toward more rigorous valuation tools.
Different business models generate value in structurally different ways. A mature packaging company that distributes most of its earnings as dividends operates nothing like a healthcare services business reinvesting heavily into growth. The metric that best captures value in one will mislead in the other.
Dividend yield is appropriate for businesses that pay out a large share of their earnings to shareholders. P/S ratio is appropriate for businesses where current earnings are temporarily suppressed, volatile, or being reinvested entirely, making revenue a more stable basis for comparison.
No single metric is universally correct. Using the wrong one does not produce a mathematical error; it produces a misleading conclusion. The calculation is right, but the answer is irrelevant.
Dividend yield and P/S ratio sit within a broader family of fundamental analysis metrics that each answer a different question about the same company: P/E examines earnings relative to price, EPS tracks per-share profit growth, return on equity measures capital efficiency, and revenue growth signals trajectory, none of which dividend yield or P/S captures on their own.
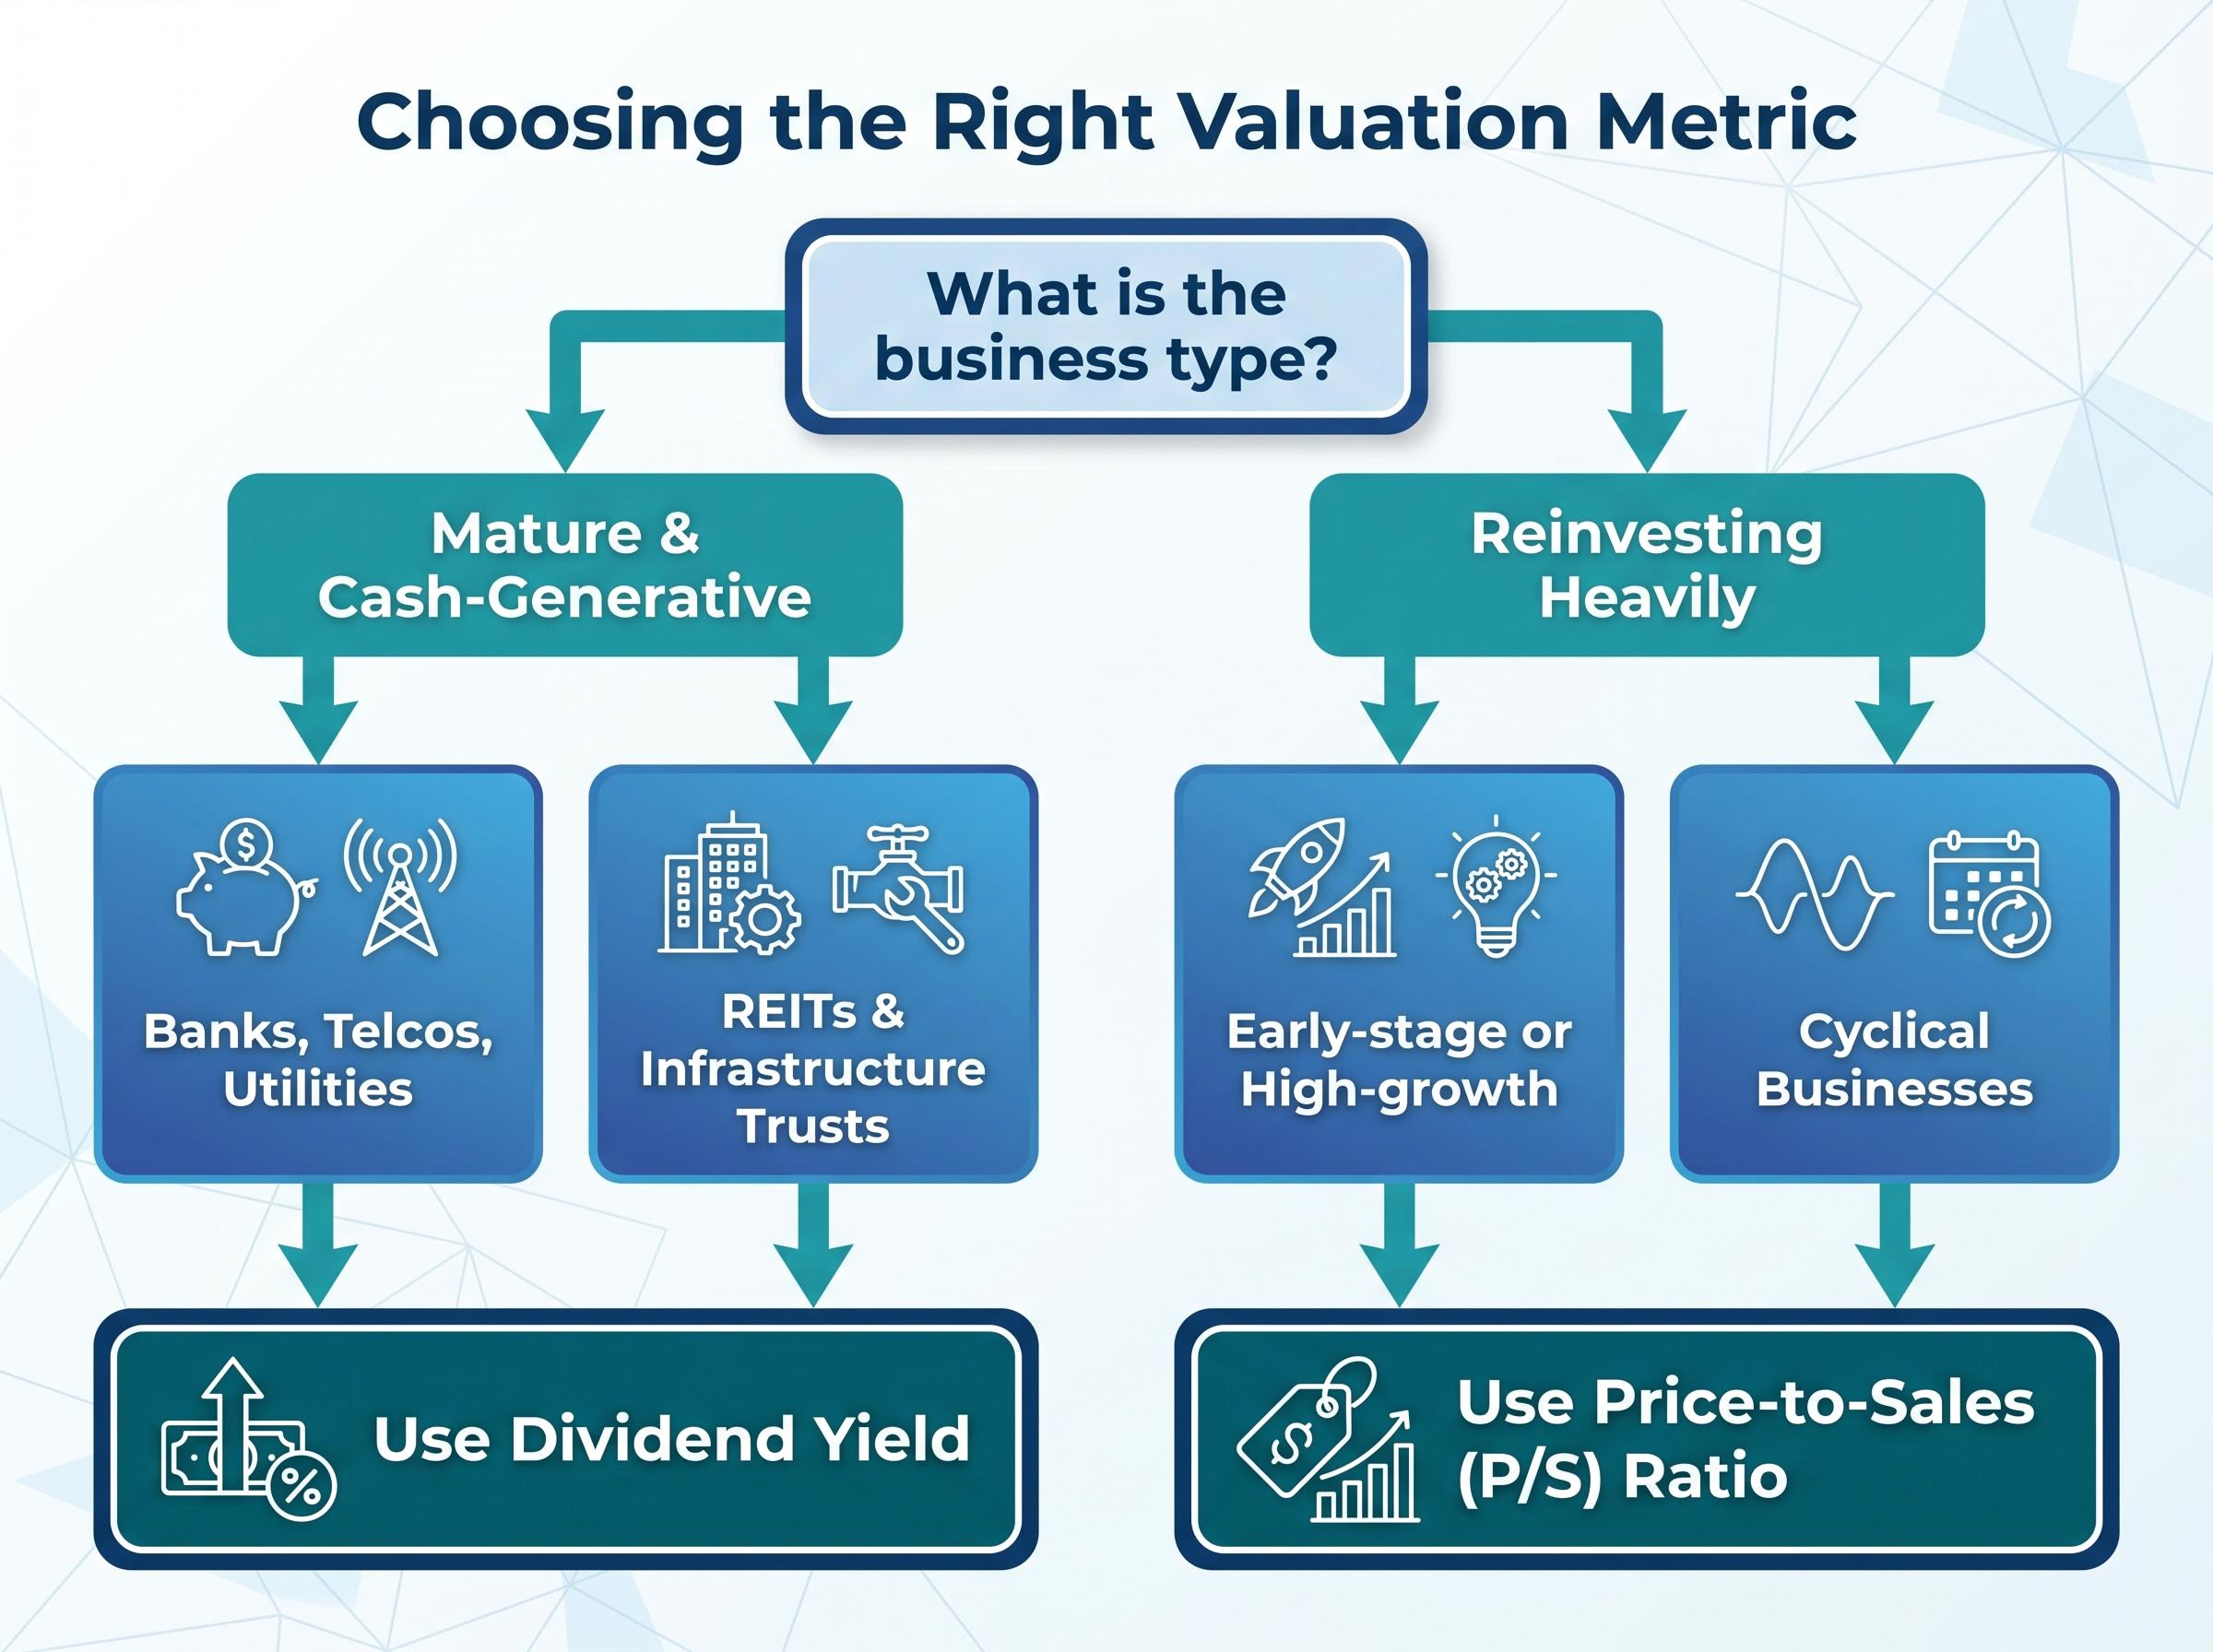
According to Rask Media and Livewire Markets commentary, yield suits “mature, cash-generative dividend payers” while P/S suits companies “reinvesting heavily.” On the ASX, this maps to a recognisable split between income-oriented and growth-oriented sectors.
Businesses where dividend yield is the natural starting point:
Businesses where P/S ratio is more informative:
The decision framework is straightforward: identify the business type first, then select the metric that fits.
Price-to-sales ratio is calculated by dividing a company’s market capitalisation by its annual revenue. It exists because earnings can be temporarily unreliable. A company reinvesting all its profits into growth, absorbing a one-off restructuring charge, or cycling through a low point in a commodity price may report depressed or negative earnings while its revenue remains stable. In these cases, P/S provides a cleaner basis for comparison than earnings-based metrics.
A low P/S is not automatically attractive. The ratio says nothing about profitability. A business with structurally thin margins, such as a supermarket retailer or industrial distributor, may appear cheap on P/S while being fairly valued or even expensive on earnings-based metrics. Margin structure determines whether low P/S represents an opportunity or simply reflects the economics of the business.
P/S comparisons are only meaningful within the same sector. According to Stockopedia and Morningstar AU, software companies structurally command higher P/S multiples than supermarkets because their margins and scalability are fundamentally different. Comparing the two is, as Stockopedia’s factor guides note, “meaningless.”
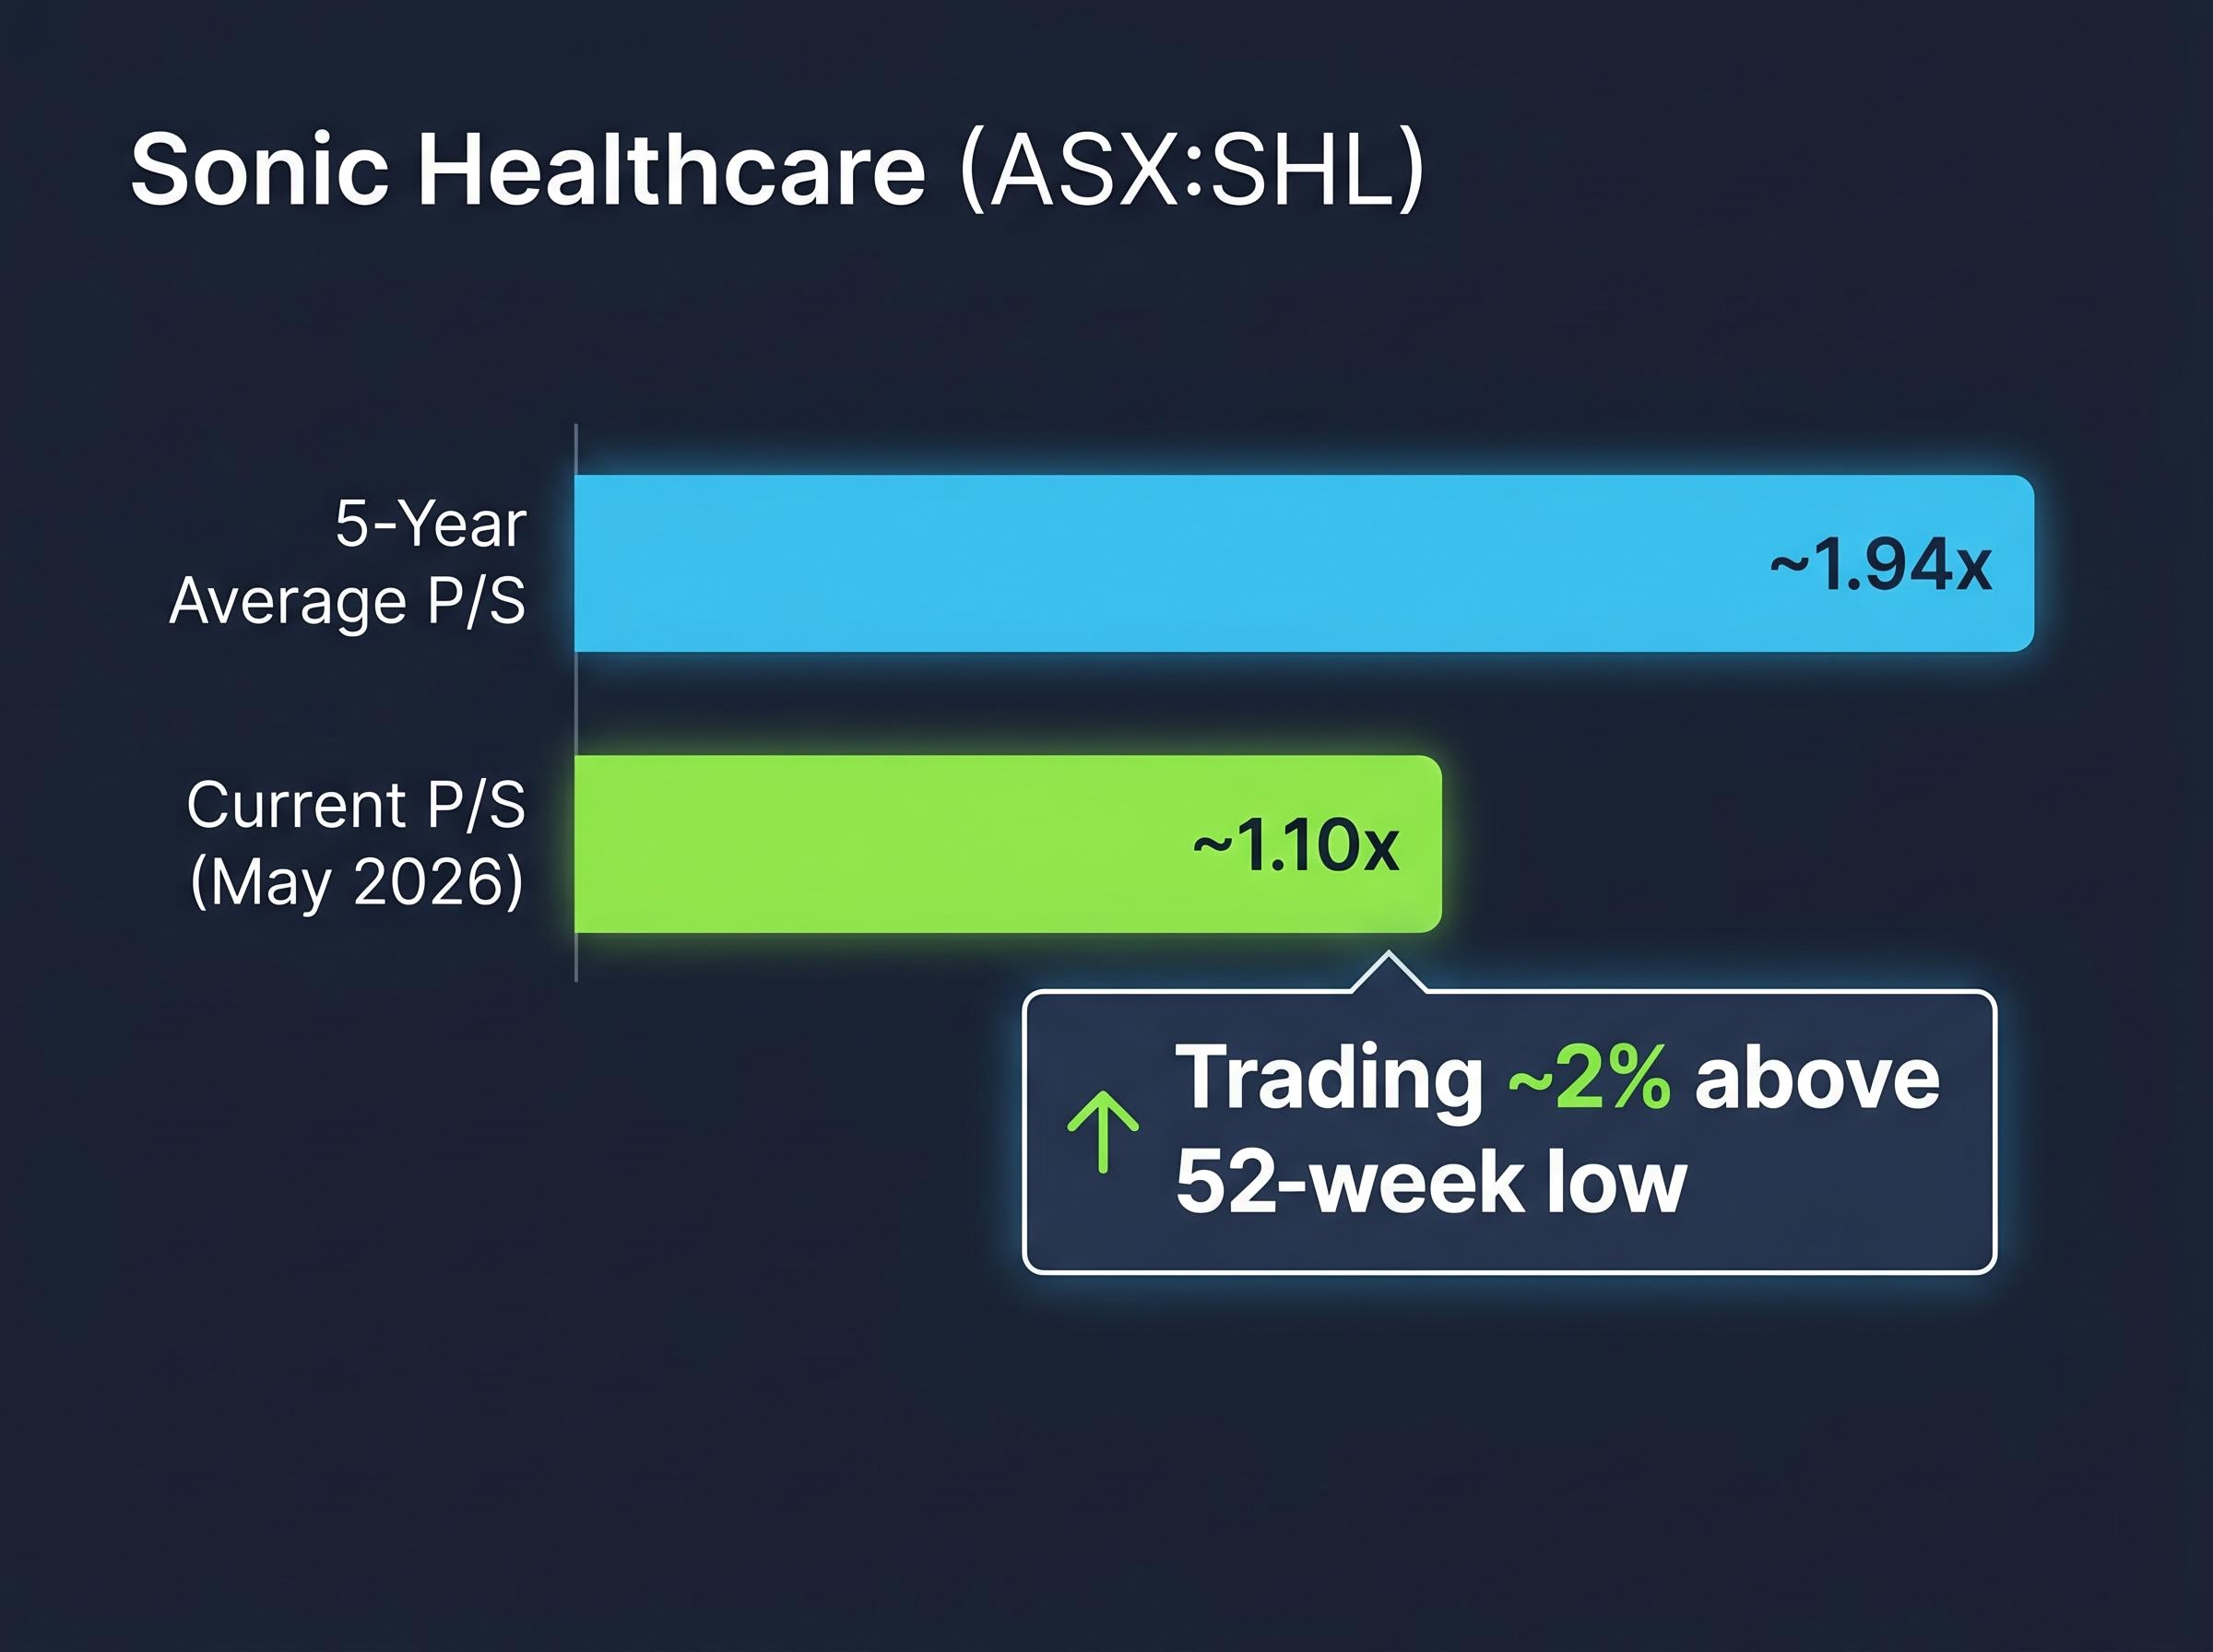
Sonic Healthcare (ASX:SHL) illustrates this in practice. As of May 2026, Sonic Healthcare trades on a P/S ratio of approximately 1.10x, compared to its five-year historical average of approximately 1.94x. At the time, SHL was trading approximately 2% above its 52-week low.
| Metric | Value | Analytical question raised |
|---|---|---|
| Current P/S (May 2026) | ~1.10x | Is this discount to history a buying opportunity, or has the growth thesis weakened? |
| Five-year average P/S | ~1.94x | Have margins compressed, or is the market mispricing a temporary earnings headwind? |
A below-average P/S on a growth-oriented healthcare business opens a question rather than providing an answer. The metric identifies a stock worth investigating further; it does not confirm undervaluation on its own. Morningstar AU and Stockopedia both emphasise that P/S must be interpreted alongside margin trends and growth rates before drawing conclusions.
The application of P/S ratio for growth platforms extends beyond healthcare services: Netwealth (ASX: NWL) currently trades at approximately 21.53x, a discount to its five-year historical average of 23.72x, illustrating how a below-average P/S on a high-recurring-revenue business opens the same analytical question the Sonic Healthcare reading raises, without providing an answer.
Dividend yield is calculated by dividing the annual dividend per share by the current share price, expressed as a percentage. It reflects two moving parts: the dividend paid and the price at which the stock trades. When either changes, the yield moves.
This matters because a rising yield can mean two very different things. If the dividend has grown, the rising yield signals increasing shareholder returns. If the share price has fallen, the rising yield may signal deteriorating fundamentals. Investors must determine which force is driving the number before treating the yield as attractive.
For Australian investors, franking credits add a material layer. Fully franked dividends carry attached tax credits that increase the effective after-tax return for eligible shareholders, particularly retirees and those in lower tax brackets. Grossed-up yield, which accounts for the franking credit, is more accurate than the raw cash yield alone. ASIC’s MoneySmart guidance notes that historical dividends are not a guarantee of future performance, reinforcing the need for context beyond the headline number.
For Australian investors comparing income stocks, the grossed-up dividend yield is the figure that matters, not the raw cash return, because fully franked dividends carry attached tax credits that can be worth as much as 43% above the headline cash payment for eligible shareholders including SMSFs in pension phase.
The ASX fundamental analysis course explicitly notes that high dividend yields represent past payouts and carry no guarantee of future dividend amounts, reinforcing why payout ratio and free cash-flow coverage must accompany any headline yield reading before an investment decision is made.
Amcor (ASX:AMC) provides a concrete current example. As of May 2026, Amcor carries a dividend yield of approximately 4.73%, positioning it as a mature large-cap industrial company where yield is a relevant screening metric for income investors. Amcor’s most recent annual dividend exceeded its preceding three-year average, indicating dividend growth rather than price decline as the primary yield driver.
A high dividend yield can signal either generosity or distress. The payout ratio and free cash flow coverage distinguish between the two. Without checking both, the headline yield is incomplete information.
Before relying on any quoted yield figure, four practical checks apply:
Both dividend yield and P/S ratio have well-documented failure patterns on the ASX. These traps follow predictable sequences, and recognising them in advance is materially more useful than learning from a loss.
Both traps share the same root cause: treating a screening tool as though it were a valuation conclusion. Yield and P/S identify stocks worth investigating. They do not confirm whether those stocks are cheap or expensive.
Dividend yield and P/S are first-pass tools. There are specific circumstances where those tools become insufficient, and recognising them is a skill in itself.
Four situations signal that a company warrants discounted cash flow (DCF) or dividend discount model (DDM) analysis rather than a multiple-based assessment:
DDM is the appropriate model for stable, mature dividend payers where the dividend stream is the primary return mechanism. It explicitly models the expected future dividend path and discounts it back to a present value. DCF is the appropriate model for growth businesses where free cash-flow trajectory determines intrinsic value.
Rask Media’s investor education encourages retail investors to treat simple multiples as “quick filters,” with DCF applied to growth stocks and DDM applied to stable dividend payers once a stock has passed the initial screening stage. Morningstar AU uses DCF as the basis for its fair-value estimates and star ratings on ASX stocks, particularly for wide-moat and long-duration growth companies.
Both methods require more inputs and judgement than a simple ratio. That complexity is precisely what makes them more informative in the situations where multiples mislead.
For investors ready to move from screening into a structured multi-method framework, our dedicated guide to ASX share valuation methods walks through a five-step sequence covering P/S, EV/EBITDA, DCF, and DDM in combination, with Flight Centre used as a worked example of how a low P/S can mask high debt levels invisible to the ratio alone.
The reader who started this article defaulting to a single familiar metric now has a repeatable decision sequence for the next ASX company they assess:
Amcor illustrates steps one through four in practice: a mature industrial where yield is the natural starting point, checked against payout ratio and dividend growth trends. Sonic Healthcare illustrates the same sequence from the P/S side: a growth-oriented healthcare business where a below-average P/S reading opens the analytical conversation rather than closing it.
The consistent message across Australian sources, including Rask, Morningstar AU, Livewire, and ASX investor education, is that multiples are best for screening and peer comparison, with DCF or DDM as the next step for shortlisted candidates. ASIC MoneySmart, ASX investor education resources, and Rask Education all offer Australian-specific material for investors looking to develop their valuation skills further.
Disciplined metric selection is itself a core investing skill. The right method does not guarantee the right answer, but the wrong method virtually guarantees the wrong question.
This article is for informational purposes only and should not be considered financial advice. Investors should conduct their own research and consult with financial professionals before making investment decisions.
—
The price-to-sales (P/S) ratio is calculated by dividing a company's market capitalisation by its annual revenue. It is most useful for growth-oriented or cyclical businesses where earnings are temporarily suppressed or volatile, making revenue a more stable basis for comparison than profit-based metrics.
Dividend yield is calculated by dividing the annual dividend per share by the current share price, expressed as a percentage. For Australian investors, the grossed-up yield, which includes the value of franking credits, gives a more accurate picture of the true after-tax return.
A yield trap occurs when a falling share price inflates the reported dividend yield, making a stock appear attractive just before the company cuts its dividend. Investors can avoid this by checking the payout ratio and free cash-flow coverage alongside the headline yield figure.
Investors should escalate to discounted cash flow (DCF) or dividend discount model (DDM) analysis when earnings or dividends are expected to change materially, when a business has a long-duration growth profile, or when capital structure and cyclicality make snapshot multiples unreliable.
As of May 2026, Sonic Healthcare trades on a P/S ratio of approximately 1.10x, which is a significant discount to its five-year historical average of approximately 1.94x, raising the question of whether this reflects a temporary earnings headwind or a weakened growth thesis.