
Earnout Structures Explained Using a Live ASX Deal
2 hrs ago

Bendigo and Adelaide Bank (ASX: BEN) shares are trading around $10.40 in mid-May 2026, yet two standard valuation models, the price-to-earnings (PE) ratio and the Dividend Discount Model (DDM), applied to the bank’s own verified earnings and dividend data, point to fair values ranging from $10.50 to well above $15. That gap between market price and model output is worth understanding, particularly for Australian retail investors watching a regional bank that has retreated 13-15% from its mid-2025 peak while the major banks have broadly held their ground. This guide walks through both valuation methods step by step, using BEN’s actual financial figures, and explains exactly which assumptions drive each result. It also examines the real risks that may justify part of the discount, so readers finish with a framework for their own assessment rather than a single number to act on.
Bendigo and Adelaide Bank closed at $11.99 on 28 May 2025, according to Yahoo Finance historical data. By mid-May 2026, the shares had pulled back to approximately $10.27-$10.40, a decline of roughly 13-15% over less than 12 months.
That retreat stands out against the broader banking sector. Commonwealth Bank has continued trading near record-high PE multiples, and the other three majors, NAB, Westpac, and ANZ, have delivered roughly flat to modestly positive total returns over the same period. BEN has been the underperformer, and the market is pricing it accordingly.
The question is whether the current share price reflects a fair assessment of the bank’s earnings power and dividend capacity, or whether investors have overshot to the downside. To answer that, a share price needs context: what do independent models and analyst forecasts say BEN should be worth?
Three widely referenced valuation anchors sit modestly above the current price:
The consensus view among brokers skews toward “Hold” or “Neutral” recommendations. That signals a market that sees BEN as modestly cheap, not compellingly so. At these levels, the analyst community is pricing in limited near-term upside but not calling for significant further downside either.
These benchmarks provide a starting point. The sections that follow build fair value estimates from first principles using BEN’s own numbers, and the results diverge meaningfully from this consensus.
The PE ratio is one of the simplest valuation tools available. It compares a company’s share price to its annual earnings per share (EPS), producing a multiple that tells an investor how much the market is willing to pay for each dollar of profit.
Applying it to any stock involves two steps:
The Australian banking sector trades at an average PE of approximately 20.4x, according to Simply Wall St data for the financials and banks sector.
That 20.4x figure is the benchmark. But context matters. CBA has been trading near record-high PE multiples, pulling the sector average upward. Regional banks, with smaller scale and different risk profiles, typically trade at a discount to the sector average. Applying the full 20.4x multiple to a regional bank without adjustment would overstate the result.
For mature banks with stable dividend histories like BEN, the PE ratio also has a structural blind spot: it measures price relative to earnings but ignores what proportion of those earnings is returned to shareholders as cash dividends. For income-focused investors, that omission matters, which is why the Dividend Discount Model, covered later in this guide, provides a complementary lens.
The PE ratio sits within a broader set of fundamental analysis metrics, including EPS, revenue growth, profit margins, and return on equity, each of which answers a different question about the same business; no single figure tells the full story, and sector peer comparison is essential before any multiple is applied.
BEN reported verified FY24 earnings per share of $0.96. At the current share price of approximately $10.40, that implies the market is valuing BEN at a PE of roughly 10.8x on trailing earnings.
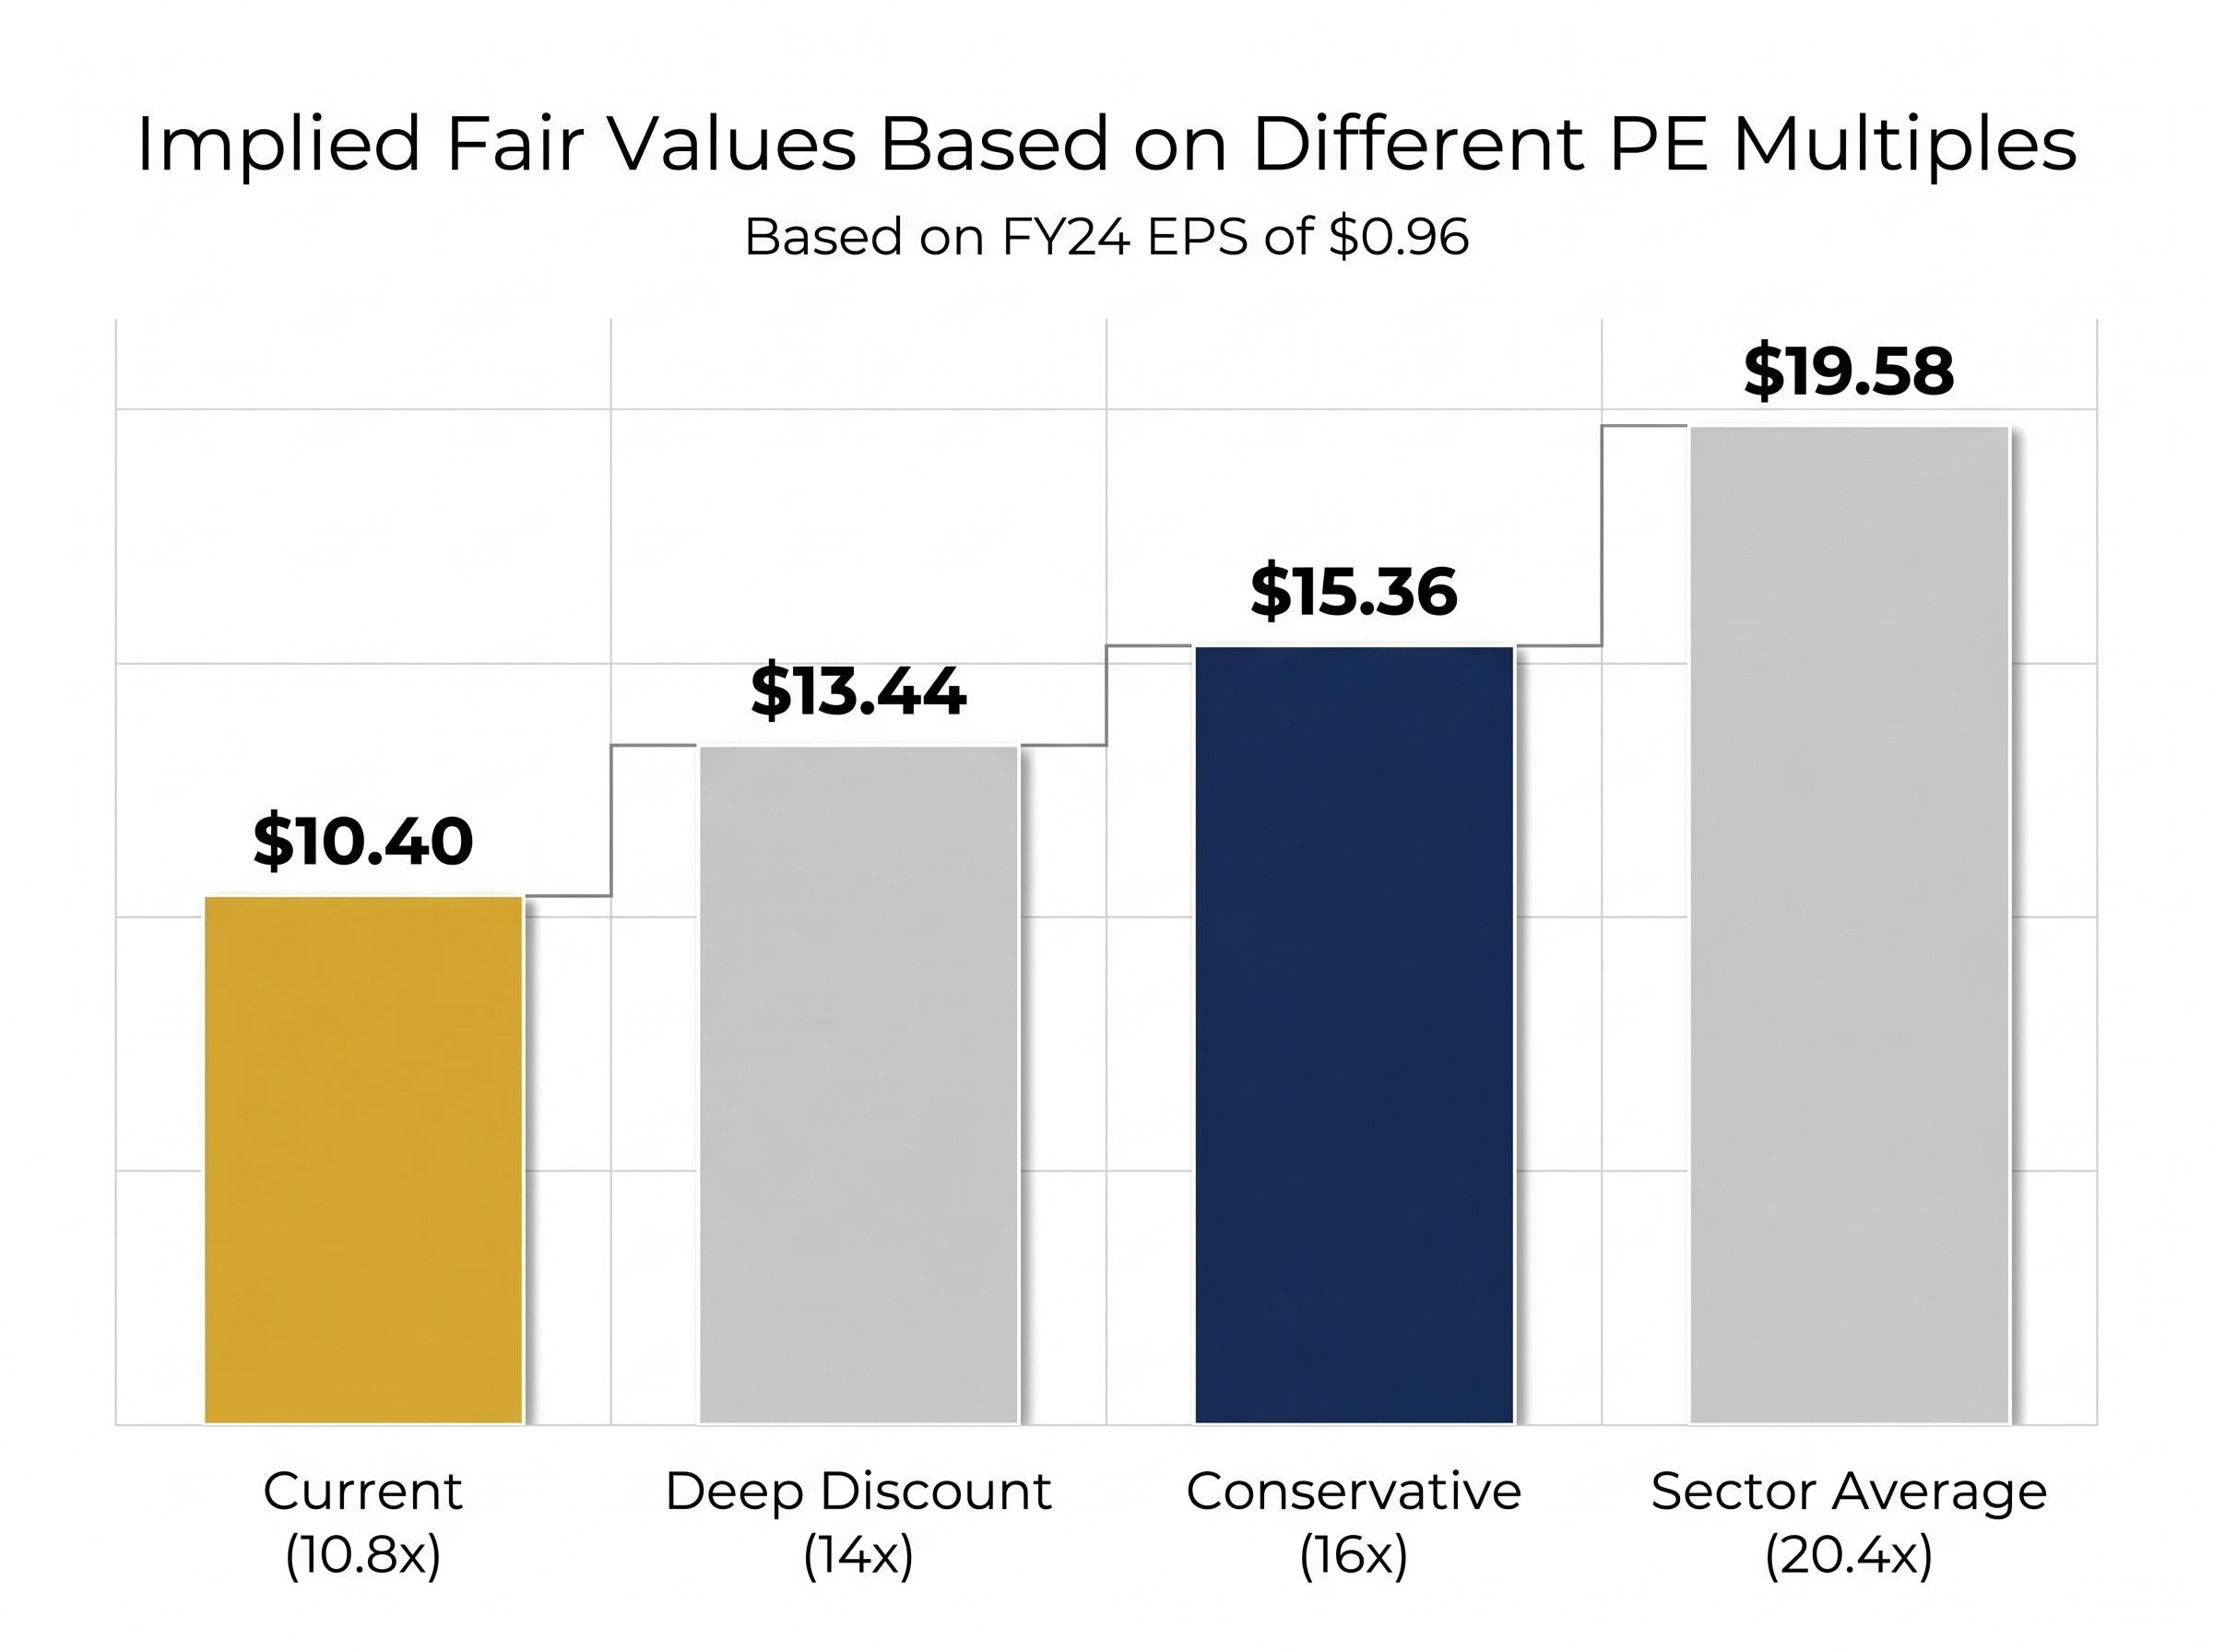
Compare that to the sector average of 20.4x, and the gap is immediately apparent. Applying the full sector PE to BEN’s verified EPS produces a fair value of $0.96 x 20.4 = approximately $19.58. That figure looks striking, but it requires immediate qualification.
The more informative exercise is to step through a range of PE multiples, each reflecting a different assumption about how much of the sector premium BEN deserves:
| PE Multiple | EPS Used | Implied Fair Value | Premium to Current Price ($10.40) |
|---|---|---|---|
| 20.4x (sector average) | $0.96 (FY24) | $19.58 | +88% |
| 16x (conservative) | $0.96 (FY24) | $15.36 | +48% |
| 14x (deep discount) | $0.96 (FY24) | $13.44 | +29% |
| 16x (forward EPS) | ~$1.01 (FY25 est.) | ~$16.16 | +55% |
Even the deep-discount scenario at 14x produces a fair value of $13.44, approximately 29% above the current share price. That is a notable result and demands careful interpretation.
Regional banks trade at a structural discount to the sector average for identifiable reasons. BEN has lower scale than the big four, which translates into higher funding costs per dollar of lending. Its loan book carries more concentrated exposure to regional housing markets, SME lending, and agribusiness. The bank is also partway through a multi-year technology transformation programme that creates near-term earnings drag, weighing on return on equity in the short term.
A working assumption of 14x-16x for BEN is more defensible than applying the full 20.4x. That range still produces fair value estimates of $13.44-$15.36, a material premium to the current price, but one grounded in a realistic assessment of BEN’s position within the sector.
The Dividend Discount Model takes a fundamentally different approach. Rather than comparing price to earnings, it asks: what is the present value of the cash dividends a shareholder can expect to receive over time?
The formula is straightforward. Fair value equals the annual dividend per share, divided by the difference between the cost of equity (the return investors require) and the long-term dividend growth rate. It requires three inputs:
BEN paid a full-year dividend of $0.63 per share in FY24, fully franked. Forward estimates suggest approximately $0.65 per share. The bank’s CET1 capital ratio of 11.2% (as of 1H FY26) sits above APRA’s 10.5% minimum for standardised banks, providing a buffer that supports continued dividend payments.
The DDM is considered particularly well-suited to bank stocks with stable, predictable dividend histories, and BEN fits that profile. Management commentary through 1H FY26 signalled cautious stability, with no indication of a dividend cut or suspension.
For eligible Australian shareholders, fully franked dividends carry an additional value that a standard DDM calculation misses. At the 30% corporate tax rate, BEN’s $0.63 fully franked dividend is worth approximately $0.90 on a grossed-up basis ($0.63 divided by 0.70).
For eligible Australian shareholders, BEN’s $0.63 fully franked dividend is worth the equivalent of approximately $0.90 before personal tax, a meaningful difference to the DDM output.
Running the DDM with the grossed-up figure produces an illustrative fair value of approximately $19.64. This overstates a realistic market price, since the market prices dividends on a cash basis rather than a grossed-up basis. But it demonstrates the genuine tax value of fully franked income to a personal investor and explains why income-focused Australian shareholders may view BEN’s yield more favourably than the headline cash figure suggests.
Simply Wall St uses a discount rate of approximately 7.8% in its own modelling, which provides a useful reference point for what follows.
The DDM’s output is only as reliable as the assumptions fed into it. Small changes in the cost of equity or growth rate produce large swings in the fair value estimate, which is why a sensitivity analysis matters more than any single number.
Three scenario anchors frame the range:
The conservative case produces a fair value of $10.50, barely above the current share price. The Rask Media base cases, which use a lower discount rate, produce fair values in the $13-$14 range. The difference between those outputs comes down to a single variable: how much return an investor demands for holding a regional bank stock.
The sensitivity table below shows how the DDM output shifts as the cost of equity changes, holding DPS at $0.63 and growth at 2%:
| Cost of Equity | Fair Value (DPS $0.63, Growth 2%) |
|---|---|
| 7% | $12.60 |
| 8% | $10.50 |
| 9% | $9.00 |
| 10% | $7.88 |
At a 9% cost of equity, the DDM says BEN is overvalued at current prices. At 7%, it says BEN is worth $12.60, a 21% premium. The full sensitivity range across all reasonable assumptions spans from $7.22 (at 11% cost of equity, 2% growth) to $32.50 (at 6% cost of equity, 4% growth).
This is the most honest part of any DDM analysis. The “undervalued” conclusion depends entirely on which discount rate an investor considers appropriate for a regional bank with BEN’s risk profile. Investors who assign a higher discount rate for regional bank exposure are not wrong to do so; they are simply expressing a different risk assessment.
BEN’s 1H FY26 cash earnings of $256.4 million and management’s tone of cautious stability support the assumption that dividends will be maintained near current levels, but they do not resolve the discount rate debate.
Both the PE approach and the DDM point to fair values above the current share price across most reasonable assumptions. That raises an obvious question: if the models say BEN is cheap, why isn’t the market bidding the shares higher?
The answer lies in risks that quantitative models cannot fully capture:
Macro headwinds:
BEN-specific structural risks:
Model limitations:
At approximately $10.40, BEN’s fully franked dividend yield of around 6.1% grosses up to approximately 8.6% for eligible Australian shareholders, a meaningful income return while waiting for any potential price re-rating.
The analyst consensus at $10.64 and the predominant “Hold/Neutral” recommendation skew reflect a market view that BEN is modestly cheap but not compellingly so. The discount to model fair values is not pure market error; it reflects identifiable risks that a retail investor should weigh explicitly.
BEN’s multi-year core system modernisation programme is the most forward-looking risk factor in the valuation equation. Successful execution would narrow the structural cost disadvantage relative to the majors, potentially supporting a higher sustainable PE multiple and a share price re-rating over time.
The risk is binary. Delays or cost overruns extend the earnings drag and justify the market’s current discount. Successful delivery could be the catalyst that closes the gap between model fair values and market price. This is the single factor most likely to determine whether BEN’s PE multiple compresses further or expands toward the sector average.
BEN’s Q3 FY2026 cost transformation programme, which targets annualised savings of $65 million to $75 million by FY2028 through partnerships with Infosys and Genpact, is the most concrete near-term data point on whether the technology modernisation wildcard will close the discount or extend the earnings drag.
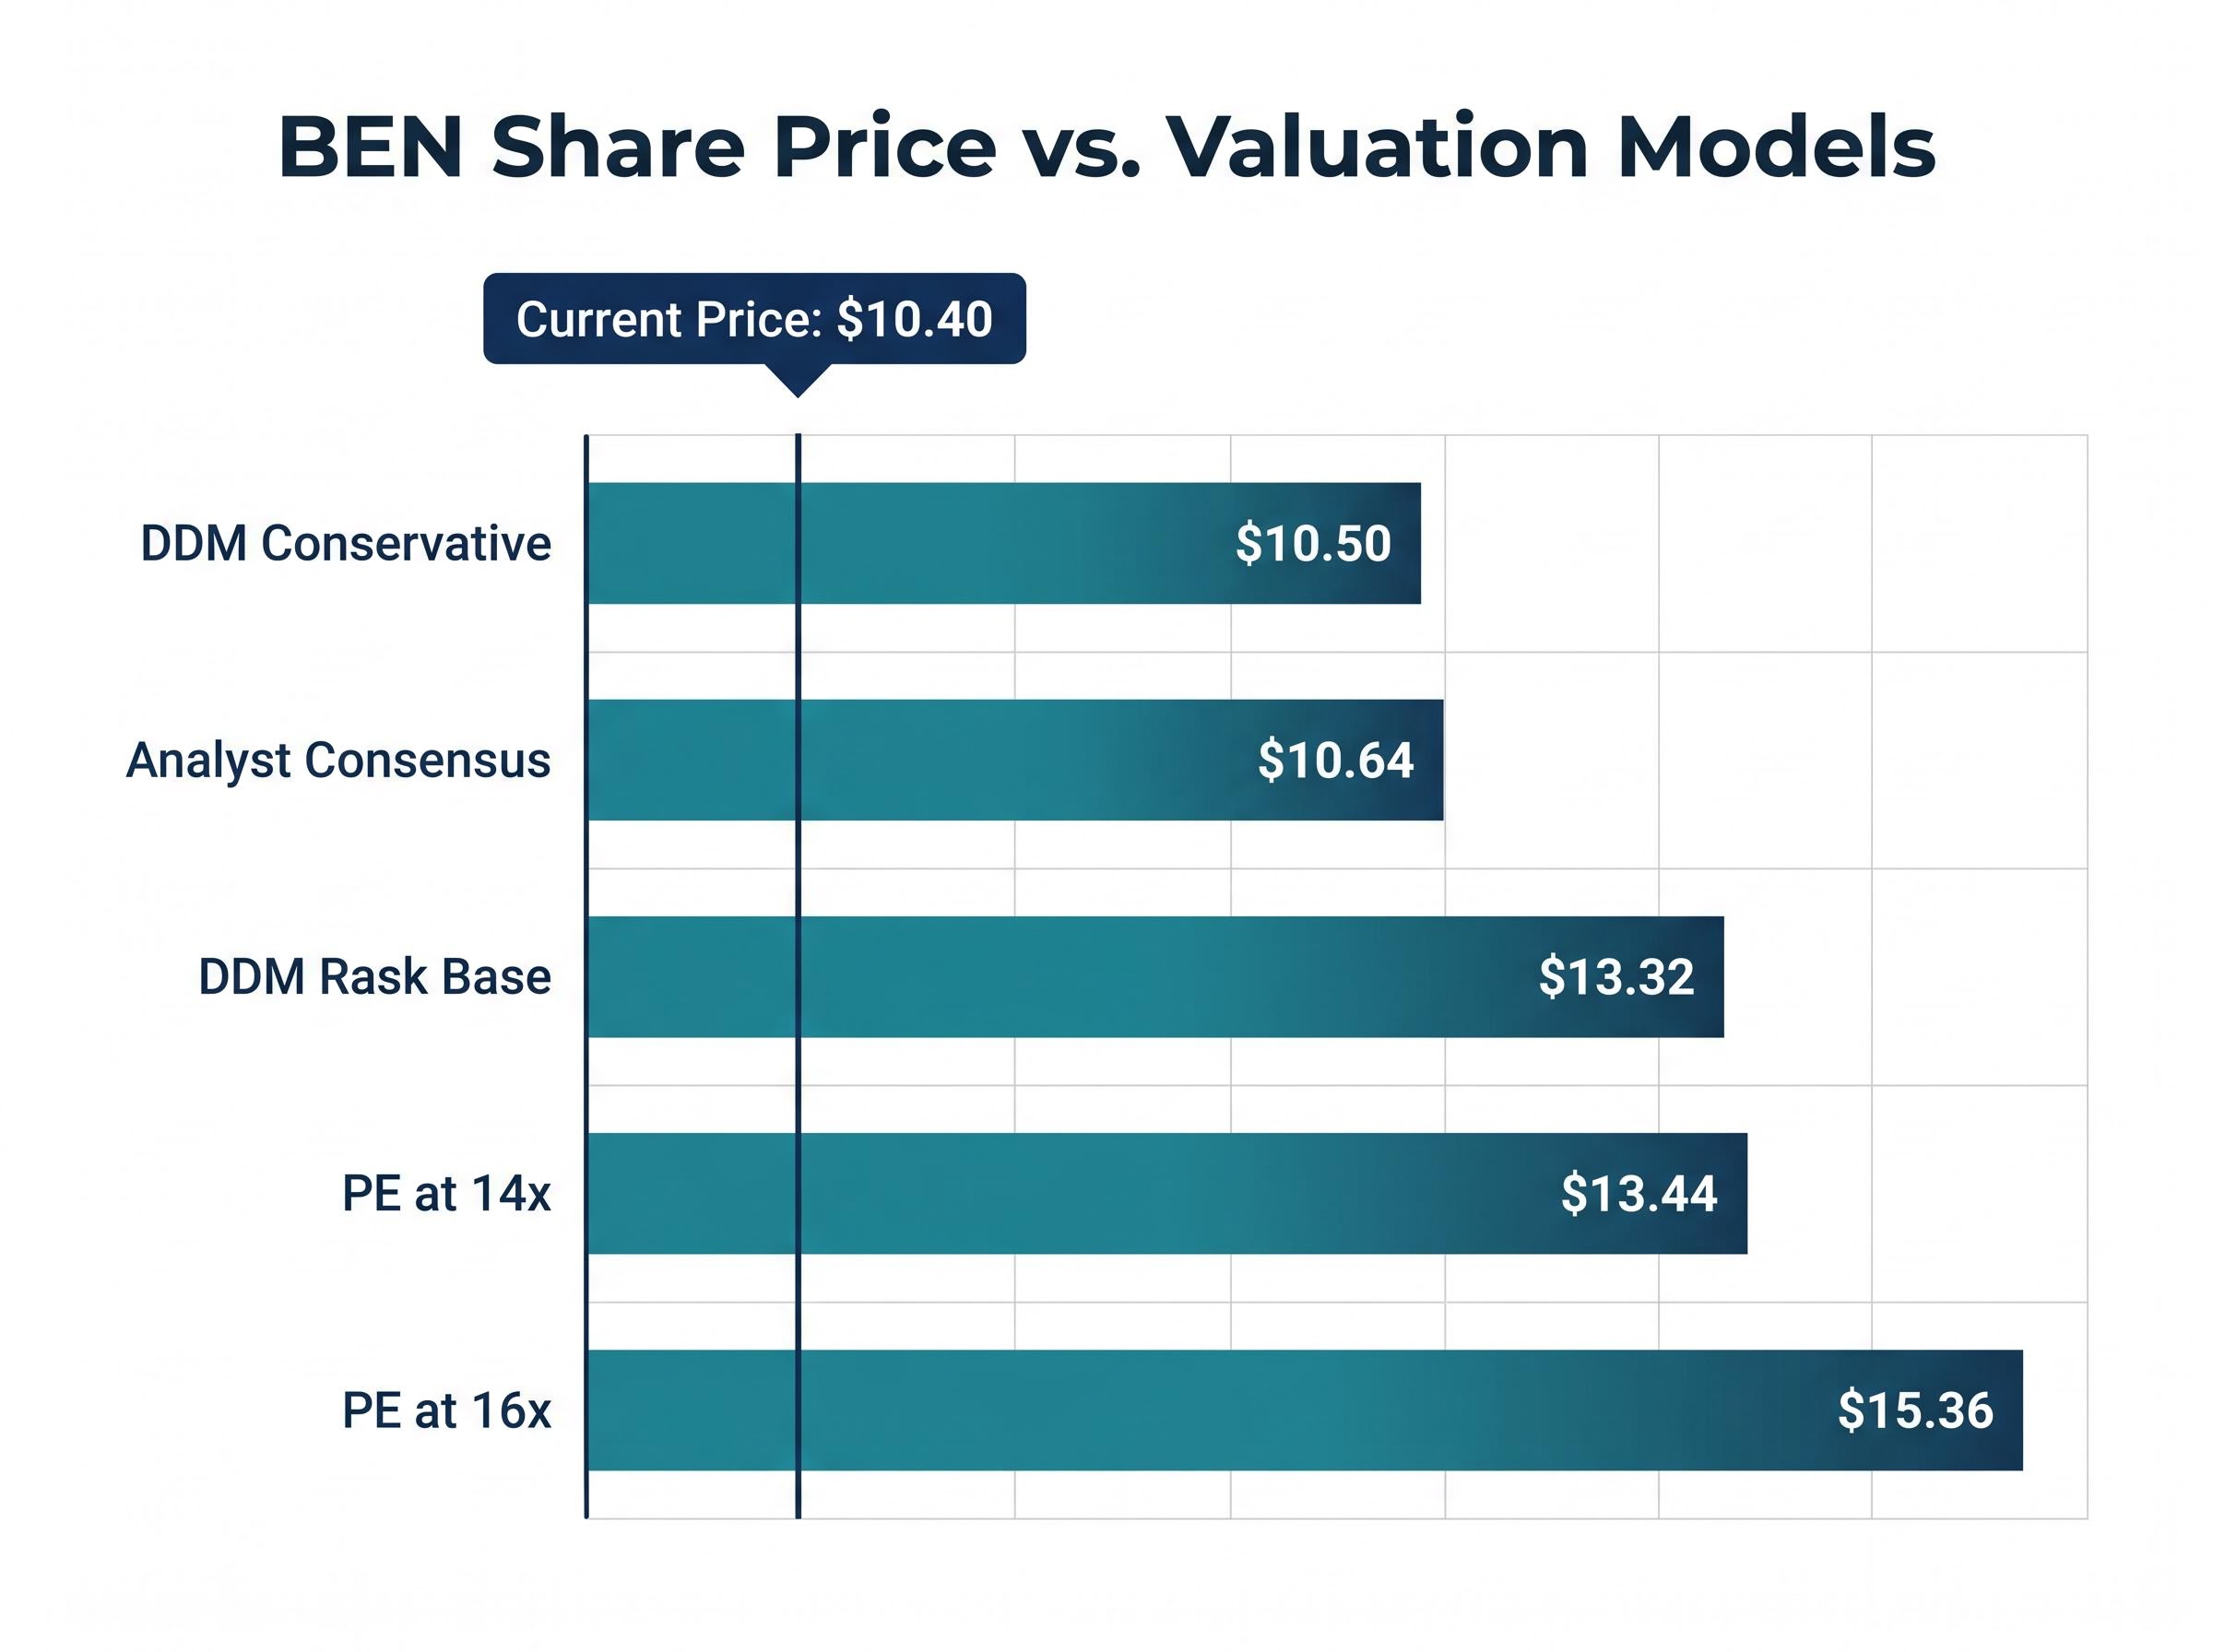
Bringing the two valuation methods together, the PE and DDM frameworks produce a range of fair value estimates that, across most assumptions, sit above BEN’s current share price:
| Method | Key Inputs | Fair Value Estimate | vs. Current Price ($10.40) |
|---|---|---|---|
| PE at 14x | EPS $0.96 | $13.44 | +29% |
| PE at 16x | EPS $0.96 | $15.36 | +48% |
| DDM conservative | DPS $0.63, CoE 8%, growth 2% | $10.50 | +1% |
| DDM Rask base | DPS $0.63, CoE ~7%, growth 2% | $13.32 | +28% |
| DDM forward DPS | DPS $0.65, CoE ~7%, growth 2% | $13.75 | +32% |
| Analyst consensus | TradingView, May 2026 | $10.64 | +2% |
| Simply Wall St | Proprietary model | $10.81 | +4% |
| Morningstar | Proprietary model | ~$10.50-$11.00 | +1% to +6% |
The estimates converge in one respect: almost none of them suggest BEN is overvalued at $10.40. Where they diverge is on how much upside exists, and that divergence reflects different assumptions about the appropriate discount rate and PE multiple for a regional bank.
For a stock carrying real execution risk, NIM compression, and technology transformation uncertainty, the concept of a margin of safety matters. A gap between model fair value and market price needs to be wide enough to account for the possibility that the optimistic assumptions prove wrong. The conservative DDM ($10.50) and analyst consensus ($10.64) leave almost no margin. The PE-based estimates ($13.44-$15.36) leave a substantial one.
Three practical takeaways for retail investors:
Investors wanting to stress-test the discount rate assumptions underpinning both the PE and DDM outputs here will find our full explainer on how macro assumptions drive ASX bank valuations useful — it uses a live case study to show how the same model produces a wide per-share range depending entirely on RBA rate, employment, and property assumptions rather than arithmetic differences.
This article is for informational purposes only and should not be considered financial advice. Investors should conduct their own research and consult with financial professionals before making investment decisions. Past performance does not guarantee future results. Financial projections are subject to market conditions and various risk factors.
The Dividend Discount Model calculates a stock's fair value by dividing the expected annual dividend per share by the difference between the investor's required return and the expected dividend growth rate. Applied to Bendigo and Adelaide Bank's FY24 dividend of $0.63 per share, the model produces fair value estimates ranging from $10.50 under conservative assumptions to over $13 when a lower discount rate is used.
At a share price of approximately $10.40 and FY24 earnings per share of $0.96, BEN is trading at a trailing PE of roughly 10.8x, well below the Australian banking sector average of approximately 20.4x. Even applying a discounted multiple of 14x to account for BEN's smaller scale and regional concentration, the implied fair value comes to $13.44, around 29% above the current price.
At a share price of approximately $10.40, BEN's fully franked dividend of $0.63 per share implies a cash yield of around 6.1%. For eligible Australian shareholders, the franking credits gross that yield up to approximately 8.6%, adding meaningful tax value beyond the headline cash dividend figure.
The discount reflects identifiable risks including net interest margin compression from deposit competition, rising arrears from post-COVID lows, higher funding costs relative to the major banks, and near-term earnings drag from an ongoing multi-year technology transformation programme. These factors lead most analysts to assign a lower PE multiple and higher discount rate to BEN than the sector average.
Successful completion of BEN's technology transformation programme targeting annualised cost savings of $65 million to $75 million by FY2028, stabilising net interest margins, or a dividend increase would each support a higher sustainable PE multiple or a lower required discount rate. Without one of these catalysts materialising, the current discount to model fair values may persist.