On 20 August, Walmart beat earnings estimates, raised its full-year guidance, and then watched its share price fall more than 9% in a single session. That contradiction deserves a closer look, because the answer sits somewhere between a naval blockade in the Strait of Hormuz and a shopper in Ohio putting back a box of cereal.
The results landed at an unusual moment. Brent crude had just surged past $87 per barrel after Washington announced a sweeping economic isolation campaign targeting Iran, and Walmart’s own executives were telling analysts that customers were making trade-offs driven by fuel costs. The stock’s reaction was not irrational. It was a piece of market intelligence about what is happening to working-class American households right now.
Here is what the headline numbers masked, how the Iran oil shock is transmitting into household spending at the ground level, and what the combination of these data points tells you if you are watching Walmart as a consumer barometer.
The market looked past the headline and found a problem underneath
Walmart beat top-and-bottom-line estimates. It raised its full-year revenue and profit guidance for the first time this fiscal year. On a headline basis, there was nothing to sell.
The market sold anyway, and sold hard. U.S. comparable store sales, the most direct measure of whether real customers are spending more, came in at just 2.6%, well short of analyst expectations in the 3.5-3.8% range. That gap was the key negative surprise investors had not priced in, and it broke a streak of meeting or exceeding comparable-sales expectations that had run for years.
Comparable store sales as a retail health gauge isolates organic revenue growth at existing locations, stripping out the flattering effect of new store openings, which is precisely why a miss of this magnitude at Walmart carries more informational weight than a headline revenue or earnings figure.
- U.S. comparable store sales: reported 2.6% vs. consensus estimate 3.5-3.8% vs. prior-year period outperformance
- Average transaction size growth: 1.1% current quarter vs. 3.1% same period last year
- Single-day share price decline: more than 9%, closing near $103-105, the sharpest one-session drop the stock had suffered in more than four years
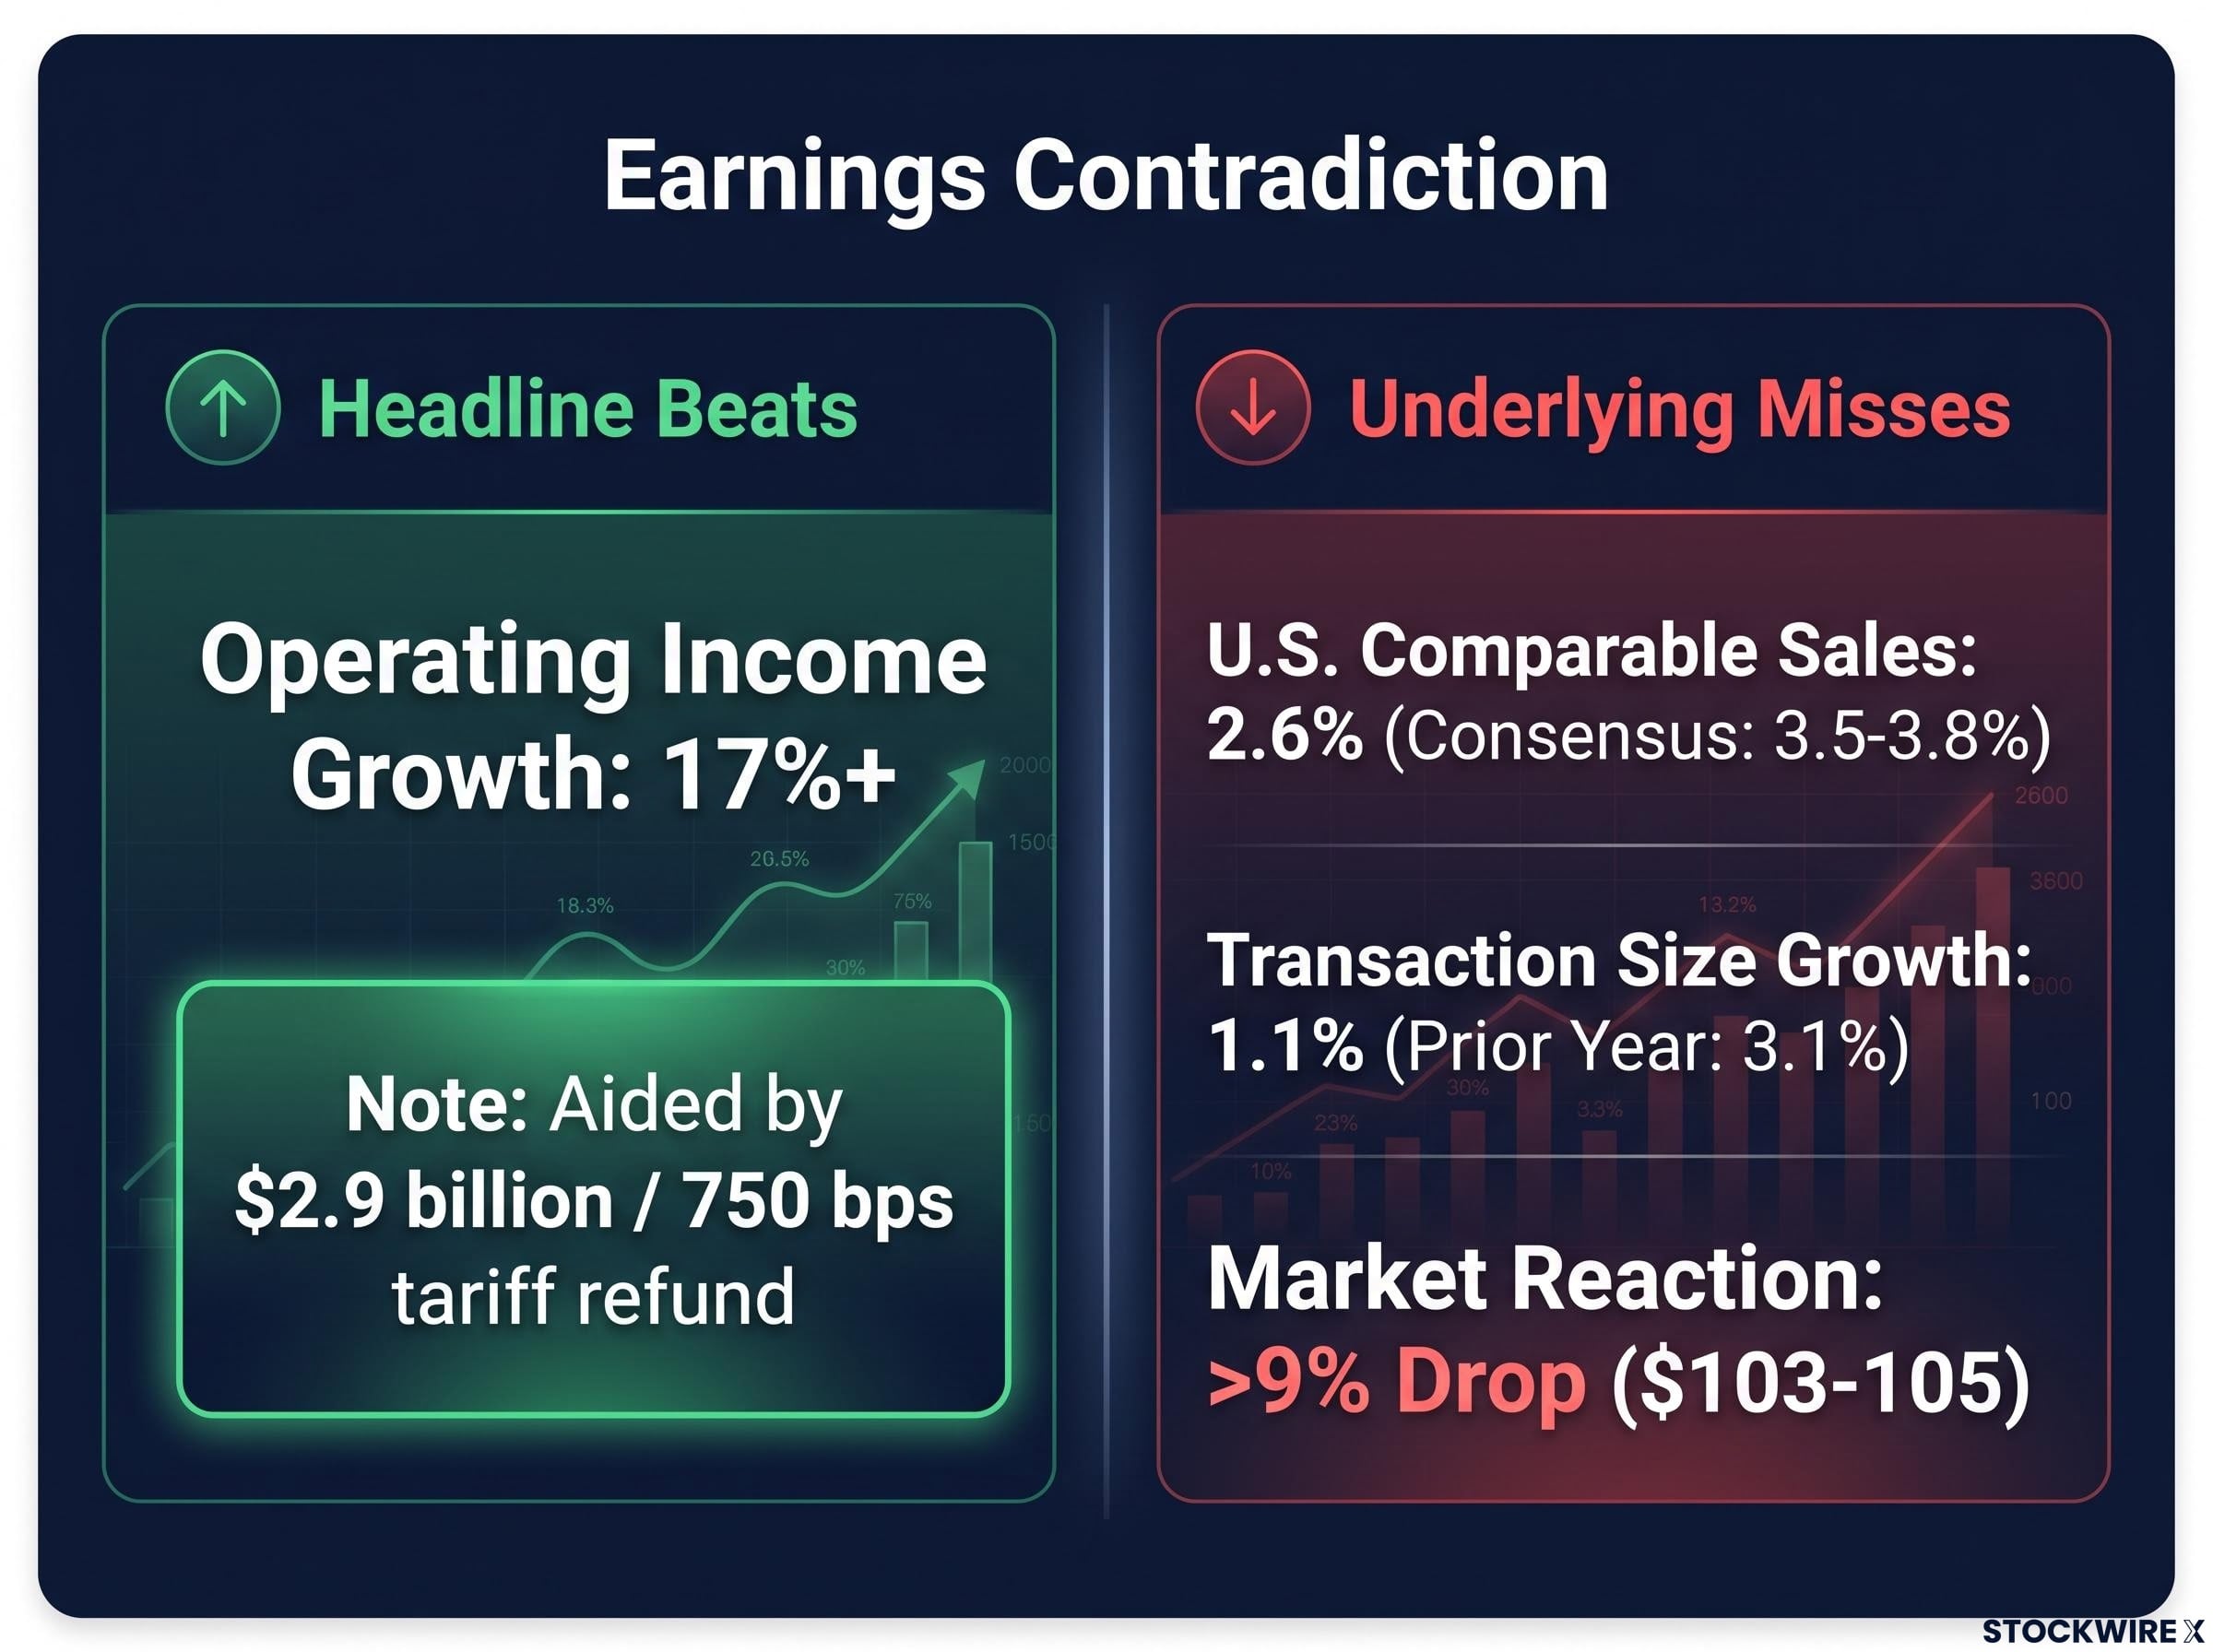
A raised full-year outlook and a headline earnings beat, paired with a 9%+ single-day decline. The market was not reacting to what Walmart reported. It was reacting to what the reported numbers revealed about underlying demand.
Consumer staples peers declined in sympathy the same session, confirming that institutional money read this as a sector-level signal rather than a company-specific stumble. Comparable sales growth tells you whether real demand is expanding or contracting, and a miss of this magnitude, at this company, told investors the answer they did not want to hear.
When big ASX news breaks, our subscribers know first
Why the earnings beat was not what it appeared to be
The headline numbers looked strong. Adjusted operating income grew more than 17% on a constant-currency basis. But that growth figure was inseparable from a single non-recurring item: Walmart received approximately $2.9 billion in tariff refunds during the reporting period, with those refunds accounting for a documented 750-basis-point lift to the adjusted operating income figure.
| Metric | Reported figure | Adjusted (excluding tariff benefit) |
|---|---|---|
| Operating income growth (constant currency) | 17%+ | Materially lower once 750 bps removed |
| Operating income margin contribution from tariff refunds | 750 basis points | Zero (non-recurring) |
Management raised guidance even as the market discounted the quality of the beat. That disconnect is the point: one-time policy tailwinds are not the same as durable organic demand, and institutional investors price this distinction systematically.
What 750 basis points actually means in practice
A 750-basis-point benefit equals 7.5 percentage points of operating income growth attributable to a single item: government tariff refunds triggered by a policy reversal. Strip that out of the income statement and what remains is a company whose organic margin trajectory looks materially less impressive than the reported figure.
That is precisely the calculation institutional investors ran before selling. A large portion of the reported profit growth this quarter came from a policy event, not from selling more goods to more customers. In the current tariff environment, disaggregating one-time policy benefits from underlying business performance is the framework to apply to every retailer reporting over this period.
How the basket is shrinking, one trade-off at a time
The average transaction size expanded at just 1.1% this quarter, down sharply from the 3.1% rate recorded in the equivalent period a year ago. That is not a statistics story. That is a story about a household in which gasoline costs have risen enough to change what goes into the trolley.
Walmart’s own management linked the deceleration explicitly to high fuel prices, characterising customer behaviour as increased “trade-offs” and discretionary pullback. Lower-income shoppers are the first cohort affected, as elevated gasoline prices absorb a disproportionate share of tighter household budgets, reducing what is left for groceries and general merchandise.
Consumer savings depletion adds a structural dimension to the cyclical fuel-cost squeeze: with the US personal savings rate at 4.0% as of early 2026, households have limited buffer to absorb sustained energy cost increases, meaning the basket trade-offs Walmart is observing may deepen even if crude prices plateau rather than rise further.
- Higher fuel costs absorb budget: Gasoline price increases since the Iran conflict escalated in early 2026 have taken a growing share of household spending for price-sensitive consumers.
- Discretionary basket shrinks: With less disposable income available after filling the tank, shoppers cut back on non-essential items and reduce overall basket sizes.
- Substitution toward private-label accelerates: Customers trade down to lower-cost alternatives across grocery and general merchandise categories.
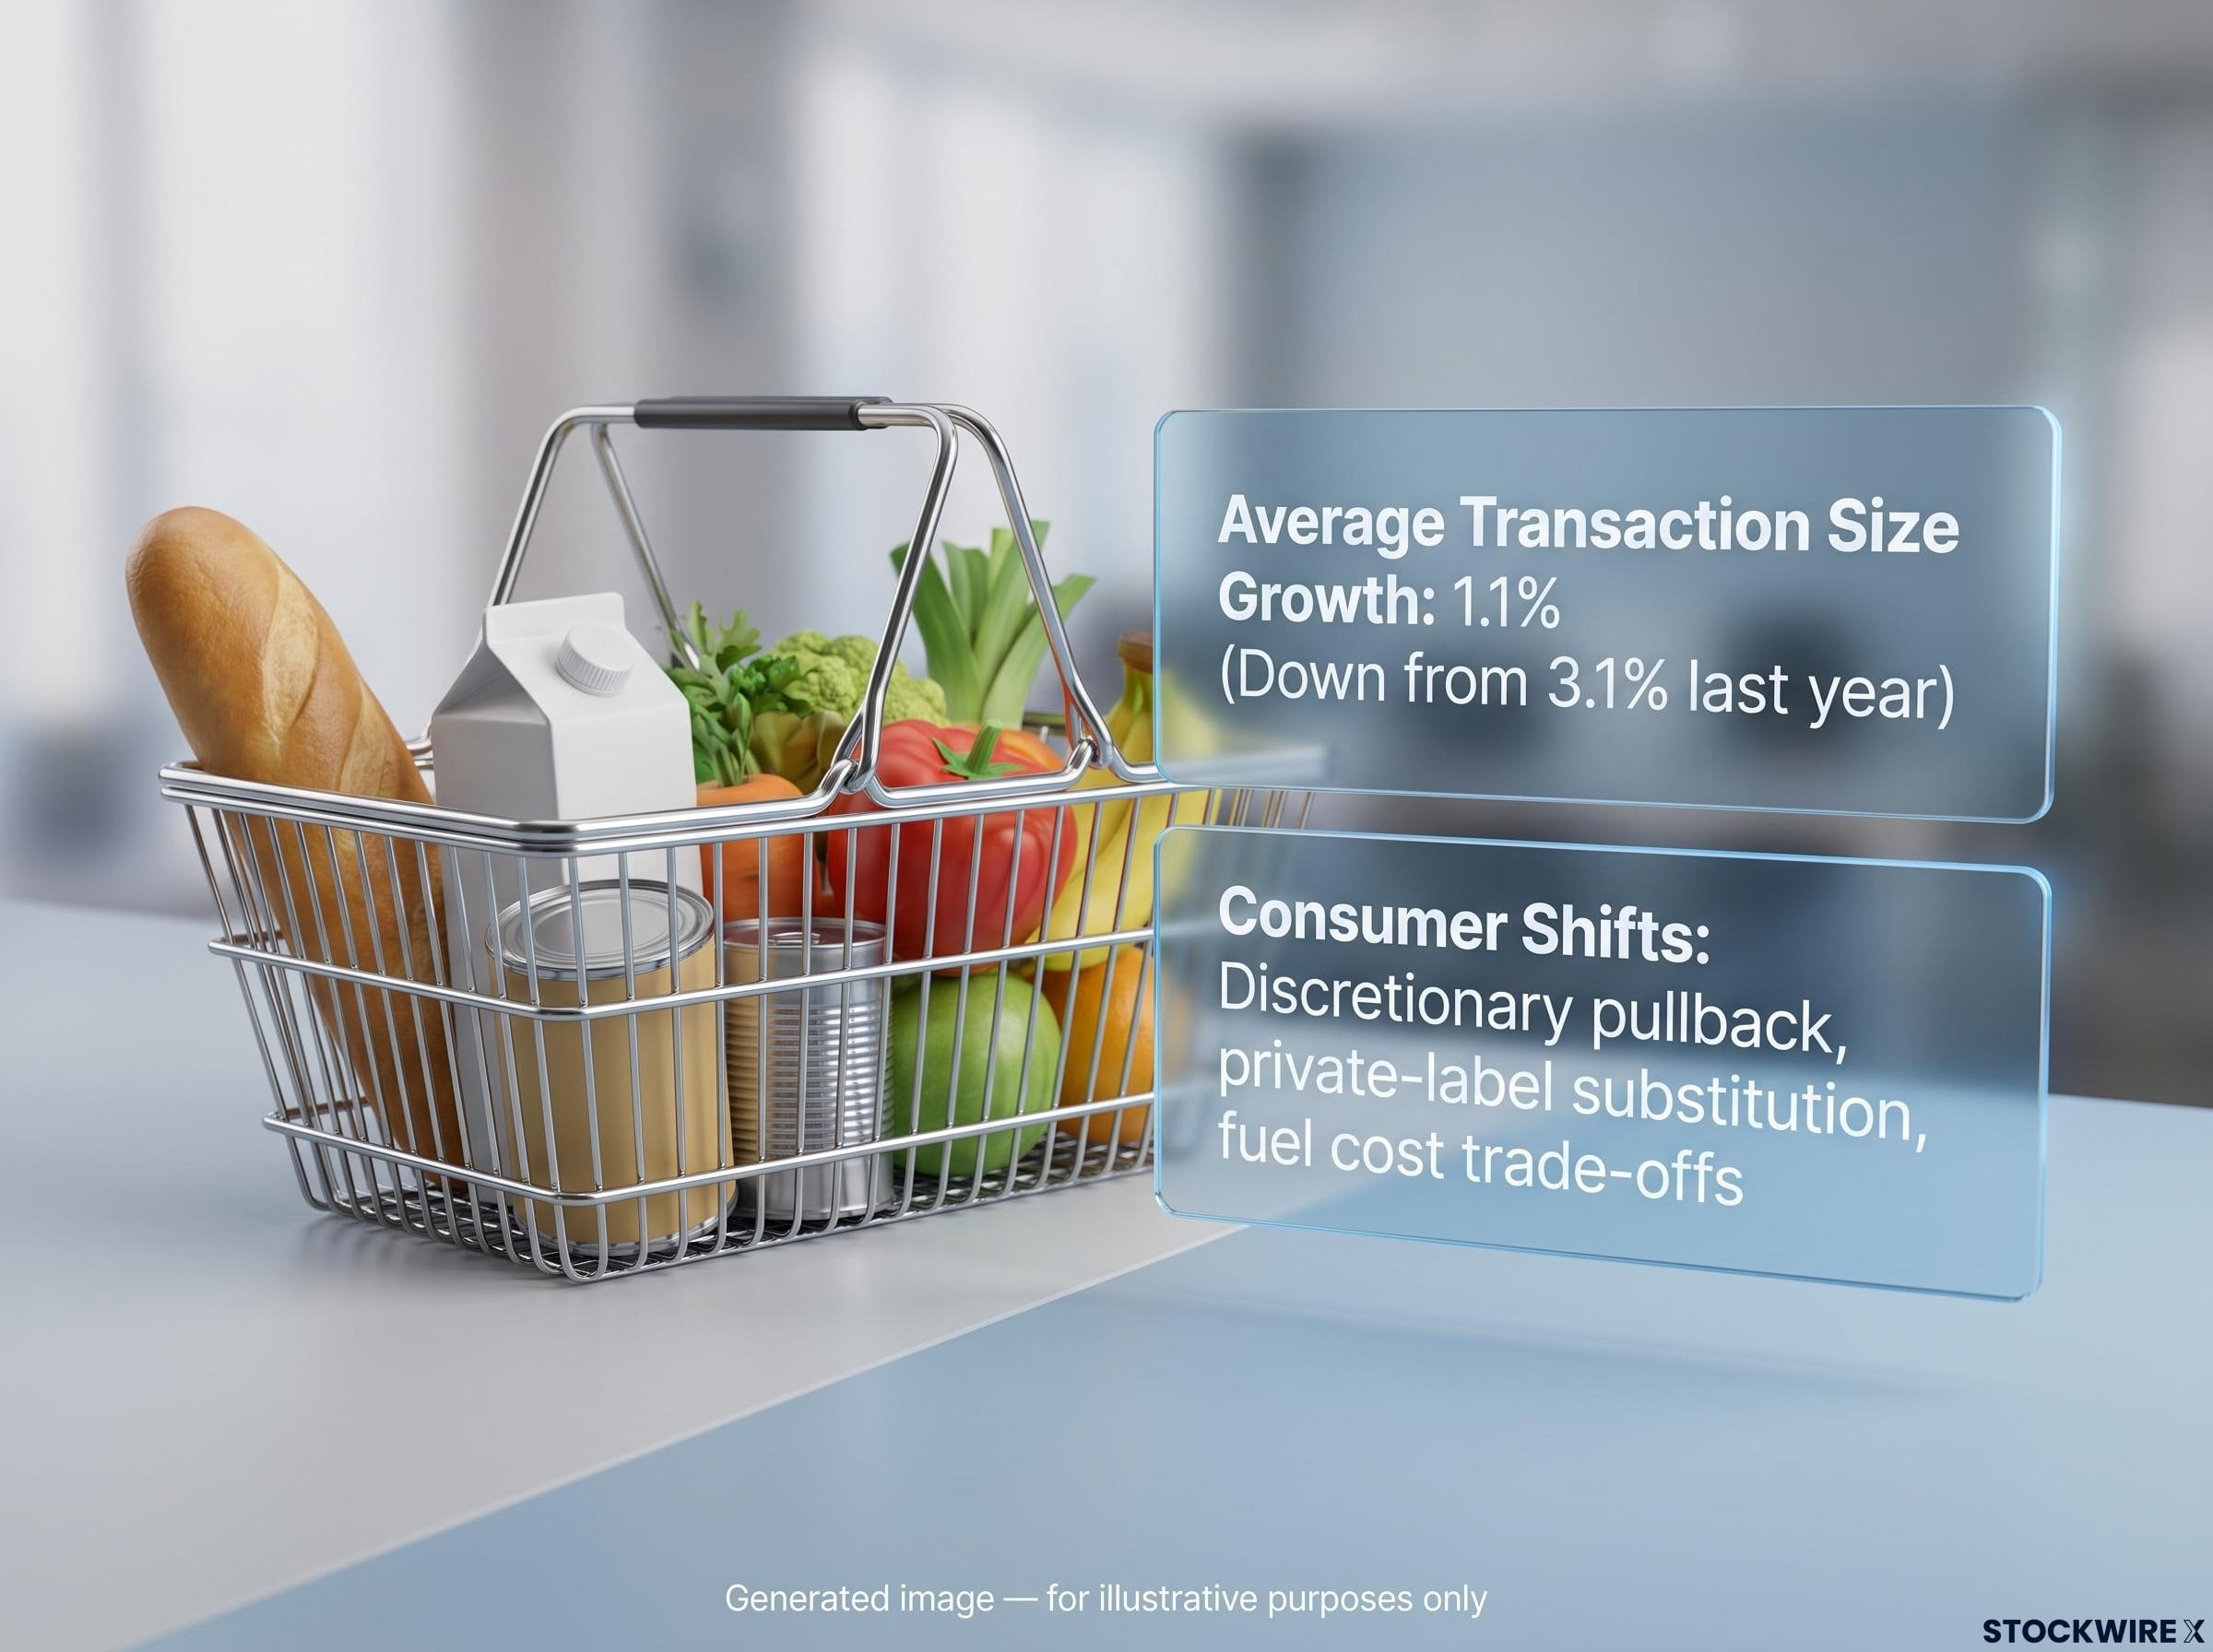
Walmart management explicitly linked fuel prices to customer trade-offs, describing a pattern in which elevated gasoline costs are driving reduced discretionary spending and smaller baskets at the checkout.
When the average basket shrinks and the company’s own executives cite fuel costs as the explanation, you are looking at a real-time transmission mechanism. Energy prices are not an abstract macroeconomic variable here; they are showing up directly in what gets put back on the shelf.
From the Strait of Hormuz to the checkout lane: understanding the oil shock transmission chain
Washington’s announcement of a broad economic isolation campaign against Iran, coupled with naval blockade threats, drove Brent crude through $87 per barrel, reaching its highest point in roughly a month during today’s session. The timing compressed the narrative into a single day: isolation campaign announced Wednesday evening, oil crossing $87 by Thursday morning, Walmart’s earnings reaction by Thursday’s close.
The Strait of Hormuz shipping crisis sits at the origin of the transmission chain: with commercial transits collapsed to 3-14 vessels per day against a pre-war baseline of 120-140, the supply constraint driving Brent through $87 is structural rather than sentiment-driven, and the gap between diplomatic declarations and actual throughput explains why the geopolitical risk premium in crude has proven sticky.
| Stage | Event | Market impact | Consumer impact |
|---|---|---|---|
| 1. Geopolitical escalation | U.S. isolation campaign declared against Iran; naval blockade threatened | Brent crude crosses $87, near one-month high | Energy cost expectations rise |
| 2. Gasoline transmission | Crude price increases feed through to retail fuel prices | Energy sector reprices upward | Household fuel bills rise, particularly for lower-income cohorts |
| 3. Budget compression | Fuel costs absorb larger share of household discretionary budget | Consumer discretionary sector weakens | Trade-offs begin: shoppers cut non-essential purchases |
| 4. Retail data impact | Value retailers report smaller baskets, weaker comp growth | Walmart falls 9%+; consumer staples peers decline in sympathy | Average transaction size growth drops to 1.1% |
Why this is a multi-month story compressed into a single day
Today’s session did not cause the consumer stress. It revealed stress that had been accumulating since the Iran conflict escalated earlier in 2026. The energy-price impact has unfolded over weeks and months, with particularly sharp movements through July and August 2026. One unverified estimate places the cumulative energy cost burden at approximately $750 per household from the conflict escalation; the figure is unconfirmed, but included here for scale of the potential impact.
The geopolitical risk premium in crude oil is not staying in the energy sector. It is moving through gasoline prices into household budgets and showing up in retail data within weeks. For anyone forecasting consumer-sector earnings, oil price movements are now a direct input, not a separate variable.
What Walmart’s results tell investors about the rest of the consumer sector
Walmart is not just a stock. Its scale and customer composition make it an unusually reliable real-time gauge of working- and middle-class financial health. When its management cites fuel prices and basket trade-offs, that commentary functions as forward guidance for the sector, not just for one company.
The market confirmed this reading today. Across the consumer staples sector, stocks pulled the wider market down alongside them, while competing retailers fell in concert. Walmart’s large index weighting amplified the ripple, but the selloff pattern confirmed what institutional money concluded: this was a sector-level signal about the state of the lower-income consumer.
- Target: Watch for comparable deceleration in discretionary categories and any management commentary linking fuel costs to basket behaviour
- Costco: Monitor membership renewal rates and average ticket data for signs that even its higher-income cohort is adjusting spending
- Dollar stores: The most exposed sub-sector; if Walmart’s lower-income shoppers are trading down, dollar store baskets face direct competitive and budget pressure
- Grocery-heavy retailers: Energy-driven food price increases compound the pressure on grocery margins across the sector
On the day, the consumer staples sector fell further than the broader market, with institutional money treating Walmart’s numbers as a read on the macro environment rather than a stumble specific to one retailer.
If you hold any consumer-facing equity, a comparable-sales miss of this scale at Walmart warrants attention to your broader consumer exposure, not just your position in this single name.
For investors reassessing consumer exposure after today’s selloff, our dedicated guide to consumer sector stock valuations examines how the Consumer Discretionary index reached a 20-year low relative to the S&P 500 and where the contrarian case separates mispriced pessimism from genuine value traps.
Three variables to watch before the consumer picture clarifies
The question now is whether the current deceleration is a temporary energy-cost squeeze or the beginning of a more sustained consumer spending contraction. Three specific variables will answer it, and each is trackable in real time:
- Walmart Q3 comparable sales: The next empirical test arrives with the following quarter’s results. A figure below 2.6% would confirm deepening deceleration; stabilisation above 3% would suggest resilience. This is the single most important data point for the consumer stress thesis.
- Brent crude trajectory relative to $87: Today’s $87 level is the reference point. Sustained movement above signals continued consumer pressure through the gasoline transmission chain described above. A sustained reversal below signals potential relief for household budgets, particularly at the lower end.
- Iran ceasefire and blockade developments: The Treasury Secretary has characterised the disruption from the Iran situation as a passing distortion that markets will eventually look through. If that proves correct and a resolution materialises, crude prices should ease and the consumer pressure abates. If the blockade persists or escalates, the transmission chain stays active, and the next round of retail earnings will confirm it.
Iran ceasefire diplomacy has already demonstrated its capacity to move crude by nearly 10% in a single week, with Brent falling below $80 after Geneva talks collapsed in June 2026, a precedent that quantifies the relief a genuine resolution could deliver to household fuel costs and, by extension, to Walmart’s basket data in subsequent quarters.
Together, these three variables form a framework for knowing when the consumer stress story is worsening, stabilising, or reversing. That is more useful than waiting for the next quarterly earnings release to tell you what has already happened.
This article is for informational purposes only and should not be considered financial advice. Investors should conduct their own research and consult with financial professionals before making investment decisions. Forward-looking statements regarding oil prices, consumer spending trends, and company performance are subject to change based on market developments and geopolitical conditions.