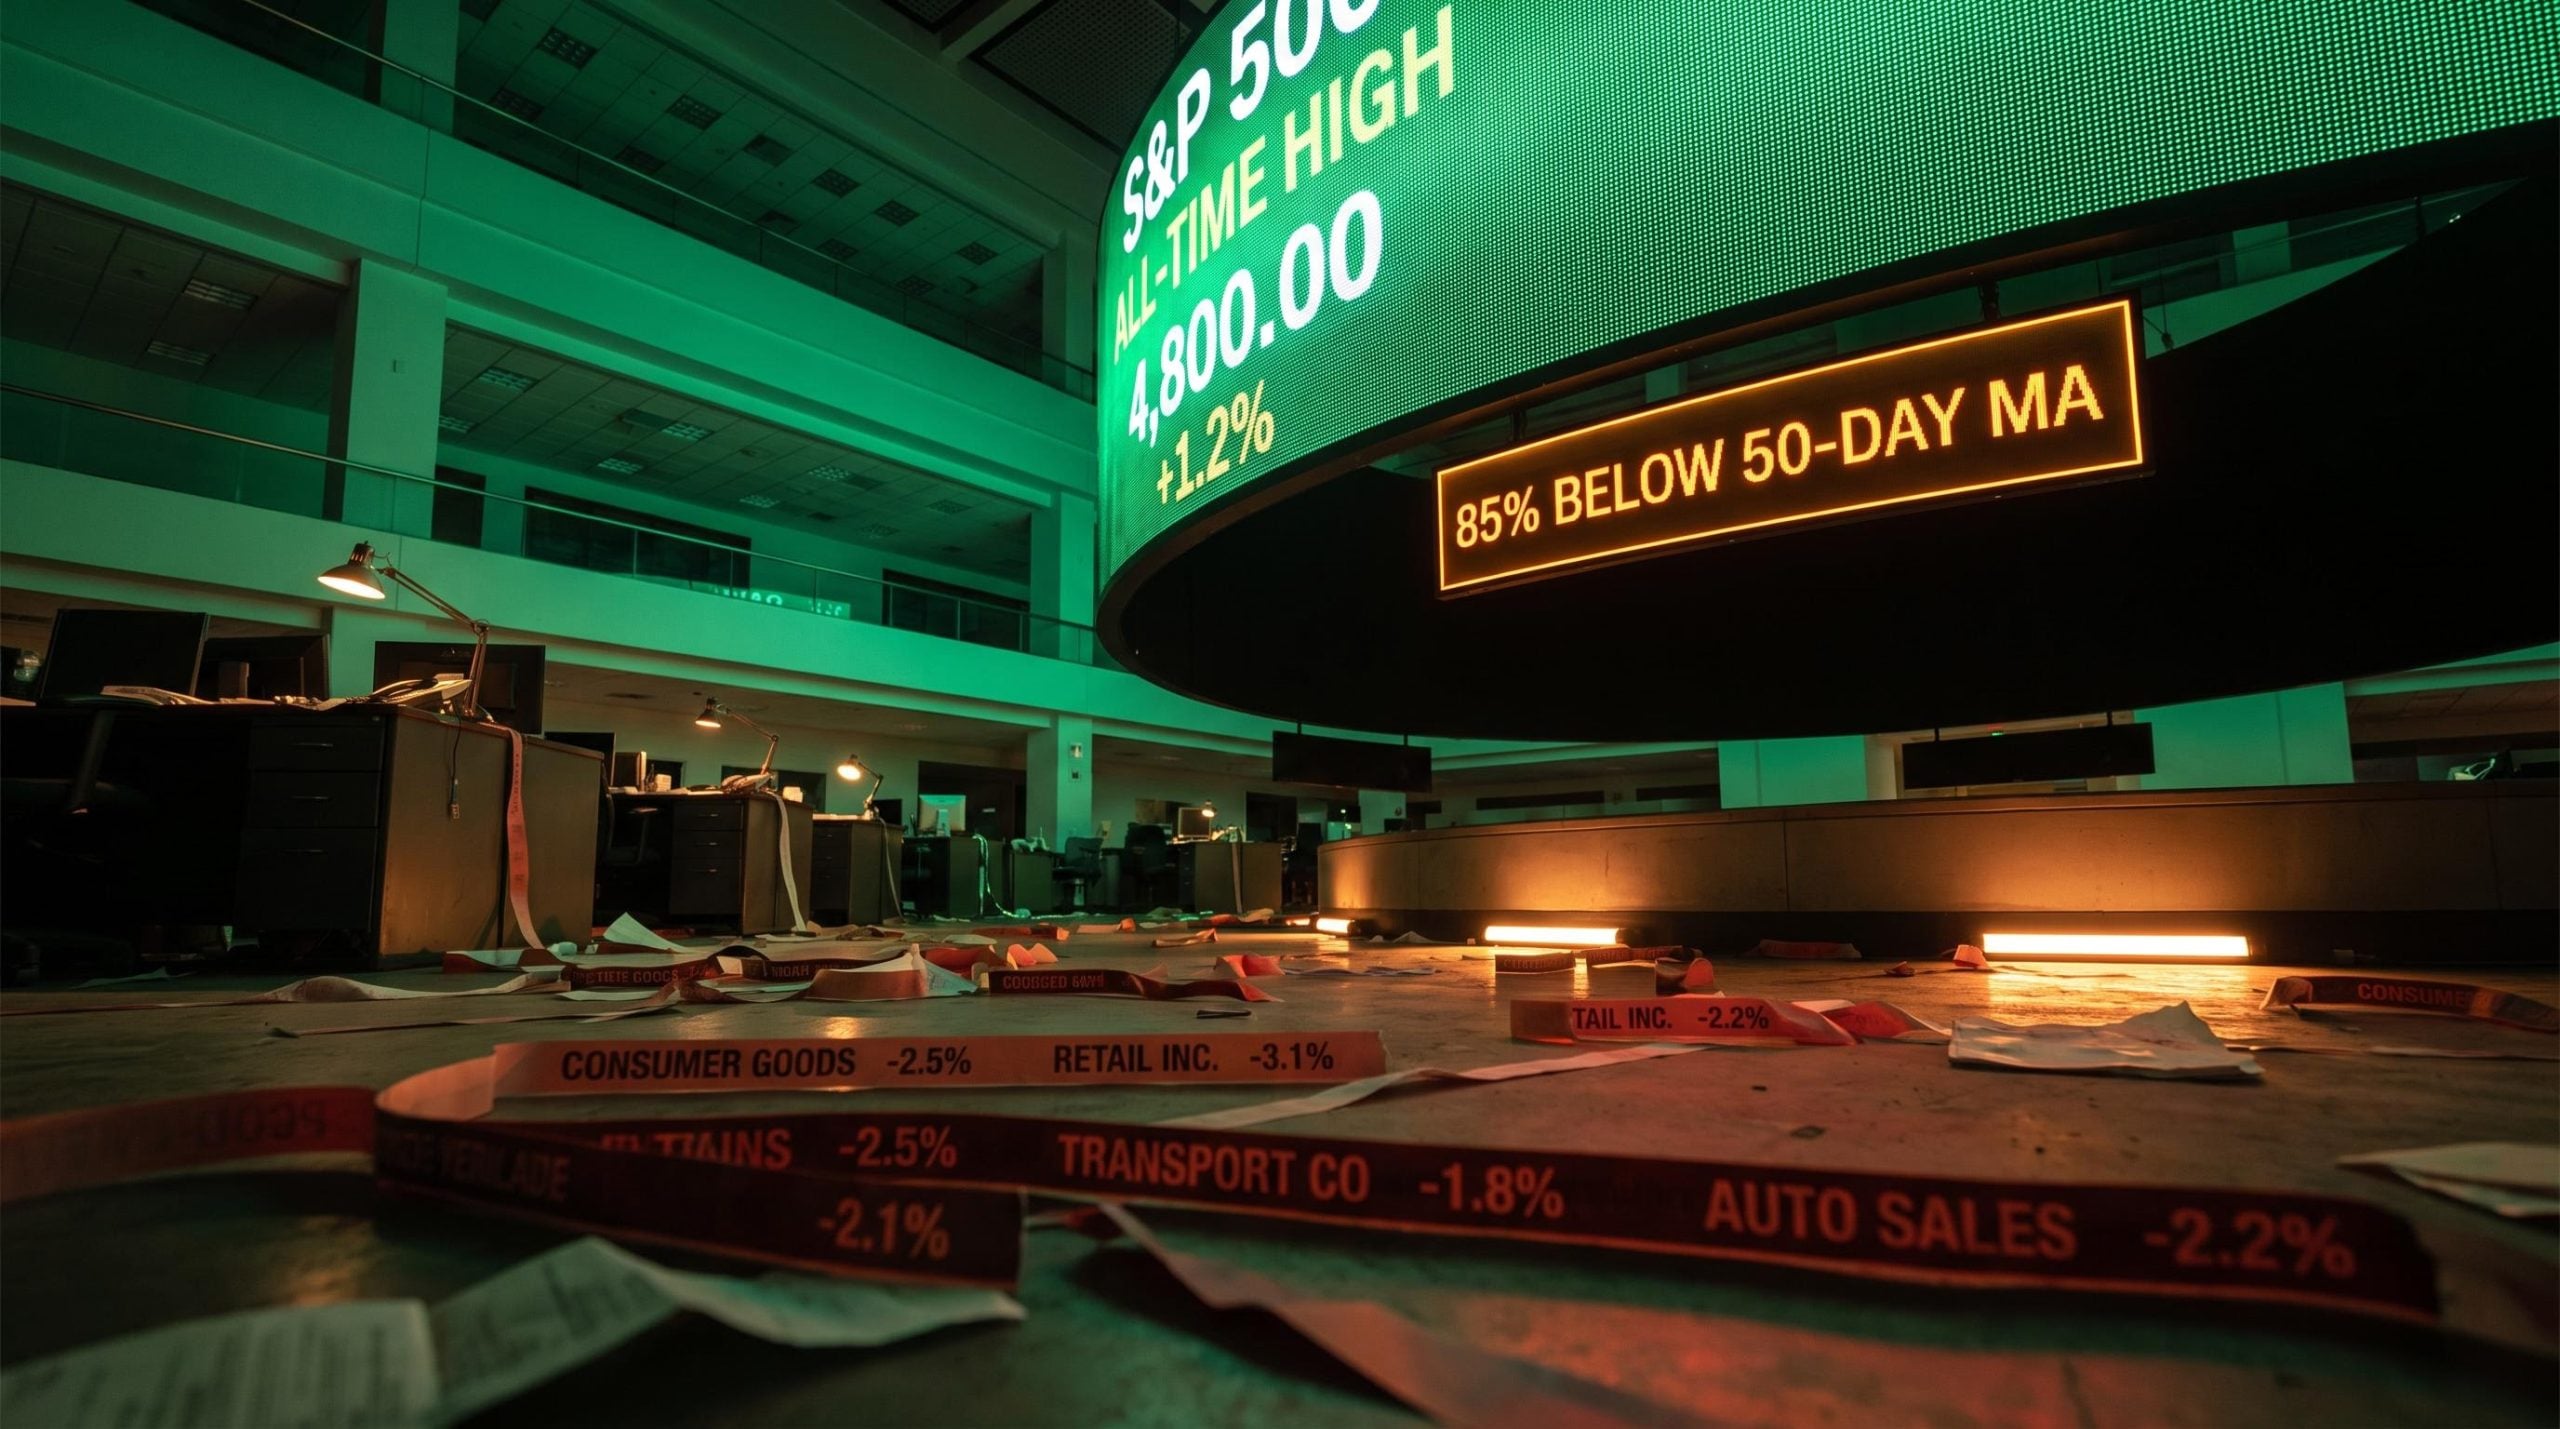
The S&P 500 has spent much of 2026 setting records. Yet the index tracking how Americans spend on clothing, cars, and recreation is in negative territory for the year. That is not a small gap. It is one of the widest disconnects between headline market strength and consumer sector performance in two decades.
The underperformance is real, but its cause is worth interrogating. Consumer confidence surveys sit near historically low readings, below the peaks of the COVID-19 crisis and the months after September 11 2001. Institutional investors have responded by pulling capital from consumer-facing names as though a spending collapse were already confirmed. The spending data, however, tell a more complicated story.
Here is how to read the gap between what markets are pricing and what consumers are actually doing, with a framework for distinguishing mispriced pessimism from genuine structural decay.
How far consumer stocks have actually fallen behind
The numbers through 21 July 2026 set the baseline. According to FactSet data measured from 31 December 2025:
- The S&P 500 total return index posted a positive year-to-date gain
- The Consumer Staples sector index trailed the broader market despite modest positive returns
- The Consumer Discretionary sector index sat in negative territory for the year
The discretionary group was the second-worst performing sector among the S&P 500’s 11 sectors through Q1 2026. A brief defensive rotation into staples earlier in the year offered temporary shelter, but even that move failed to produce sustained excess returns relative to the index.
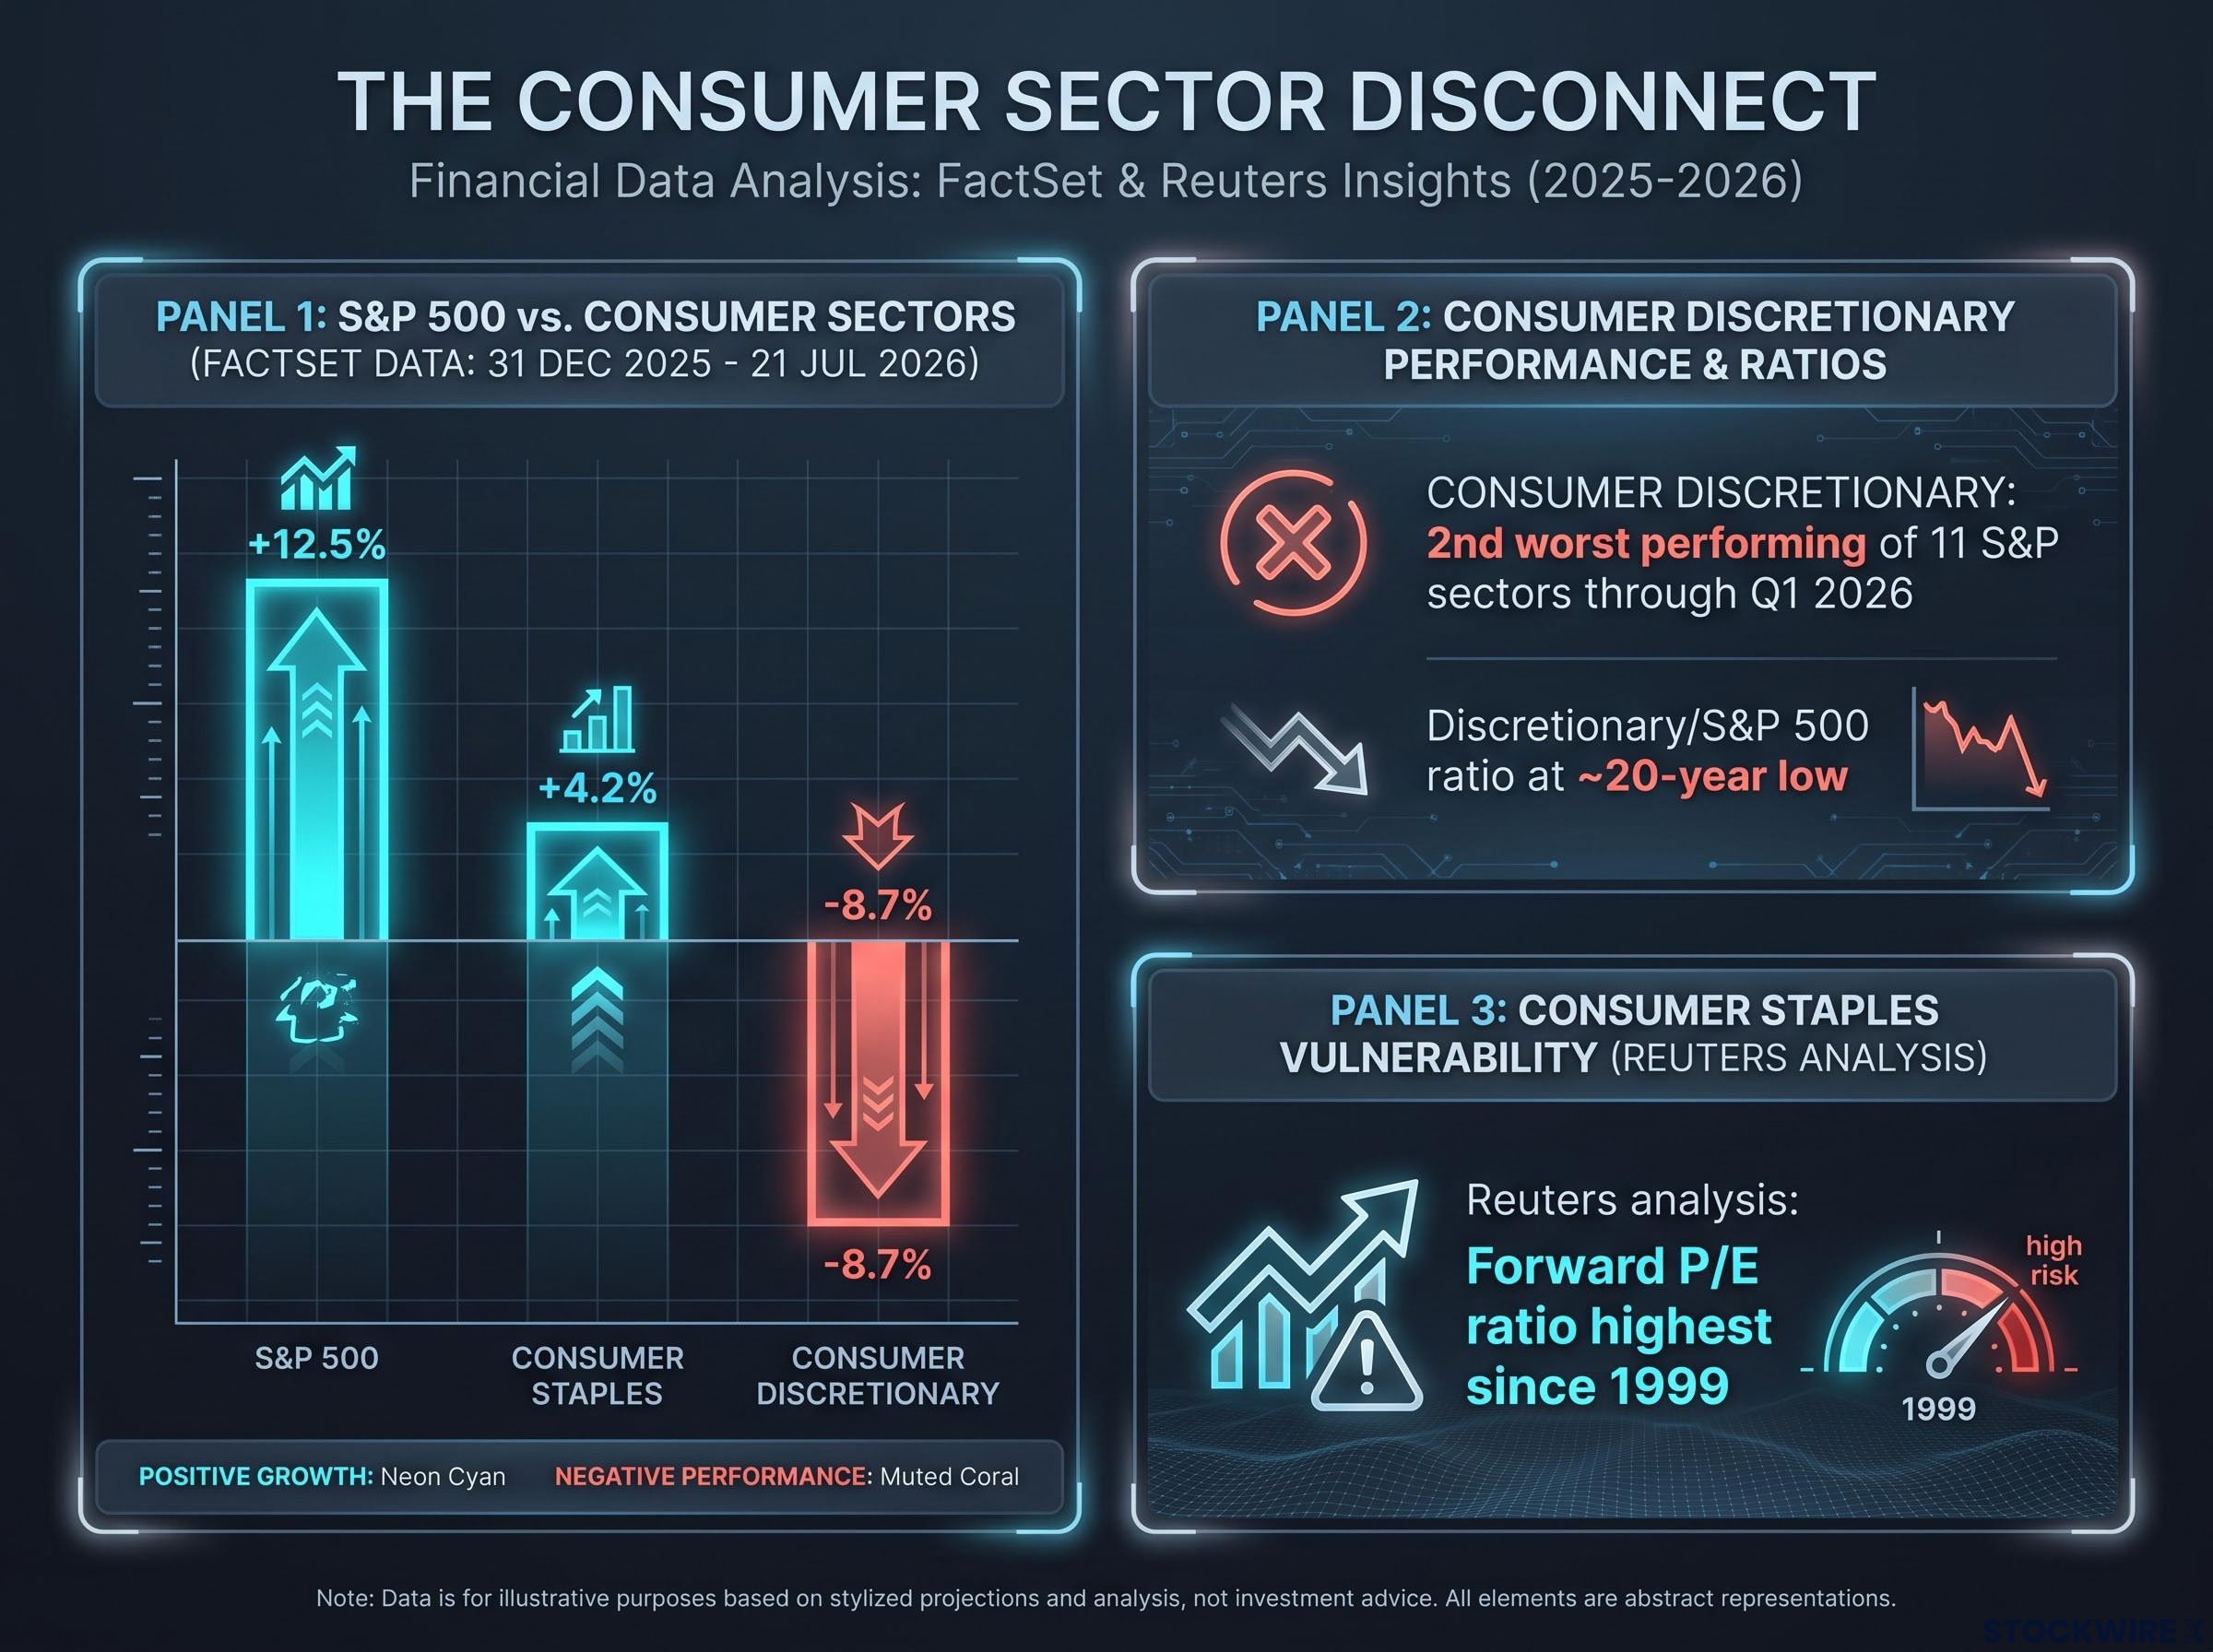
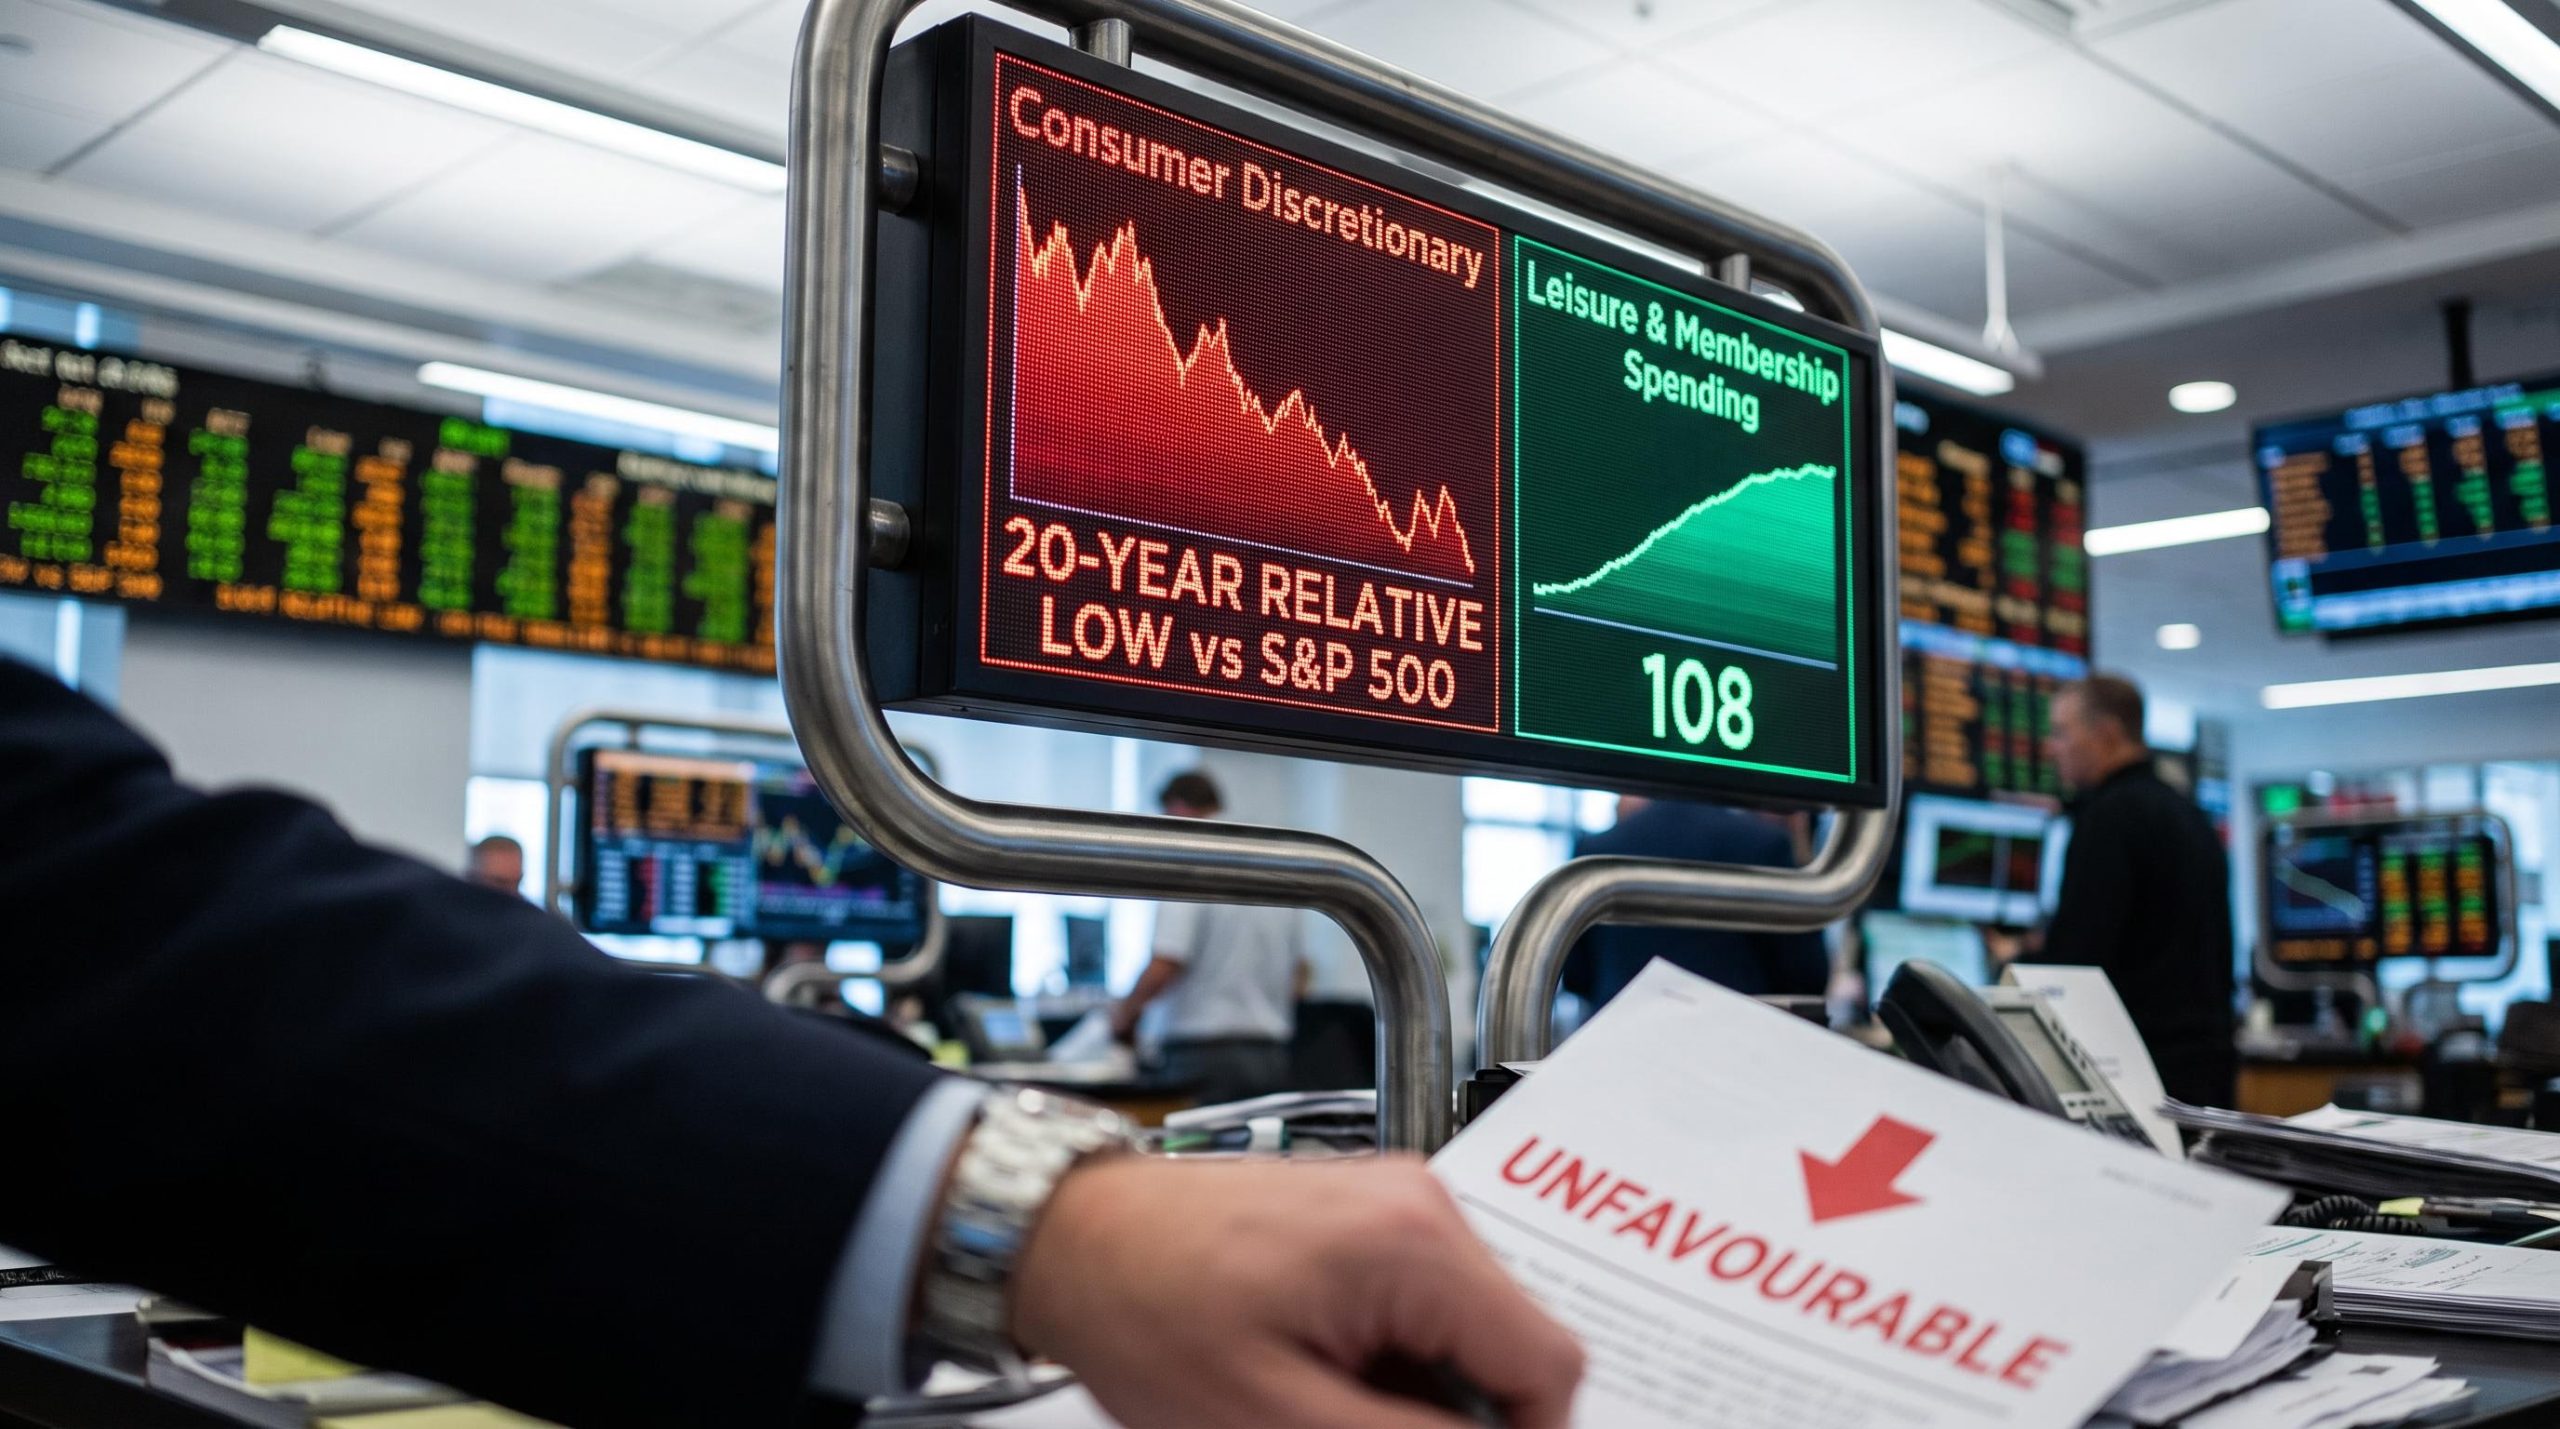
The ratio of Consumer Discretionary to the S&P 500 has fallen to its lowest point in approximately 20 years, a level of relative pessimism that has rarely been this deep in a generation.
That ratio is not a curiosity. It tells you that the market is pricing in a severity of consumer weakness that exceeds virtually every period since the mid-2000s. Whether that pricing is justified is the question the rest of this analysis answers.
When big ASX news breaks, our subscribers know first
What drove the underperformance, and why fears outpaced facts
No single factor explains the sell-off. The pressure accumulated across several layers, each reinforcing the others.
- Inflation and rates: The April 2026 CPI reading came in at a three-year high. Slowing wage growth compressed real wage gains, squeezing discretionary budgets.
- Tariff and geopolitical risk: The Wells Fargo Investment Institute explicitly classified U.S. consumer sectors as “unfavourable,” citing persistent concerns that tariffs would distort purchasing habits and compress margins.
- K-shaped income divergence: Lower-income households face concentrated pressure from food, fuel, and credit costs. Higher-income consumers have been more resilient, though investors worry that a slowdown in this cohort could weaken aggregate demand more materially.
- Sentiment collapse: Consumer confidence surveys place sentiment near its lowest readings on record, below both the COVID-19 peak and post-9/11 levels.
The K-shaped framing contains real elements but overstates the divergence. Fisher Investments editorial analysis and The New York Times reporting by Talmon Joseph Smith and Ben Casselman (dated 16 July 2026) both point to research showing that spending has risen across income groups, with the difference being one of degree rather than direction. What matters to equity markets is the aggregate volume of spending taking place, not which income cohort is responsible for driving it.
The sentiment-market divergence reached its starkest recorded level in April and May 2026, with the University of Michigan index hitting all-time lows while the S&P 500 held near record highs; historical precedent from the 2022 trough suggests these extremes have tended to coincide with market bottoms rather than the onset of sustained declines.
The valuation problem hiding inside the defensives
Consumer Staples, often treated as the safe side of consumer exposure, carried its own vulnerability. A Reuters analysis found that the S&P 500 Consumer Staples index saw its forward price-to-earnings (P/E) ratio, the price investors pay per dollar of expected future earnings, reach its highest level since 1999. That happened alongside deteriorating earnings expectations.
Buyers were paying historically expensive prices for a business outlook that was getting worse. When the defensive bid faded, the multiple compressed, and staples underperformed despite their reputation for stability.
The combination of historically weak sentiment and a near-record P/E in staples tells you the sell-off was not irrational. But it also raises the question: if the fear has been priced in this aggressively, does the actual spending data justify it?
What Americans are actually spending, category by category
FactSet data indexed to January 2025 = 100 and tracked through May 2026 offer a category-level view that complicates the retrenchment narrative.
| Category | Jan 2025 Baseline | Peak / Trend | May 2026 Level |
|---|---|---|---|
| Recreational goods and vehicles | 100 | Peaked near 107 (Nov 2025) | ~104 |
| Membership clubs, sports centres, parks, theatres, museums | 100 | Upward throughout period | ~108 (Apr 2026) |
| Clothing and footwear | 100 | ~104-105 (late 2025) | ~104 |
| Jewellery and watches | 100 | Declined from baseline | ~92 |
Three of the four tracked categories showed growth from the January 2025 baseline. The outlier is jewellery and watches, which fell to approximately 92, representing a clear decline in perceived luxury purchases. But that weakness is category-specific, not a proxy for broad consumer retrenchment.
Household debt dynamics complicate the K-shaped picture further: record credit card balances of $1.28 trillion and a personal savings rate of 4.0% in early 2026 indicate that some of the spending growth in the spending data reflects debt-funded consumption rather than income-supported demand, a distinction that matters when assessing how durable category-level growth will prove.
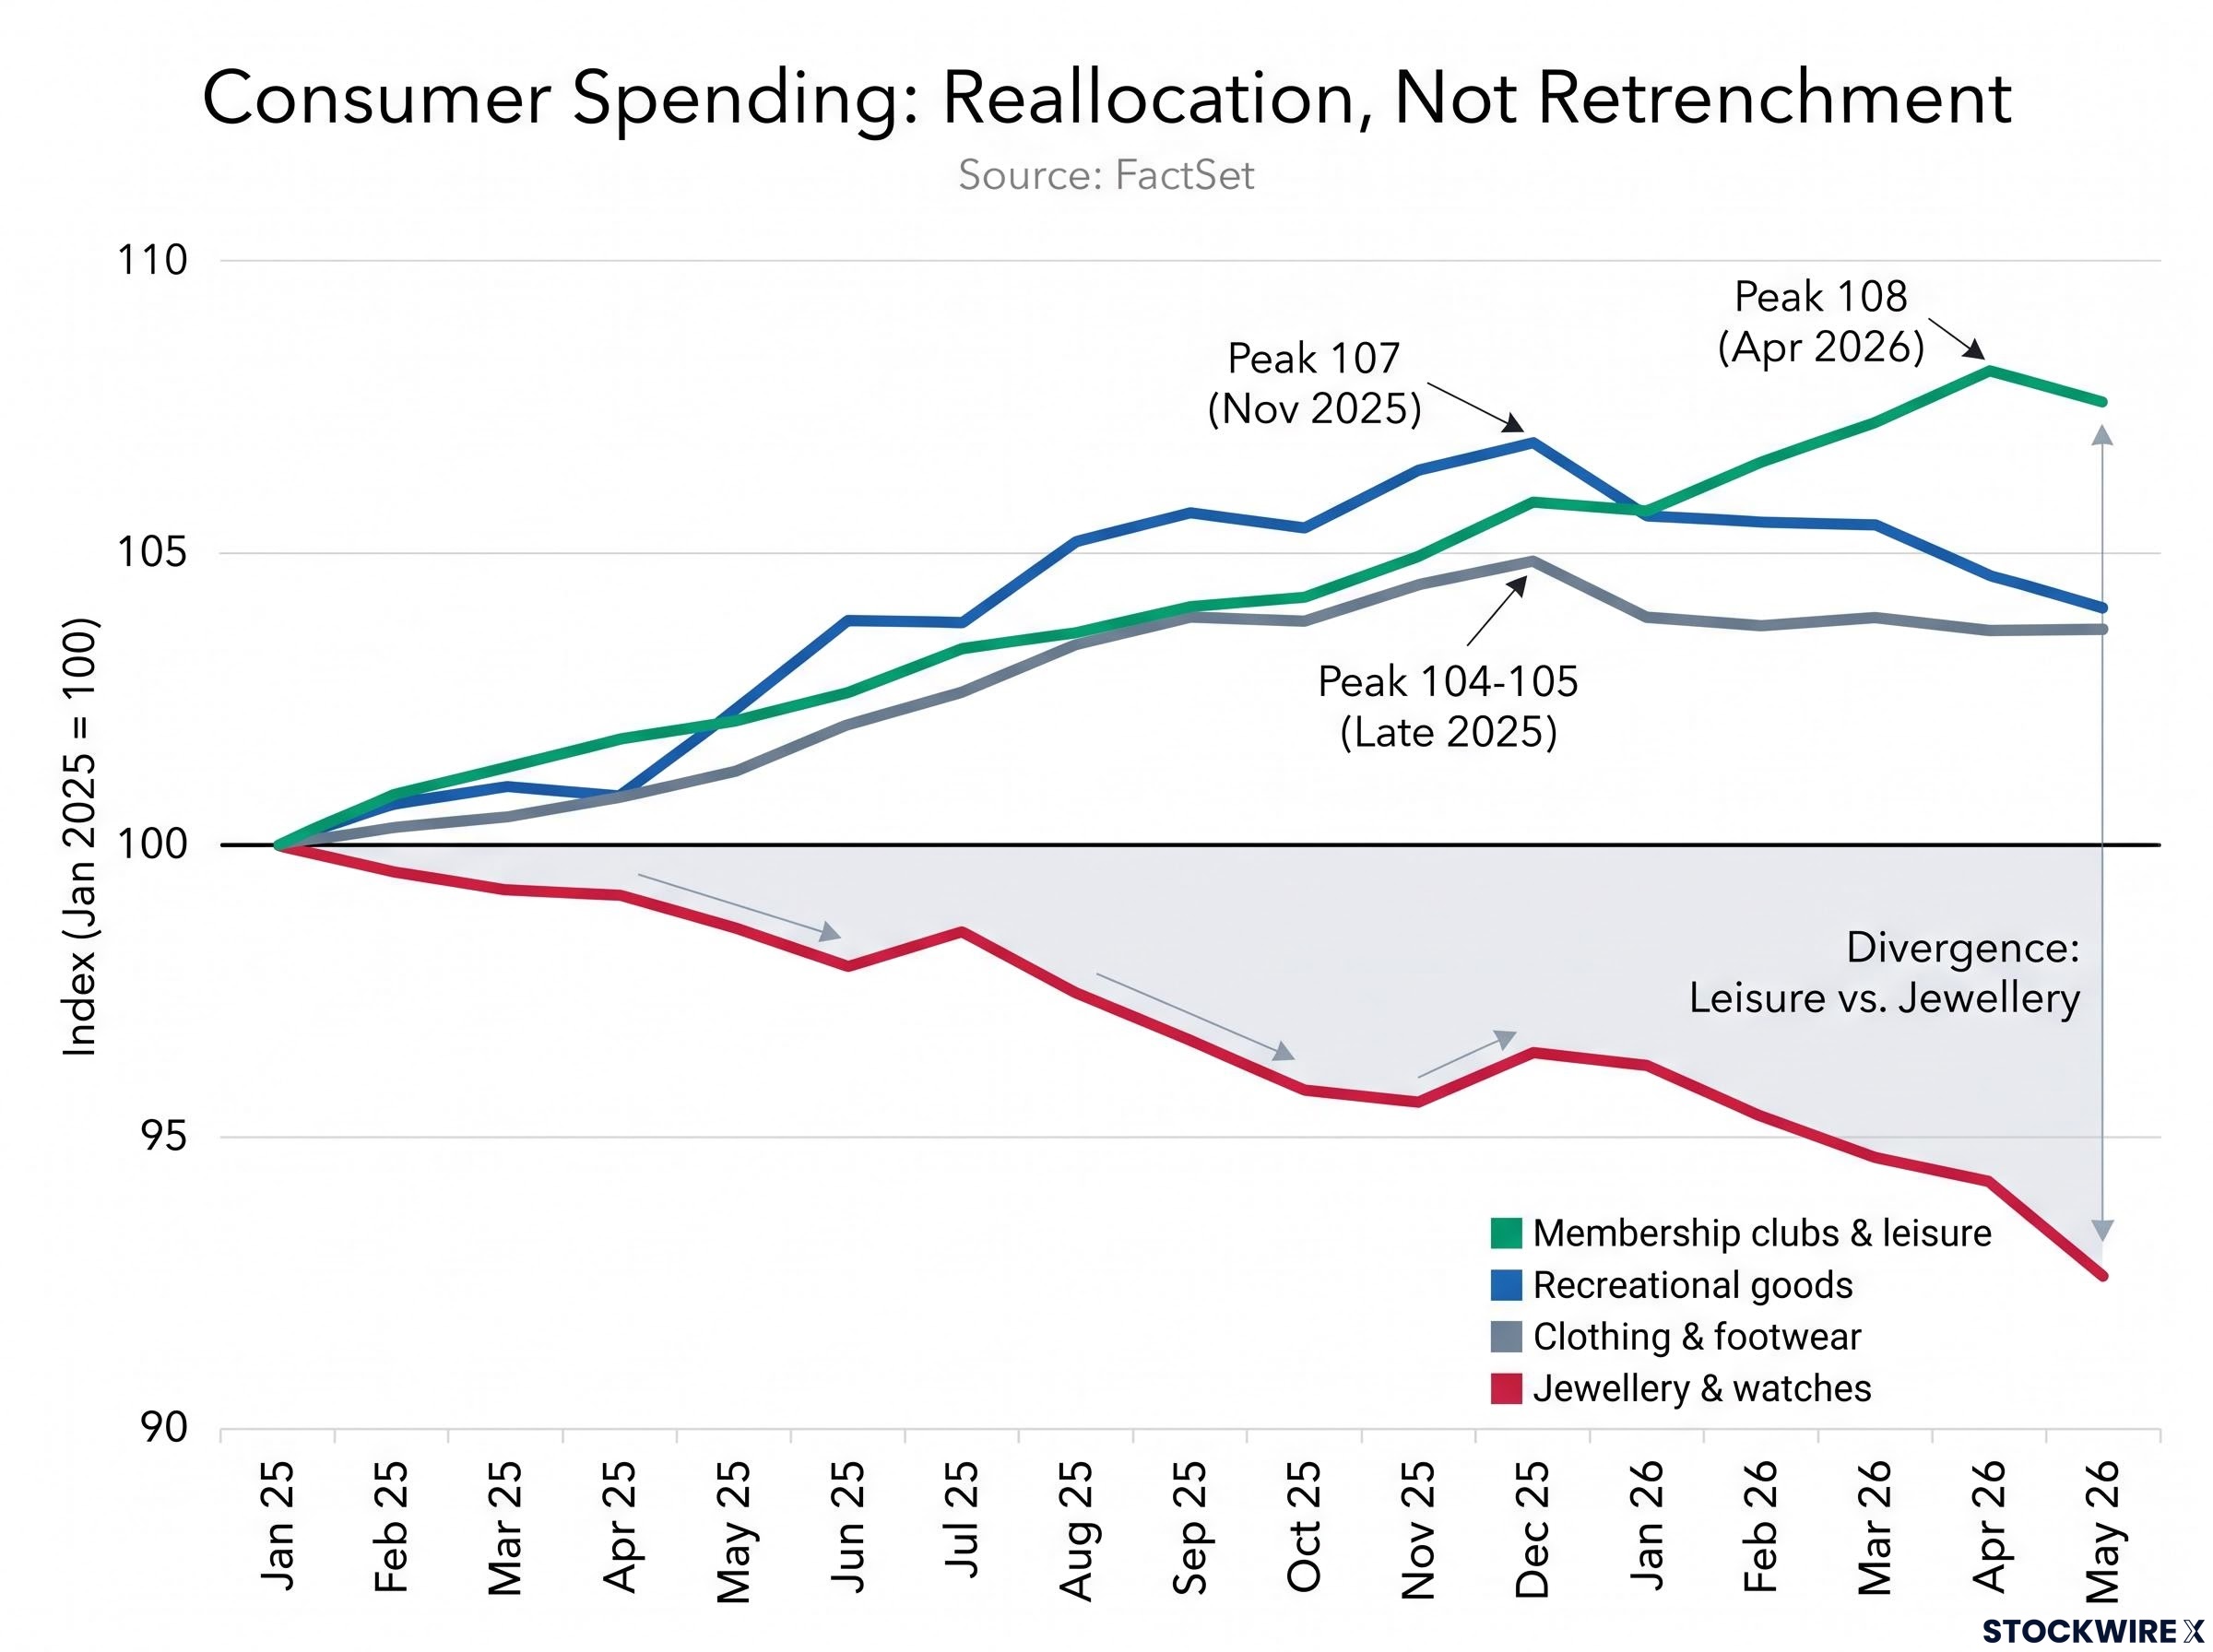
Leisure and membership spending reached approximately 108 by April 2026, the highest endpoint among all tracked categories and the sharpest contradiction of the idea that consumers are cutting back on everything optional.
The divergence between leisure spending (up 8 percentage points from baseline) and jewellery spending (down 8 percentage points) tells you that consumers are not uniformly retrenching. They are actively reallocating. The sector-level pessimism in equity markets blends very different business conditions into a single, misleading signal.
How equity markets price expectations, not outcomes
The gap between spending data and stock performance makes more sense once you understand how equity markets actually set prices. They are expectations machines. What drives returns is not whether conditions are good or bad in absolute terms, but whether outcomes arrive better or worse than what is already priced in.
The mechanism works in three steps:
- Equity prices reflect anticipated future conditions, not current results alone.
- Returns are driven by the gap between what was expected and what actually materialises.
- Extreme pessimism lowers the bar for positive surprises, meaning even a “less bad than feared” outcome functions as upside.
This is where the consumer sector sits right now. Prices already reflect a scenario of sustained demand weakness. If actual consumption merely proves moderate rather than severe, beaten-down names can re-rate higher without needing a strong macro tailwind.
Several consumer names have fallen into technically oversold territory, with relative strength index (RSI) readings below 30 during recent pullbacks. RSI is a momentum indicator that measures the speed and magnitude of recent price changes; readings below 30 suggest selling has become excessive relative to fundamentals. That is one of the conditions contrarian investors monitor for potential mean reversion.
The comparative bar matters too. Technology names riding the AI wave carry such elevated expectations that delivering further upside surprises grows harder with each passing quarter. Consumer names enter from the opposite position, where depressed expectations mean actual results need only avoid catastrophe to read as positive. That asymmetry favours those buying into pessimism rather than chasing momentum.
Equity sentiment indicators across the broader market add a cross-sectional dimension to the consumer-specific pessimism: Goldman Sachs’s U.S. Equity Sentiment Indicator reached 1.7 in May 2026, a reading historically associated with below-average S&P 500 returns over the following two to eight weeks, even as underlying earnings growth tracked at 16%.
A framework for deciding whether this is opportunity or a value trap
The analytical case for selective interest in consumer sector stocks is not a case for buying everything with a consumer label. Five questions separate a genuine contrarian setup from a value trap:
- What does the current price already assume about demand, and is that assumption worse than what the spending data support?
- Does the business have pricing power and brand strength sufficient to protect margins even if macro conditions do not improve materially?
- Which spending category is the business most exposed to: the growing ones (leisure, recreation, apparel) or the declining ones (luxury goods)?
- How dependent is the business on the most financially stressed lower-income consumer cohort versus the more resilient middle- and upper-income segments?
- Does the balance sheet support the business through an extended period of subdued demand, or does it require macro improvement to remain solvent?
Stephens Research‘s 2026 “Best Ideas” list applies exactly this selectivity, highlighting consumer companies with strong franchises and solid balance sheets whose performance is expected to be driven by execution and market share gains rather than broad economic tailwinds.
The catalysts that could change the picture in either direction
On the upside, cooling inflation, tariff de-escalation, stabilising real wages, and fading geopolitical headwinds could each relieve pressure on consumer earnings expectations. As tariff concerns and geopolitical tensions recede, analysts expect the substitution behaviour that has weighed on consumer-facing businesses to diminish, providing a gradual lift to revenues and margins.
On the downside, renewed tariff escalation, sustained CPI pressure, or a meaningful slowdown among upper-income consumers, the cohort currently supporting aggregate spending, would validate the pessimism currently priced in. These are monitoring conditions, not predictions.
This article is for informational purposes only and should not be considered financial advice. Investors should conduct their own research and consult with financial professionals before making investment decisions. Past performance does not guarantee future results.
What the spending data and the sector gap are telling investors right now
The analytical through-line is straightforward. The Consumer Discretionary index is negative year-to-date through 21 July 2026, according to FactSet. Yet leisure spending has grown to approximately 108 from the January 2025 baseline. Three of four tracked discretionary categories show expansion. The 20-year relative low in the Consumer Discretionary to S&P 500 ratio tells you how much pessimism is already embedded in prices.
That does not make the sector a simple buy. The Wells Fargo Investment Institute‘s “unfavourable” classification reflects the institutional consensus the contrarian view is positioned against, and that consensus has legitimate macro reasons behind it.
The consumer sector in 2026 is not a sector-wide re-rating trade. It is a stock-picking exercise where brand strength, category exposure, and pricing power are the discriminating variables. The question worth carrying away is not “is the consumer sector cheap?” but a more specific one: which businesses within it are priced for a demand deterioration that the actual spending data do not yet support?