Oil prices pushed to US$93 per barrel on 21 August 2026, their strongest level in nearly a month, as a 19.5% surge from the 4 August low compressed into under three weeks. The move was not driven by demand. It was driven by a waterway that handles a significant share of the world’s seaborne oil, a sweeping U.S. sanctions campaign, and a market pricing in the possibility that the situation gets worse before it stabilises.
A broad U.S. sanctions offensive, aimed at Iranian banks, commercial entities, shipping registries, and cash transfer networks, arrived as the Strait of Hormuz was already functioning at a fraction of its normal vessel throughput. The combination has pushed crude into territory that historically translates into meaningful upward pressure on headline inflation, creating a secondary problem for bond markets already contending with structural deficit concerns and elevated long-dated Treasury yields.
Here is the full picture: the mechanics of the disruption, why the oil price surge is responding the way it is, what sustained elevated crude means for inflation expectations and Fed policy room, and how investors are positioned heading into the next phase of this geopolitical event.
How the Strait of Hormuz became the world’s most watched shipping lane
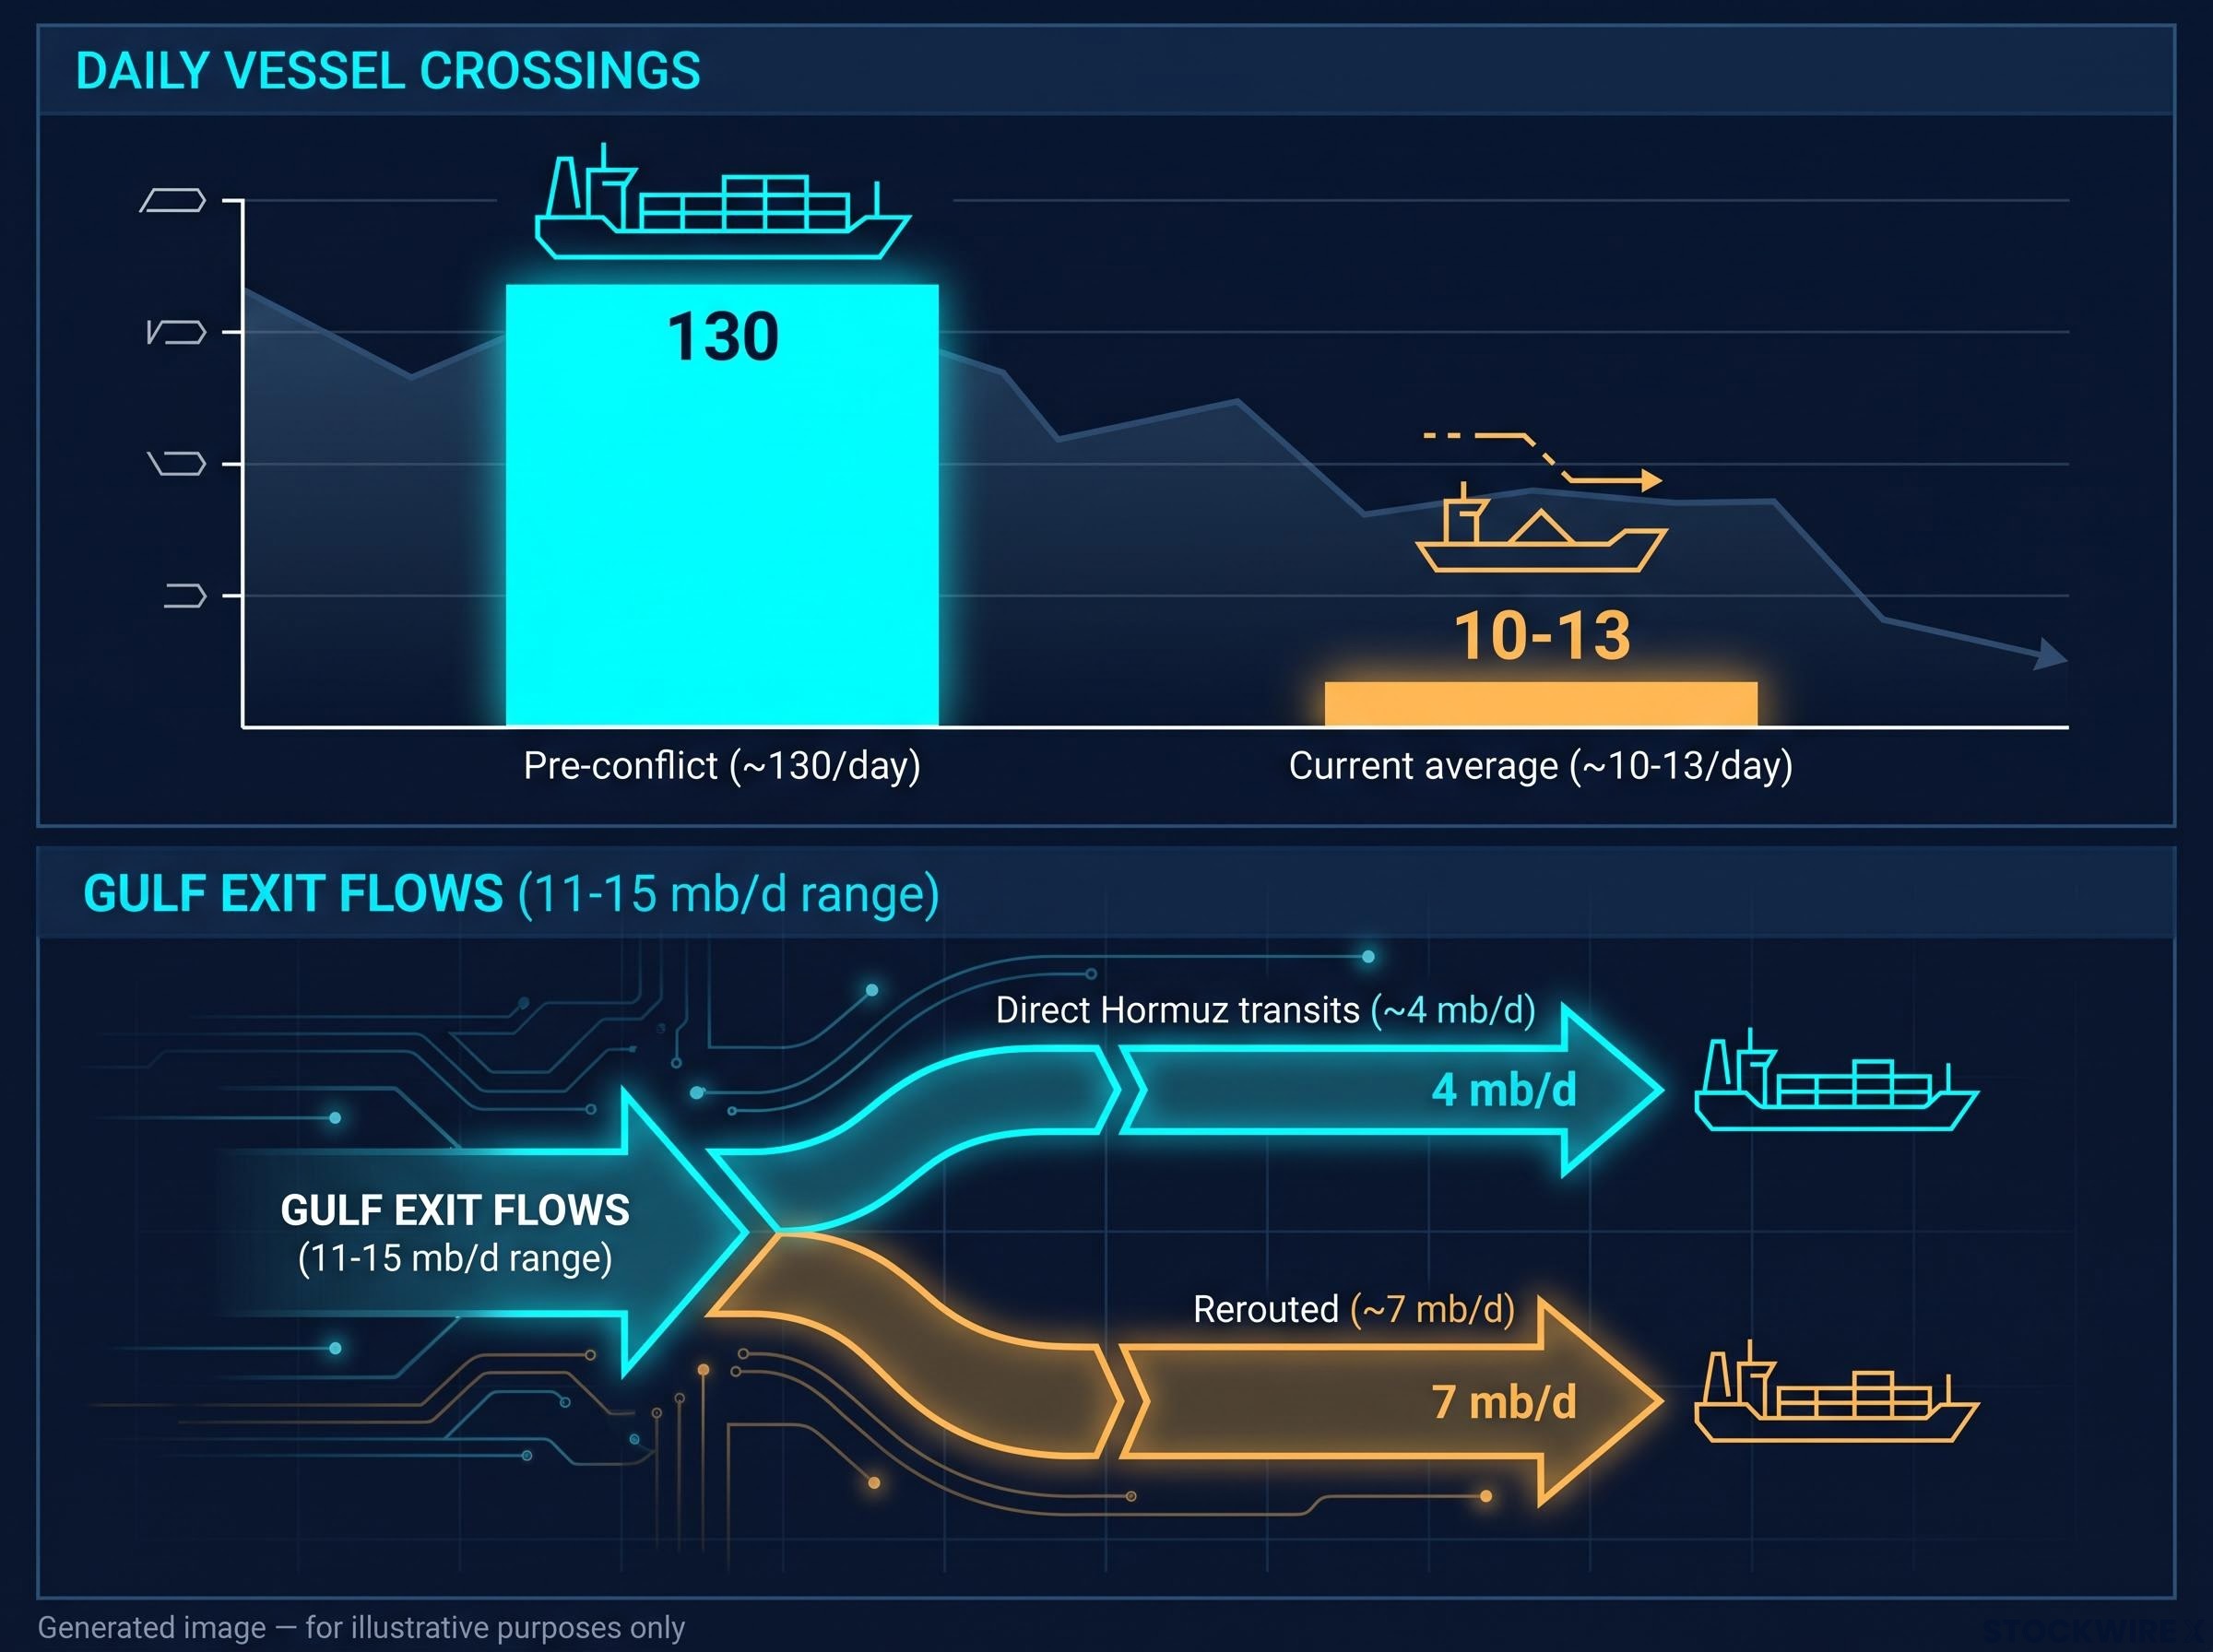
Prior to the conflict, total vessel crossings through the Strait of Hormuz ran at around 130 per day across all ship categories. That was normal. Tankers, commodity carriers, and container ships moved through the narrow waterway with the regularity of commuter traffic.
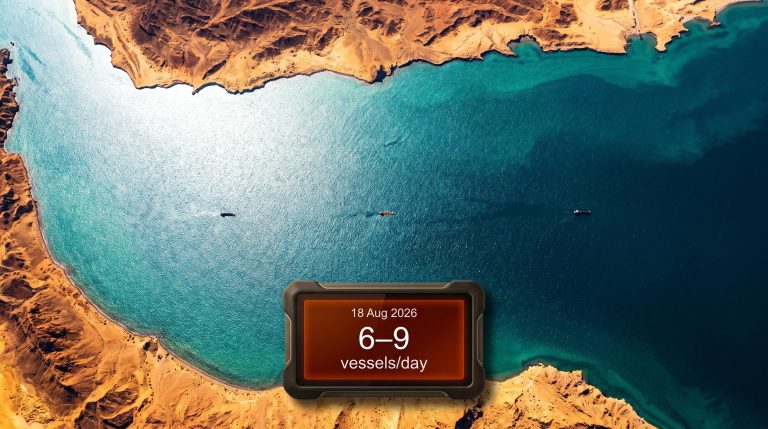
The current picture is unrecognisable. Observed commodity vessel transits now average approximately 10-13 per day on a sustained basis, according to Reuters and CNBC data, with a five-day average of roughly 13 ships. One recent Thursday recorded just 9.
CNN estimates current traffic at approximately 20% of pre-war levels.
The averages, however, mask something worse. Weekend traffic has collapsed episodically to near-zero: 5 commodity vessels on one recent Saturday, zero on the following Sunday, compared with 31 vessels the prior weekend. Kpler data also shows that very large crude carriers (VLCCs), the vessels responsible for the biggest individual crude shipments, have recorded only around 2-3 Hormuz crossings each day since 7 July.
| Metric | Pre-conflict | Current period |
|---|---|---|
| Daily vessel crossings (all types) | ~130 | ~10-13 average |
| Weekend low (single day) | Consistent with daily average | 0-5 vessels |
| VLCC transits per day | Normal commercial flow | ~2-3 (since 7 July) |
Those episodic weekend collapses are the detail that matters most. They tell you the system is not at a stable low; it is at an unstable one, where a single escalatory event could tip fragile averages into something materially worse.
Hormuz shipping throughput data tells a story that official declarations do not: commercial transits have collapsed to as few as 3-14 vessels per day against a pre-war baseline of 120-140, with war-risk insurance premiums running at approximately 30 times normal rates and maritime unions classifying the waterway as an active war zone.
When big ASX news breaks, our subscribers know first
The sanctions architecture: what “economic D-Day” actually targets
The Trump administration’s sanctions package is sweeping by design. It targets:
- Iranian financial institutions
- Commercial entities
- Shipping registries
- Cash transfer and smuggling networks
Trump described the campaign publicly as an “economic D-Day,” framing it as a compellence strategy aimed at forcing Iran to negotiate over the Strait of Hormuz. He posted on Truth Social that nations seen as providing economic assistance to Iran would face severe financial consequences.
The architecture operates on two levels. Primary sanctions target Iranian entities directly. Secondary sanctions extend the pressure extraterritorially, forcing third countries with Iranian energy or trade ties into a binary choice: maintain access to U.S. capital markets and the dollar financial system, or continue benefiting from discounted Iranian crude. That binary is where the emerging market risk lives.
The OFAC sanctions on IRGC-backed maritime networks, published in late July 2026, extend the campaign beyond financial institutions to cover vessels actively transporting Iranian crude and petrochemical products, tightening the chokepoint between the sanctions architecture and observed Hormuz shipping behaviour.
U.S. officials have cited approximately 9 mb/d flowing through Hormuz. Analyst and vessel-tracking data places direct Hormuz transits closer to 4 mb/d, with the remainder accounted for by rerouted and pipeline flows.
That 5 mb/d gap is not a rounding difference. It tells you that the U.S. government and energy market participants are working from materially different pictures of the same waterway, and the distinction matters for how the market will respond to any diplomatic signal. Baghdad’s appeal to Tehran for special transit arrangements, given that oil receipts account for around 90% of the Iraqi government’s budget, shows how rapidly the economic pressure fans outward beyond the two principal parties.
Oil flows, rerouting, and why prices are elevated but not catastrophic
Start with the number that sounds most alarming: direct Hormuz transits are running at approximately 4 mb/d. That is a fraction of pre-conflict flow.
Now layer in the offset. Approximately 7 mb/d is exiting the Gulf via alternative routes: Omani coastal passages, pipelines, and ship-to-ship transfers. More than 80% of liquids transits have shifted to these alternatives. The combined flow picture, Hormuz direct plus rerouted, sits in a range of 11-15 mb/d, with at least one day on 8 August exceeding 20 mb/d as an outlier.
| Flow component | Estimated volume | Status |
|---|---|---|
| Direct Hormuz transits | ~4 mb/d | Sustained, fragile |
| Rerouted (Omani, pipeline, dark) | ~7 mb/d | Near capacity ceiling |
| Combined Gulf exit | 11-15 mb/d range | Insufficient to replace pre-conflict throughput |
This is partly reassuring and partly not. The rerouting explains why Brent is at US$93.20 rather than US$120. But dependence on Omani routes and dark transits means the market has no redundancy left. Any further disruption to those alternatives would be transmitted directly into price.
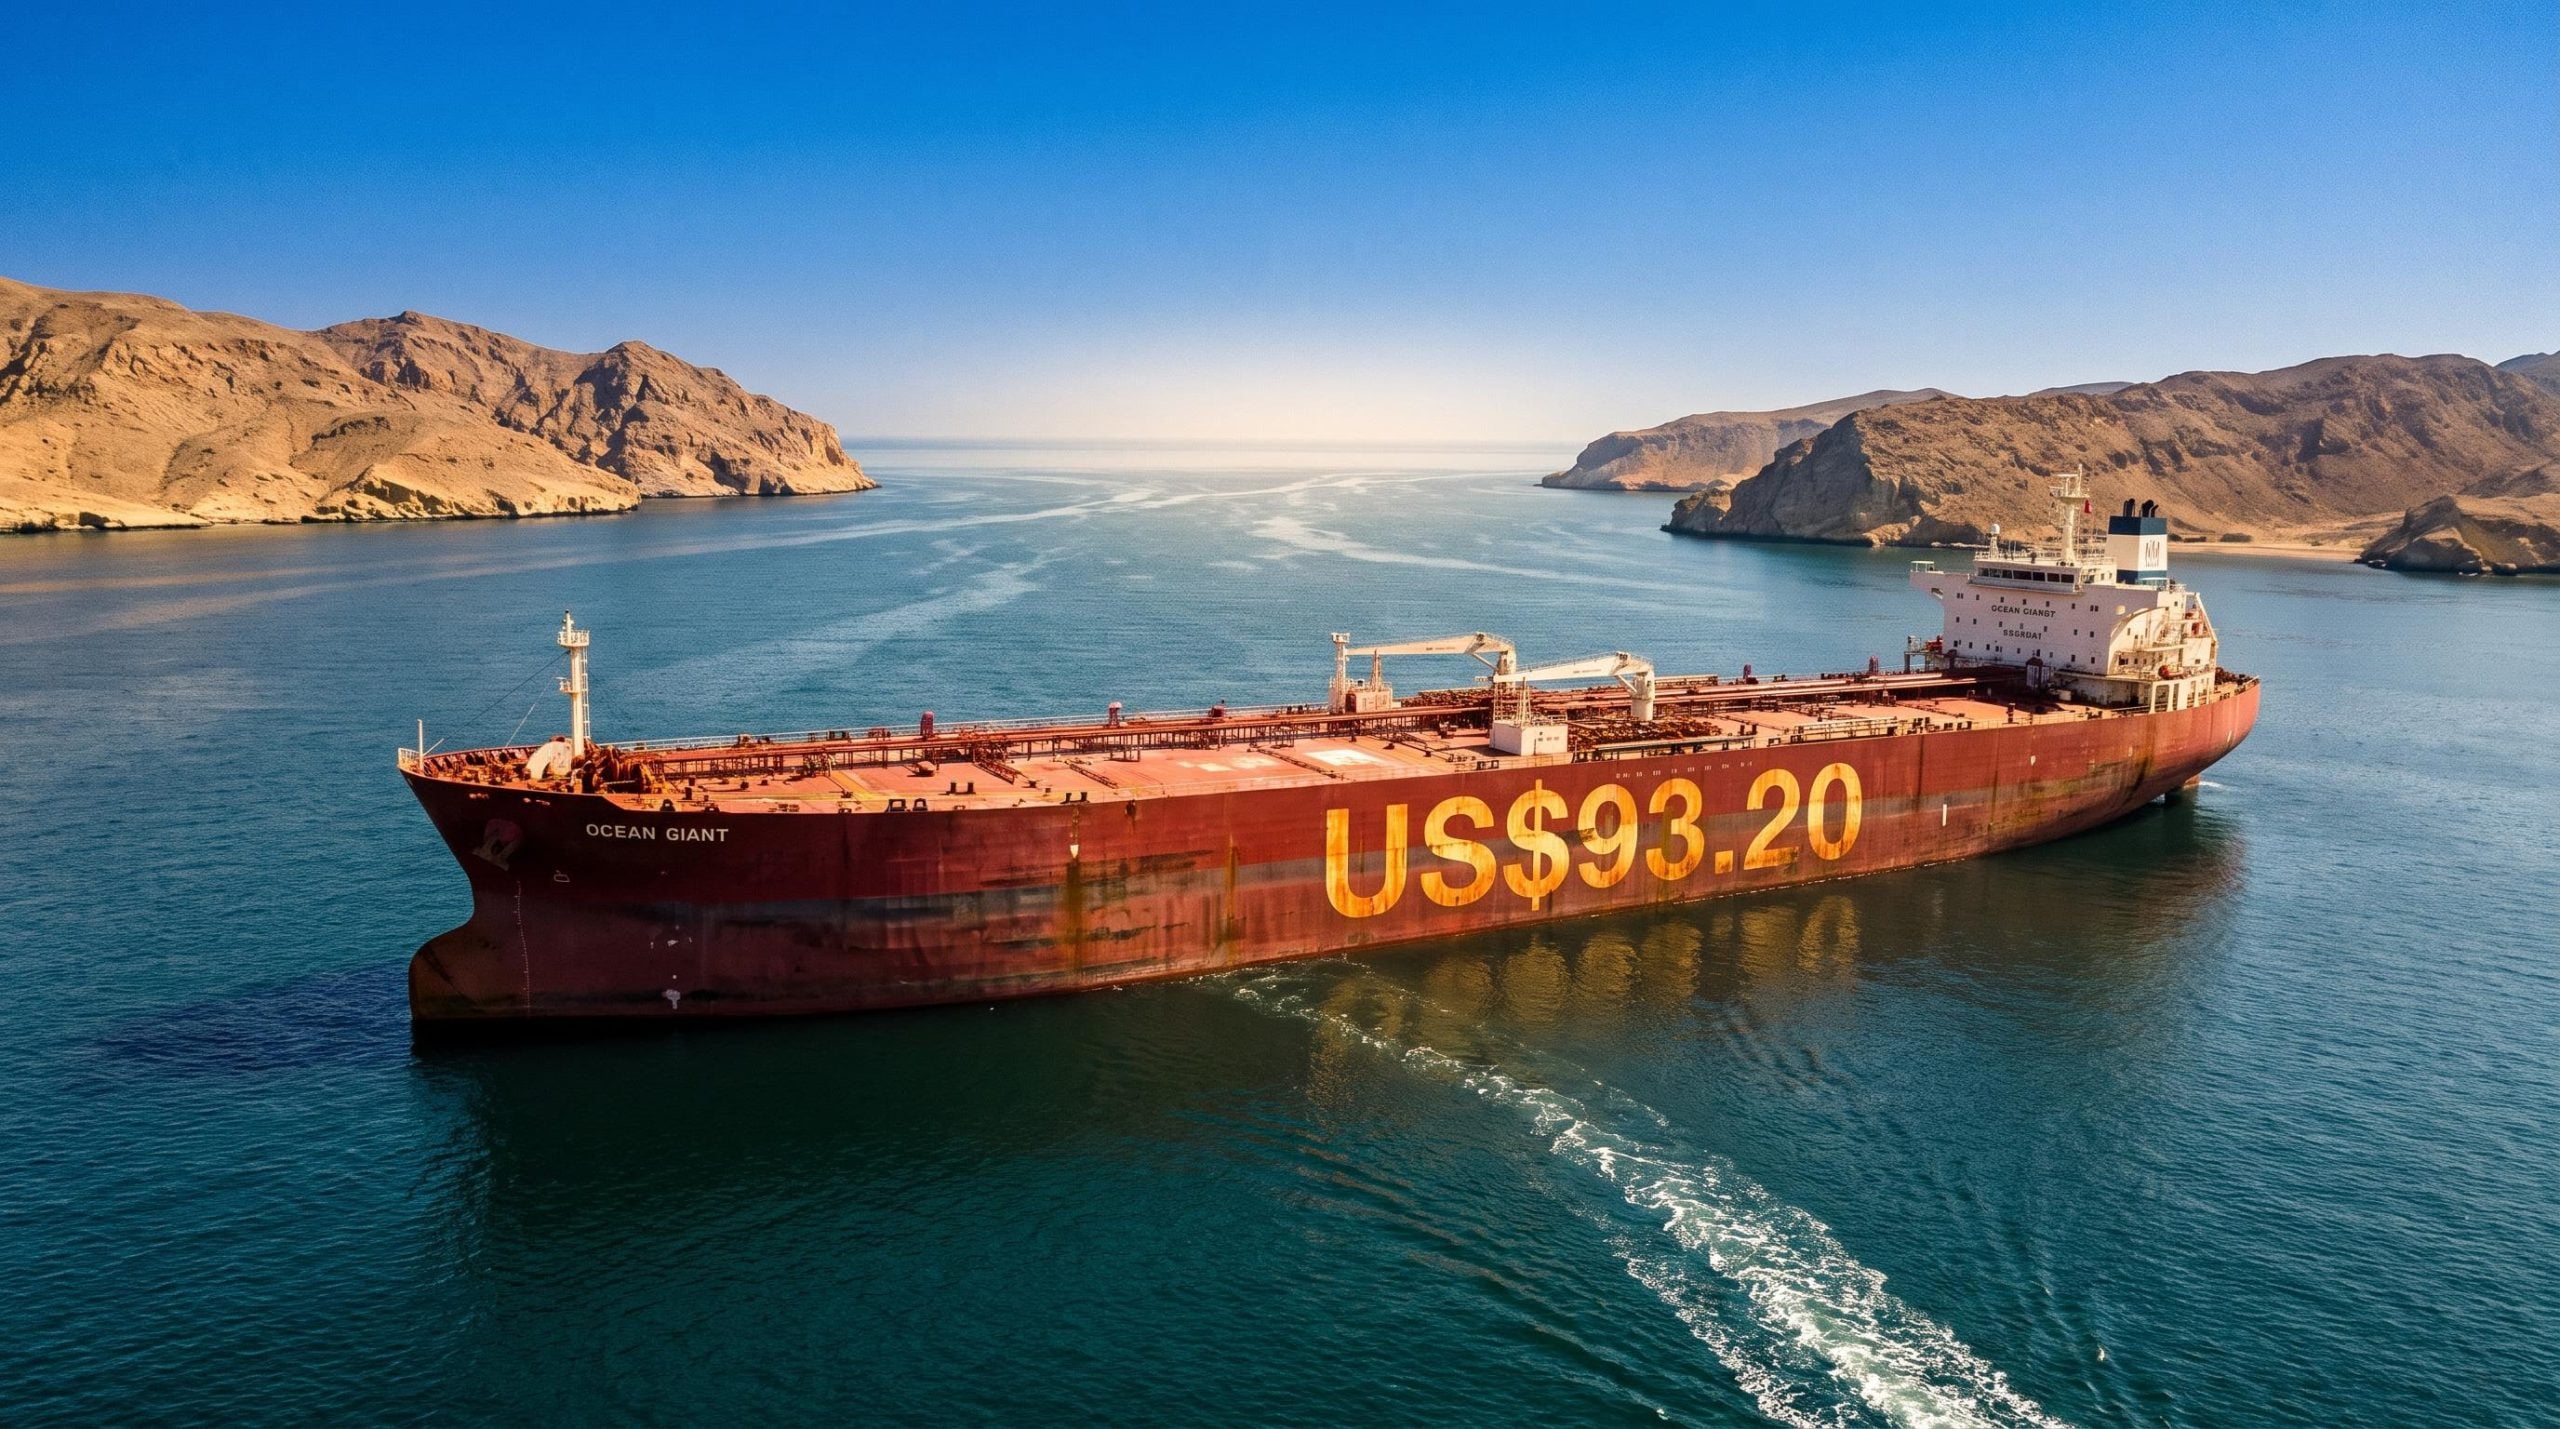
On 21 August, Brent finished the session at US$93.20, marking a 19.5% gain from its 4 August trough. WTI ended at US$86.83, a rise of 2.89% for the day.
Three scenarios for where oil prices go from here
Baseline: Partial flows continue, risk premium persists, Brent hovers in the US$85-95 range.
Upside risk: Further attacks on shipping or intensified sanctions enforcement materially cuts observed flows, pushing prices meaningfully above the current range.
Downside risk: Credible de-escalation or a negotiated shipping regime leads to rapid compression of the risk premium and a sharp correction.
These statements are speculative and subject to change based on geopolitical developments and market conditions.
What sustained oil above US$90 does to inflation and Fed policy room
The inflation transmission chain from sustained crude above US$90 is direct and sequential:
- Energy price spike feeds headline CPI and PCE first, with a short lag measured in months
- Rising energy costs push up breakeven inflation rates (the market’s implied expectation of future inflation)
- Higher breakevens raise nominal Treasury yields and term premiums (the extra return investors demand for holding longer-dated bonds)
- Elevated yields and persistent inflation expectations constrain the Fed’s ability to signal or execute rate cuts
Core inflation, which strips out volatile food and energy prices, follows with a longer lag of 1-2 years as second-round effects filter through transportation costs, manufacturing input costs, and wage pressure in energy-intensive sectors.
CPI measurement gaps in the current conflict are more significant than the headline figures suggest: diesel prices have surged approximately 50% since February 2026 against a 26% rise in crude futures, because damaged Gulf refining infrastructure has created a separate scarcity premium in refined products that standard energy sub-indices never fully capture.
On 21 August, the 30-year Treasury yield added 6 basis points to reach 5.25%, unwinding nearly the full gain from the prior session.
The 10-year Treasury yield closed at 4.696%, a rise of 0.92% on the day, finishing above the level it held before the Treasury’s buyback announcement. The bond market is already pricing the constraint: the Fed cannot cut into an oil-driven inflation impulse without credibility cost. For any investor holding rate-sensitive equities or long-duration fixed income, that is the signal that matters.
Bond markets, Treasury buybacks, and the limits of liquidity management
To relieve pressure on long-dated yields, the Treasury launched a debt buyback programme with a stated ceiling of US$4 billion per issue. Secretary Scott Bessent subsequently indicated that the actual volume of purchases could surpass that limit, and the total programme size was doubled from an earlier announcement.
It produced a brief rally. The following session erased virtually all of it.
JPMorgan contended that buybacks obscure rather than address the bond market’s deeper structural problems. The critique is precise: buybacks shift the distribution of duration across the yield curve and can support liquidity at specific points, but they do not reduce net federal borrowing needs or the long-term supply of Treasuries. As total U.S. government debt nears the US$40 trillion mark, the market appears to be demanding fiscal credibility, not liquidity management.
Treasury buyback mechanics reach a structural ceiling that JPMorgan quantified against the $31.5 trillion marketable debt market: operation sizes in the billions are too small to shift the supply-demand balance at the long end, and when official commentary produces a relief rally that fully reverses within a single session, technical tools have reached the limit of their effectiveness.
Fixed income strategists point to three underlying forces behind the yield rise that took hold in June 2026:
- Deficit trajectory and the overall direction of U.S. fiscal policy
- Inflation remaining above target
- Elevated corporate debt issuance adding to duration supply
The buyback reversal is the market telling Treasury that interventions are not a substitute for fiscal credibility. Investors positioned in long-duration bonds need to understand that this dynamic predates and will outlast the current oil disruption.
Can a fiscal consolidation announcement change the bond market’s calculation?
Bessent and Budget Director Russ Vought have been tasked by the administration with leading a fiscal consolidation drive aimed at bringing down borrowing costs that have risen to multi-year highs. A policy announcement on the initiative was signalled for late in the week of 19 August or early the following week.
According to Bessent, present yield levels are not an accurate representation of where economic fundamentals actually stand. JPMorgan’s position is that structural deficit dynamics are exactly what yields reflect. Whether the announcement shifts the market’s assessment depends entirely on whether it is perceived as credible relative to that structural trajectory.
Where the pressure travels next: EM exposure and the geopolitical endgame
Iraq is the sharpest illustration of how Hormuz disruption multiplies outward. Oil revenues fund around 90% of Iraq’s national budget, and the country has few viable export corridors outside the Gulf. Faced with that dependence, Iraq has sought a carve-out from Iran allowing its oil cargoes to pass through Hormuz under special terms. Even a partial, sustained disruption to Iraqi oil exports could translate into sovereign budget stress within weeks, with potential pressure on Iraqi sovereign spreads and currency stability.
The secondary sanctions architecture extends this pressure further. Countries with significant Iranian energy ties face the same binary choice: U.S. market access or discounted Iranian crude. That tension is expected to surface as FX pressure and wider sovereign spreads in emerging markets unable or unwilling to sever those ties.
Cross-asset transmission from the Hormuz disruption extends well beyond crude benchmarks: ECB chief economist Philip Lane explicitly linked the Iran conflict oil shock to potential rate hikes, Asian equity markets registered broad declines in a single session, and China’s April 2026 retail sales of just 0.2% year-on-year introduced a stagflationary undercurrent into the world’s largest crude importer.
Trump stated via Truth Social that nations seen as economically sustaining Iran would be subject to severe financial penalties.
Three geopolitical variables will determine which oil price scenario materialises:
- Whether Iran responds to sanctions with further shipping disruptions
- Whether a negotiated shipping framework emerges from diplomatic channels
- Whether secondary sanctions enforcement on third countries intensifies
Iraq’s 90% oil revenue dependence is not a peripheral detail. It is the clearest case of how what looks like a bilateral U.S.-Iran standoff has the structural capacity to destabilise a third country’s fiscal position on a timeline measured in weeks, not years.
What changes if Hormuz stays disrupted, and what does not
The oil price surge reflects flow fragility, not supply catastrophe. The bond market stress reflects structural forces the disruption is amplifying, not creating. And emerging market vulnerability is determined by secondary sanctions reach more than direct Hormuz exposure.
What resolves the risk premium is specific: credible de-escalation, a negotiated shipping regime, or a sustained decline in enforcement intensity. What does not resolve it is equally specific: liquidity interventions in the bond market or official statements about flows that diverge from observed data.
Two unknowns matter most from here. The first is whether the geopolitical endgame moves toward negotiation or further escalation. The second is whether secondary sanctions enforcement reaches the point of forcing third-country energy realignment. Every asset class touched by this story, from crude to Treasuries to EM sovereign debt, prices off those two questions.
This article is for informational purposes only and should not be considered financial advice. Investors should conduct their own research and consult with financial professionals before making investment decisions. Past performance does not guarantee future results. Financial projections are subject to market conditions and various risk factors.