CURE and CLNE: the ASX ETFs Returning 25% in 2026
3 hrs ago

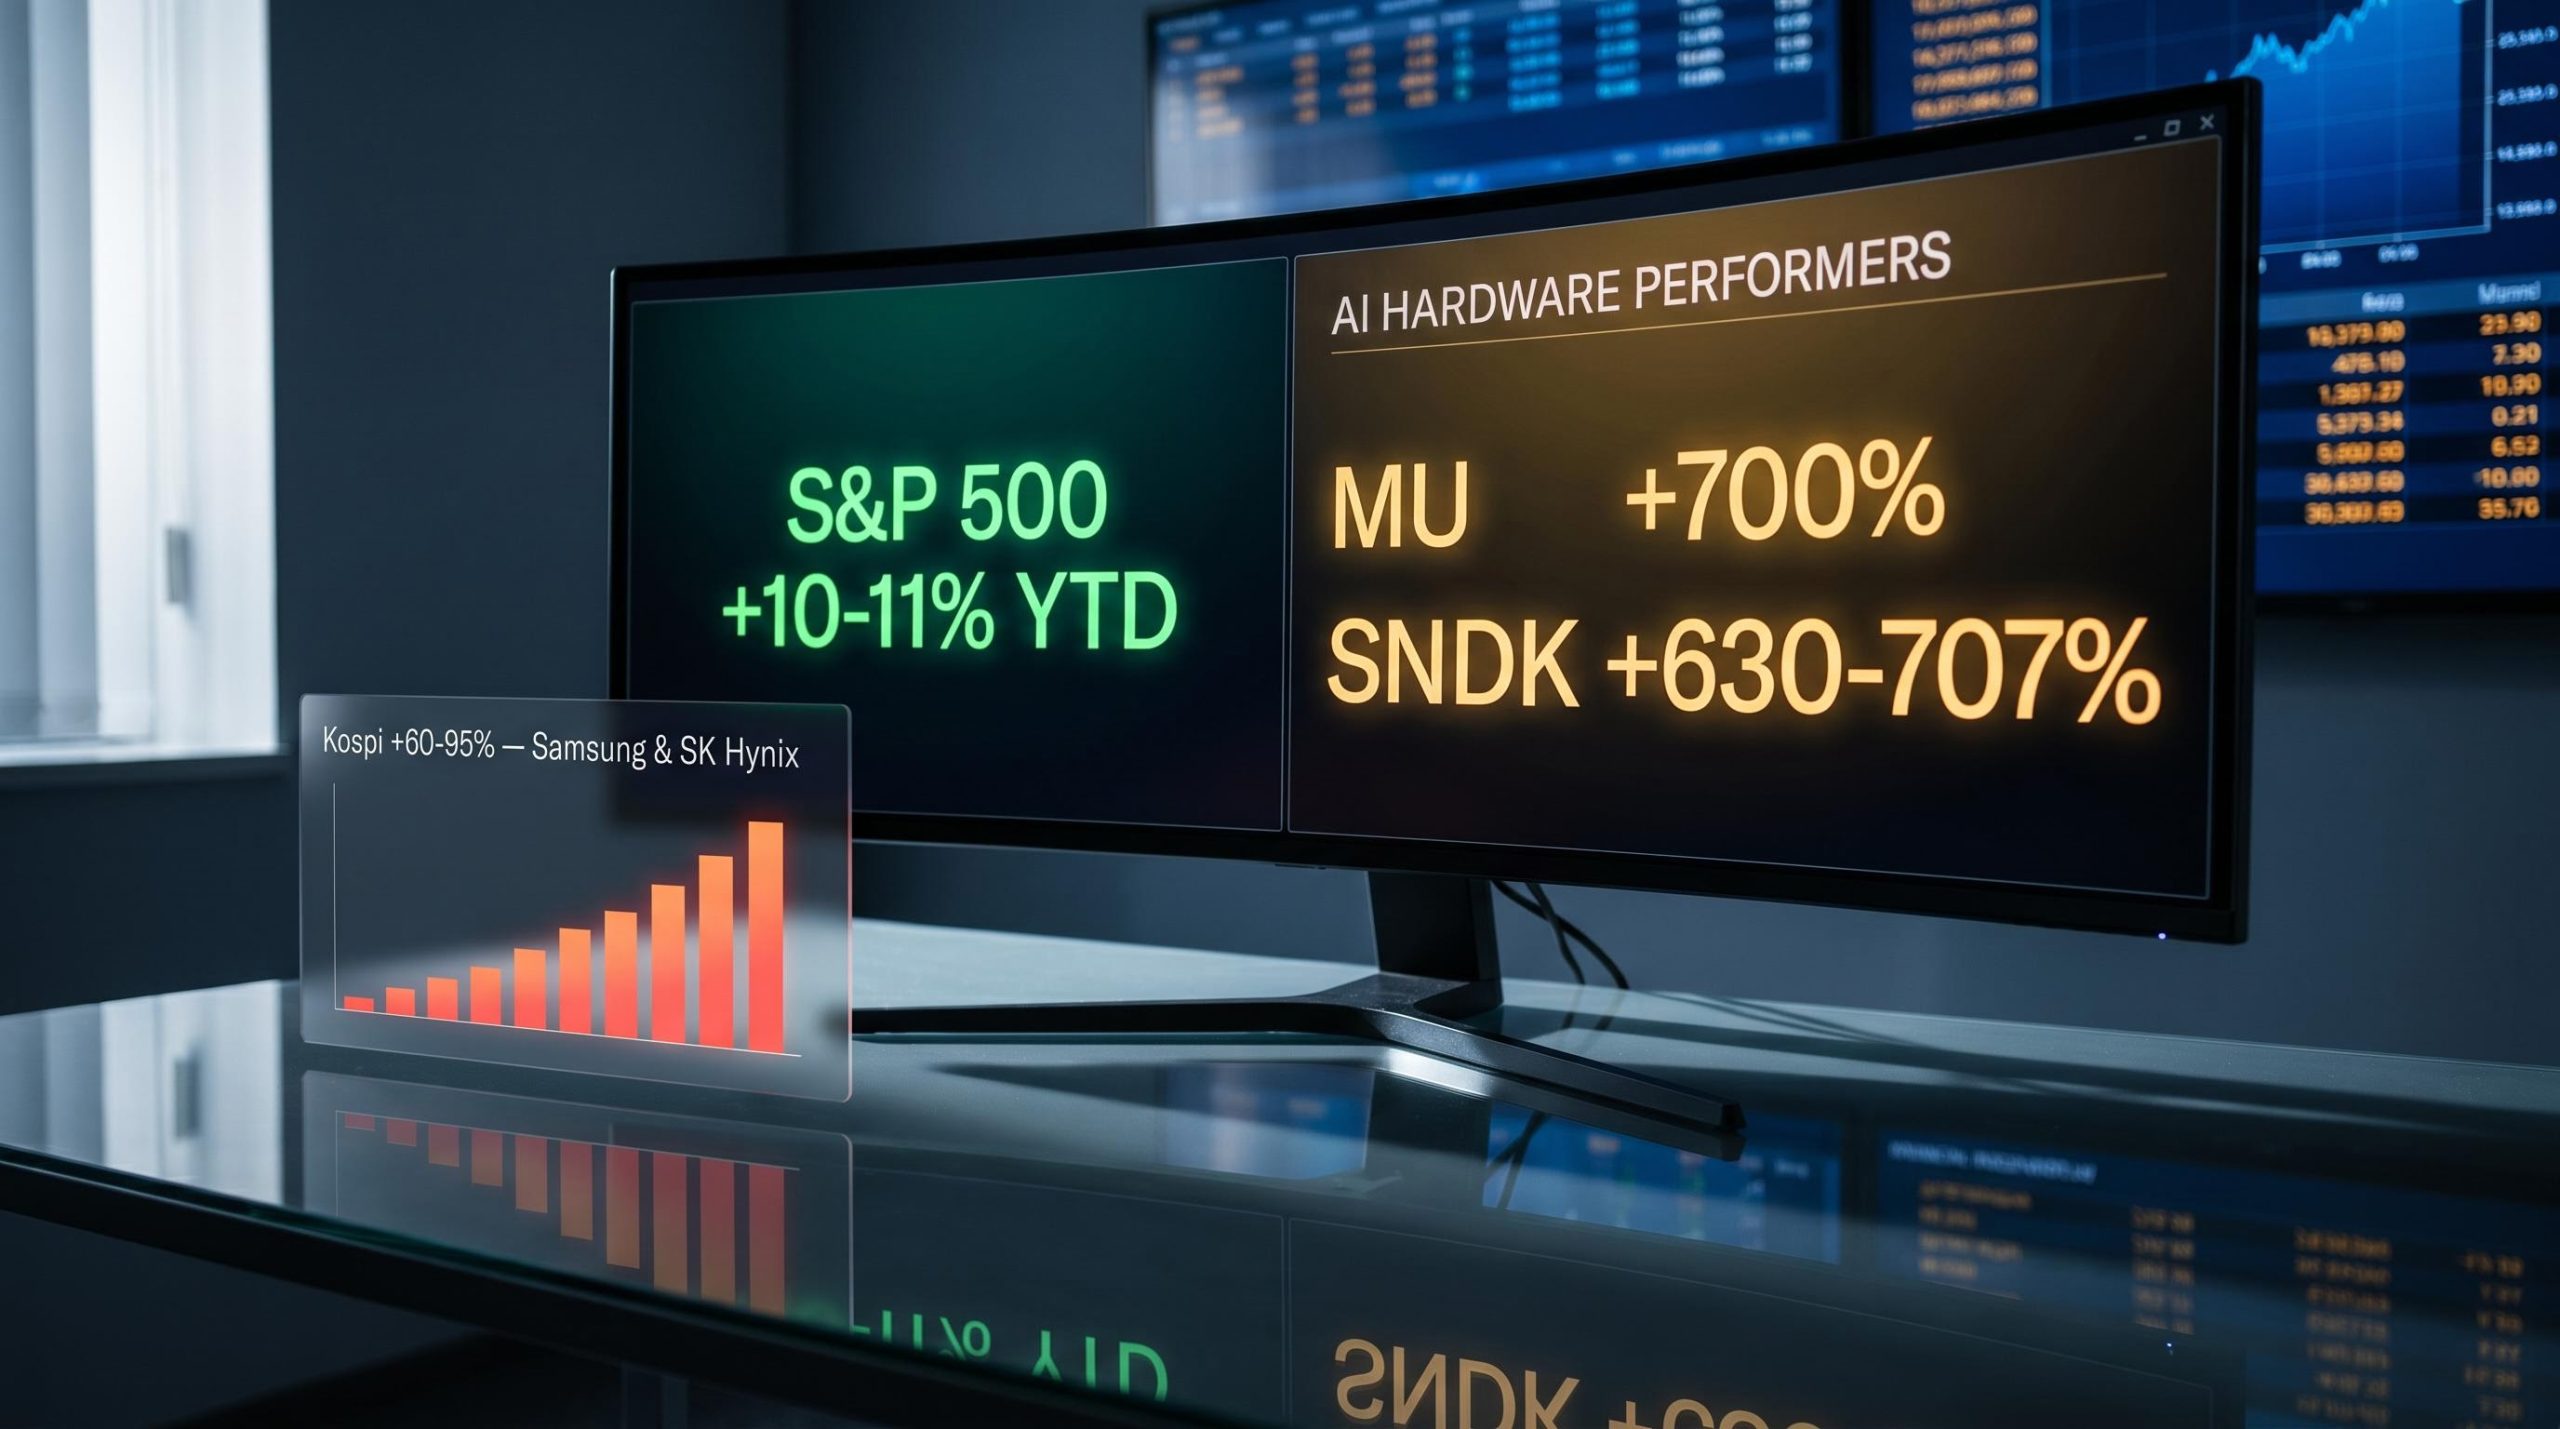
The US equity market is up roughly 10-11% year-to-date through mid-July 2026. Most investors will read that number and see broad-based strength. They would be wrong. The headline return conceals an extreme concentration of winners, and the gap between what the index says and what is actually happening underneath it is wider than at any point this year.
Three structural forces are doing the real work: AI-related tech outperformance that is distorting index-level returns, a value divergence between US and international markets that most comparisons get backwards, and a midterm election cycle that appears to be running ahead of its historical schedule. Each of these forces has different implications for what happens from here, and conflating them into a single “market is up” narrative obscures all three.
Here is the framework for understanding which of these forces still has room to run, which may have already delivered most of its return, and what that means for how you evaluate your own positioning in the second half of 2026.
The S&P 500 is up approximately 10-11% year-to-date through mid-July 2026. That is a strong number by any historical standard. But the technology sector alone is outperforming the broader US equity market by roughly 4 percentage points on a year-to-date basis, and that gap tells a very different story from the one the index headline suggests.
The mechanics are straightforward. Technology and AI-related mega-caps represent the largest single sector weighting in US indices. When the biggest names in the index post outsized gains, they drag the index number higher even if the rest of the market is delivering far more modest returns. The result is a headline figure that functions as an AI-tech return dressed in broad-market clothing rather than evidence of widespread earnings strength.
The cap-weighted S&P 500 returned 86% over three years versus 43% for the equal-weighted version, a gap driven entirely by valuation expansion rather than superior earnings growth, which illustrates how index concentration risk systematically overstates the breadth of market health.
Ken Fisher, Founder, Executive Chairman, and Co-Chief Investment Officer of Fisher Investments, put it directly:
“2026 is a tech story wearing an index’s clothing.”
If you are benchmarking your portfolio against the S&P 500 and holding anything less than a heavy tech weighting, your returns may look disappointing relative to the index even if your underlying holdings are performing reasonably well. The benchmark itself is distorted, and recognising that distortion is the first step toward understanding the three forces that are actually shaping this market.
The concentration is not abstract. It has specific names and specific numbers, and the scale of the outperformance is extraordinary even by the standards of previous tech-driven rallies.
The biggest winners in 2026 are companies in the AI supply chain: flash memory, semiconductors, data storage, and capital equipment for chip manufacturing. The logic is straightforward. The AI build-out requires physical infrastructure before it requires software, and the companies supplying that infrastructure are capturing the spending wave first.
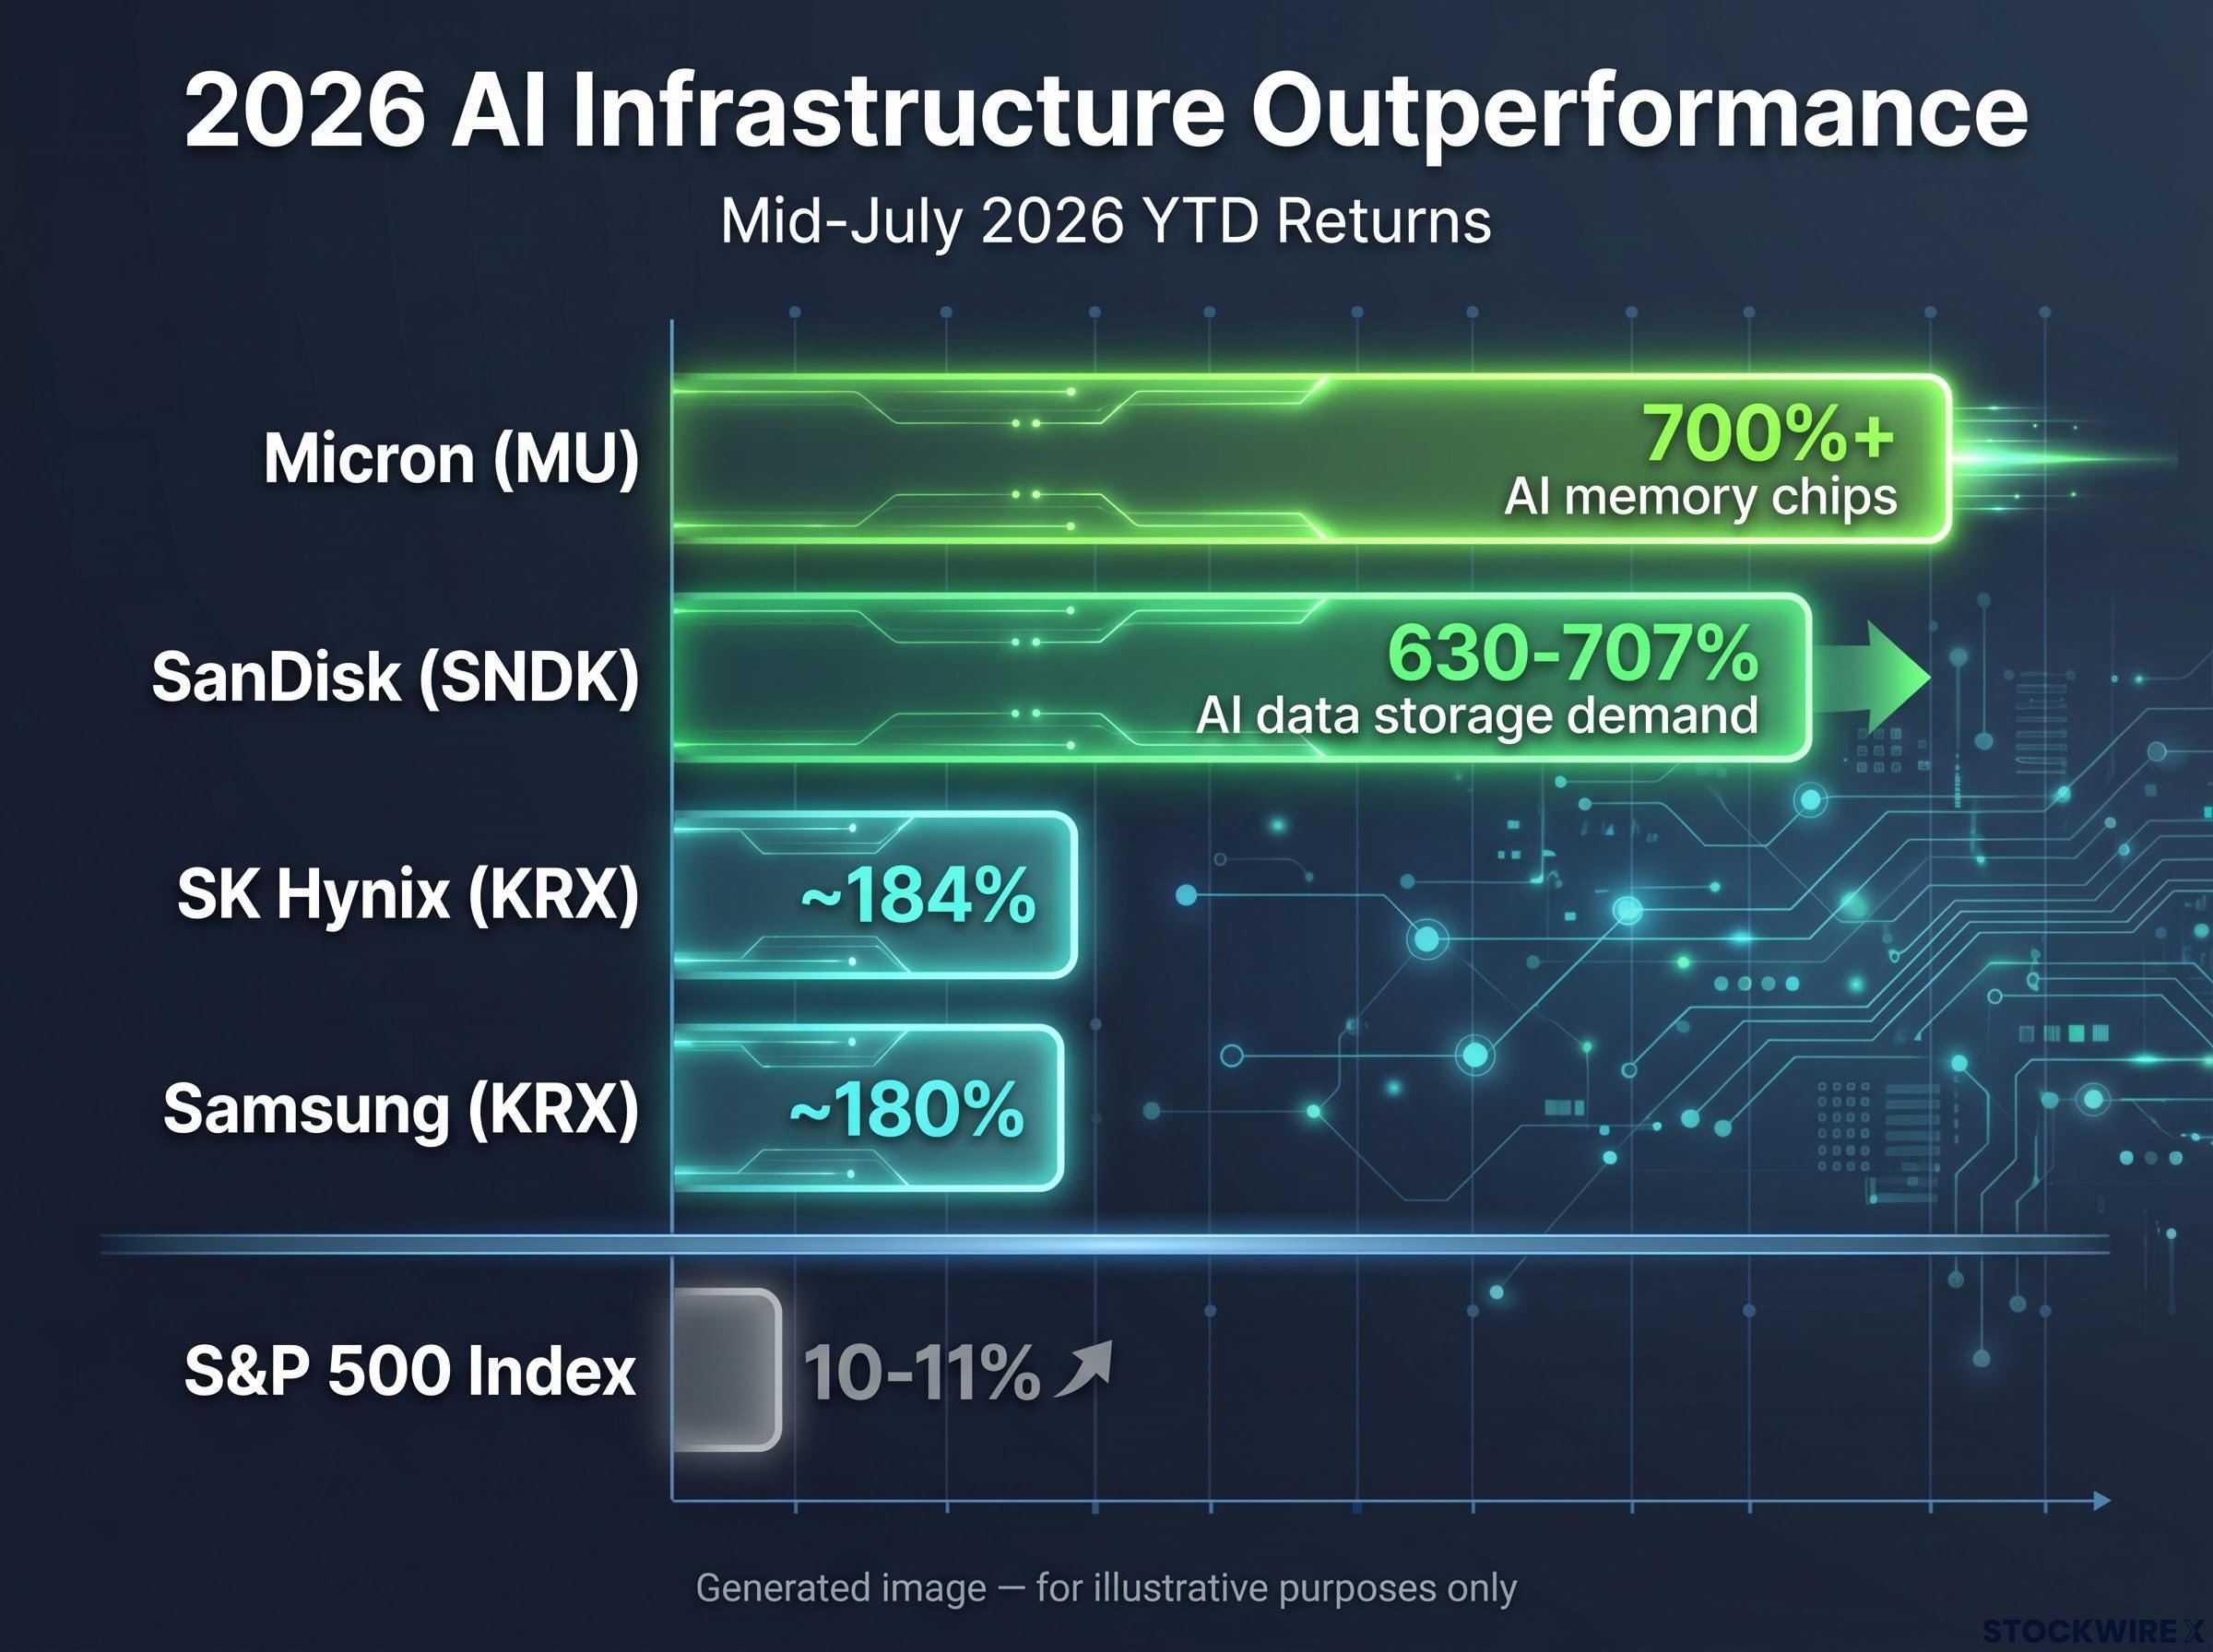
| Company | Ticker | Sector Sub-theme | YTD Return (approx) | Driver |
|---|---|---|---|---|
| SanDisk | SNDK | Flash memory | 630-707% | AI data storage demand |
| Micron | MU | Semiconductors | 700%+ | AI memory chips |
| Intel | INTC | Semiconductors | Substantial gains | AI infrastructure build-out |
| Seagate | STX | Data storage | Substantial gains | AI data centre expansion |
| Western Digital | WDC | Data storage | Substantial gains | AI data centre expansion |
| Samsung | KRX | AI chips (Korea) | ~180% | AI-chip demand powering Kospi |
| SK Hynix | KRX | AI chips (Korea) | ~184% | AI memory chip production |
The pattern extends well beyond the US. Korea’s Kospi is up approximately 60-95% in 2026, driven almost entirely by Samsung and SK Hynix on the back of AI-chip demand. The AI infrastructure trade is a global phenomenon, but its centre of gravity sits in the hardware supply chain.
The dispersion within the AI theme itself is just as sharp. The software side of the trade has not kept pace:
“AI exposure” is not a monolithic theme. Owning a broad tech fund does not guarantee participation in the strongest part of the 2026 rally. The hardware winners and software laggards are producing very different outcomes, and the distinction matters for anyone evaluating their tech allocation right now.
Here is where the concentration effect becomes practically useful. The most common comparison investors make, US equities versus international equities, is misleading in 2026 for the same reason the headline index number is misleading: sector composition, not geography, is doing most of the explanatory work.
Broad ex-US ETFs like Vanguard’s VEA (developed markets) and VWO (emerging markets) have posted high-single-digit gains year-to-date through mid-July 2026. The S&P 500 is up approximately 10-11% over the same period. The gap looks like a US win, but the composition of each side of the comparison tells a different story.
Comparing “US total market” to “international total market” is effectively comparing a growth/AI-heavy portfolio to a value-heavy one, not a like-for-like geographic comparison.
International equity markets carry minimal technology exposure. They are composed predominantly of value-oriented sectors: banks, insurers, energy producers, industrials, and staples. US benchmarks, by contrast, embed a large AI-tech component that is inflating their aggregate return. Strip out that tech component and compare US value segments (financials, energy, industrials, staples) with their international counterparts, and the performance gap narrows or reverses.
| Market Segment | YTD Return (approx) | Dominant Sectors | Valuation Context |
|---|---|---|---|
| S&P 500 (total) | 10-11% | Tech/AI-heavy | Elevated, driven by mega-cap premiums |
| US value segments | Moderate single-digit | Financials, energy, industrials | More reasonable, but lagging tech-boosted index |
| Developed ex-US (VEA) | High single-digit | Banks, industrials, energy, staples | Lower valuations than comparable US firms |
| Emerging markets (VWO) | High single-digit | Financials, commodities, industrials | Discount to US on similar earnings trajectories |
Ken Fisher pointed to the divergence between US value stocks and their international counterparts as one factor behind why non-US equities failed to outperform as decisively as Fisher Investments had anticipated for 2026. Several strategists highlight that international stocks, particularly value names, trade at lower valuations than comparable US firms despite similar or better earnings trajectories.
For a reader holding international equity exposure that looks like it has underperformed, this reframes the picture. The apparent underperformance is a sector composition effect, not a verdict on international markets themselves. That distinction changes how you should think about whether to adjust your allocation.
The third force at work in 2026 is political, and it operates on a longer historical cycle than either the AI trade or the value divergence. The midterm election cycle is one of the most commonly cited frameworks among US equity investors, and understanding how it typically works is the prerequisite for understanding why the 2026 version of it is behaving unusually.
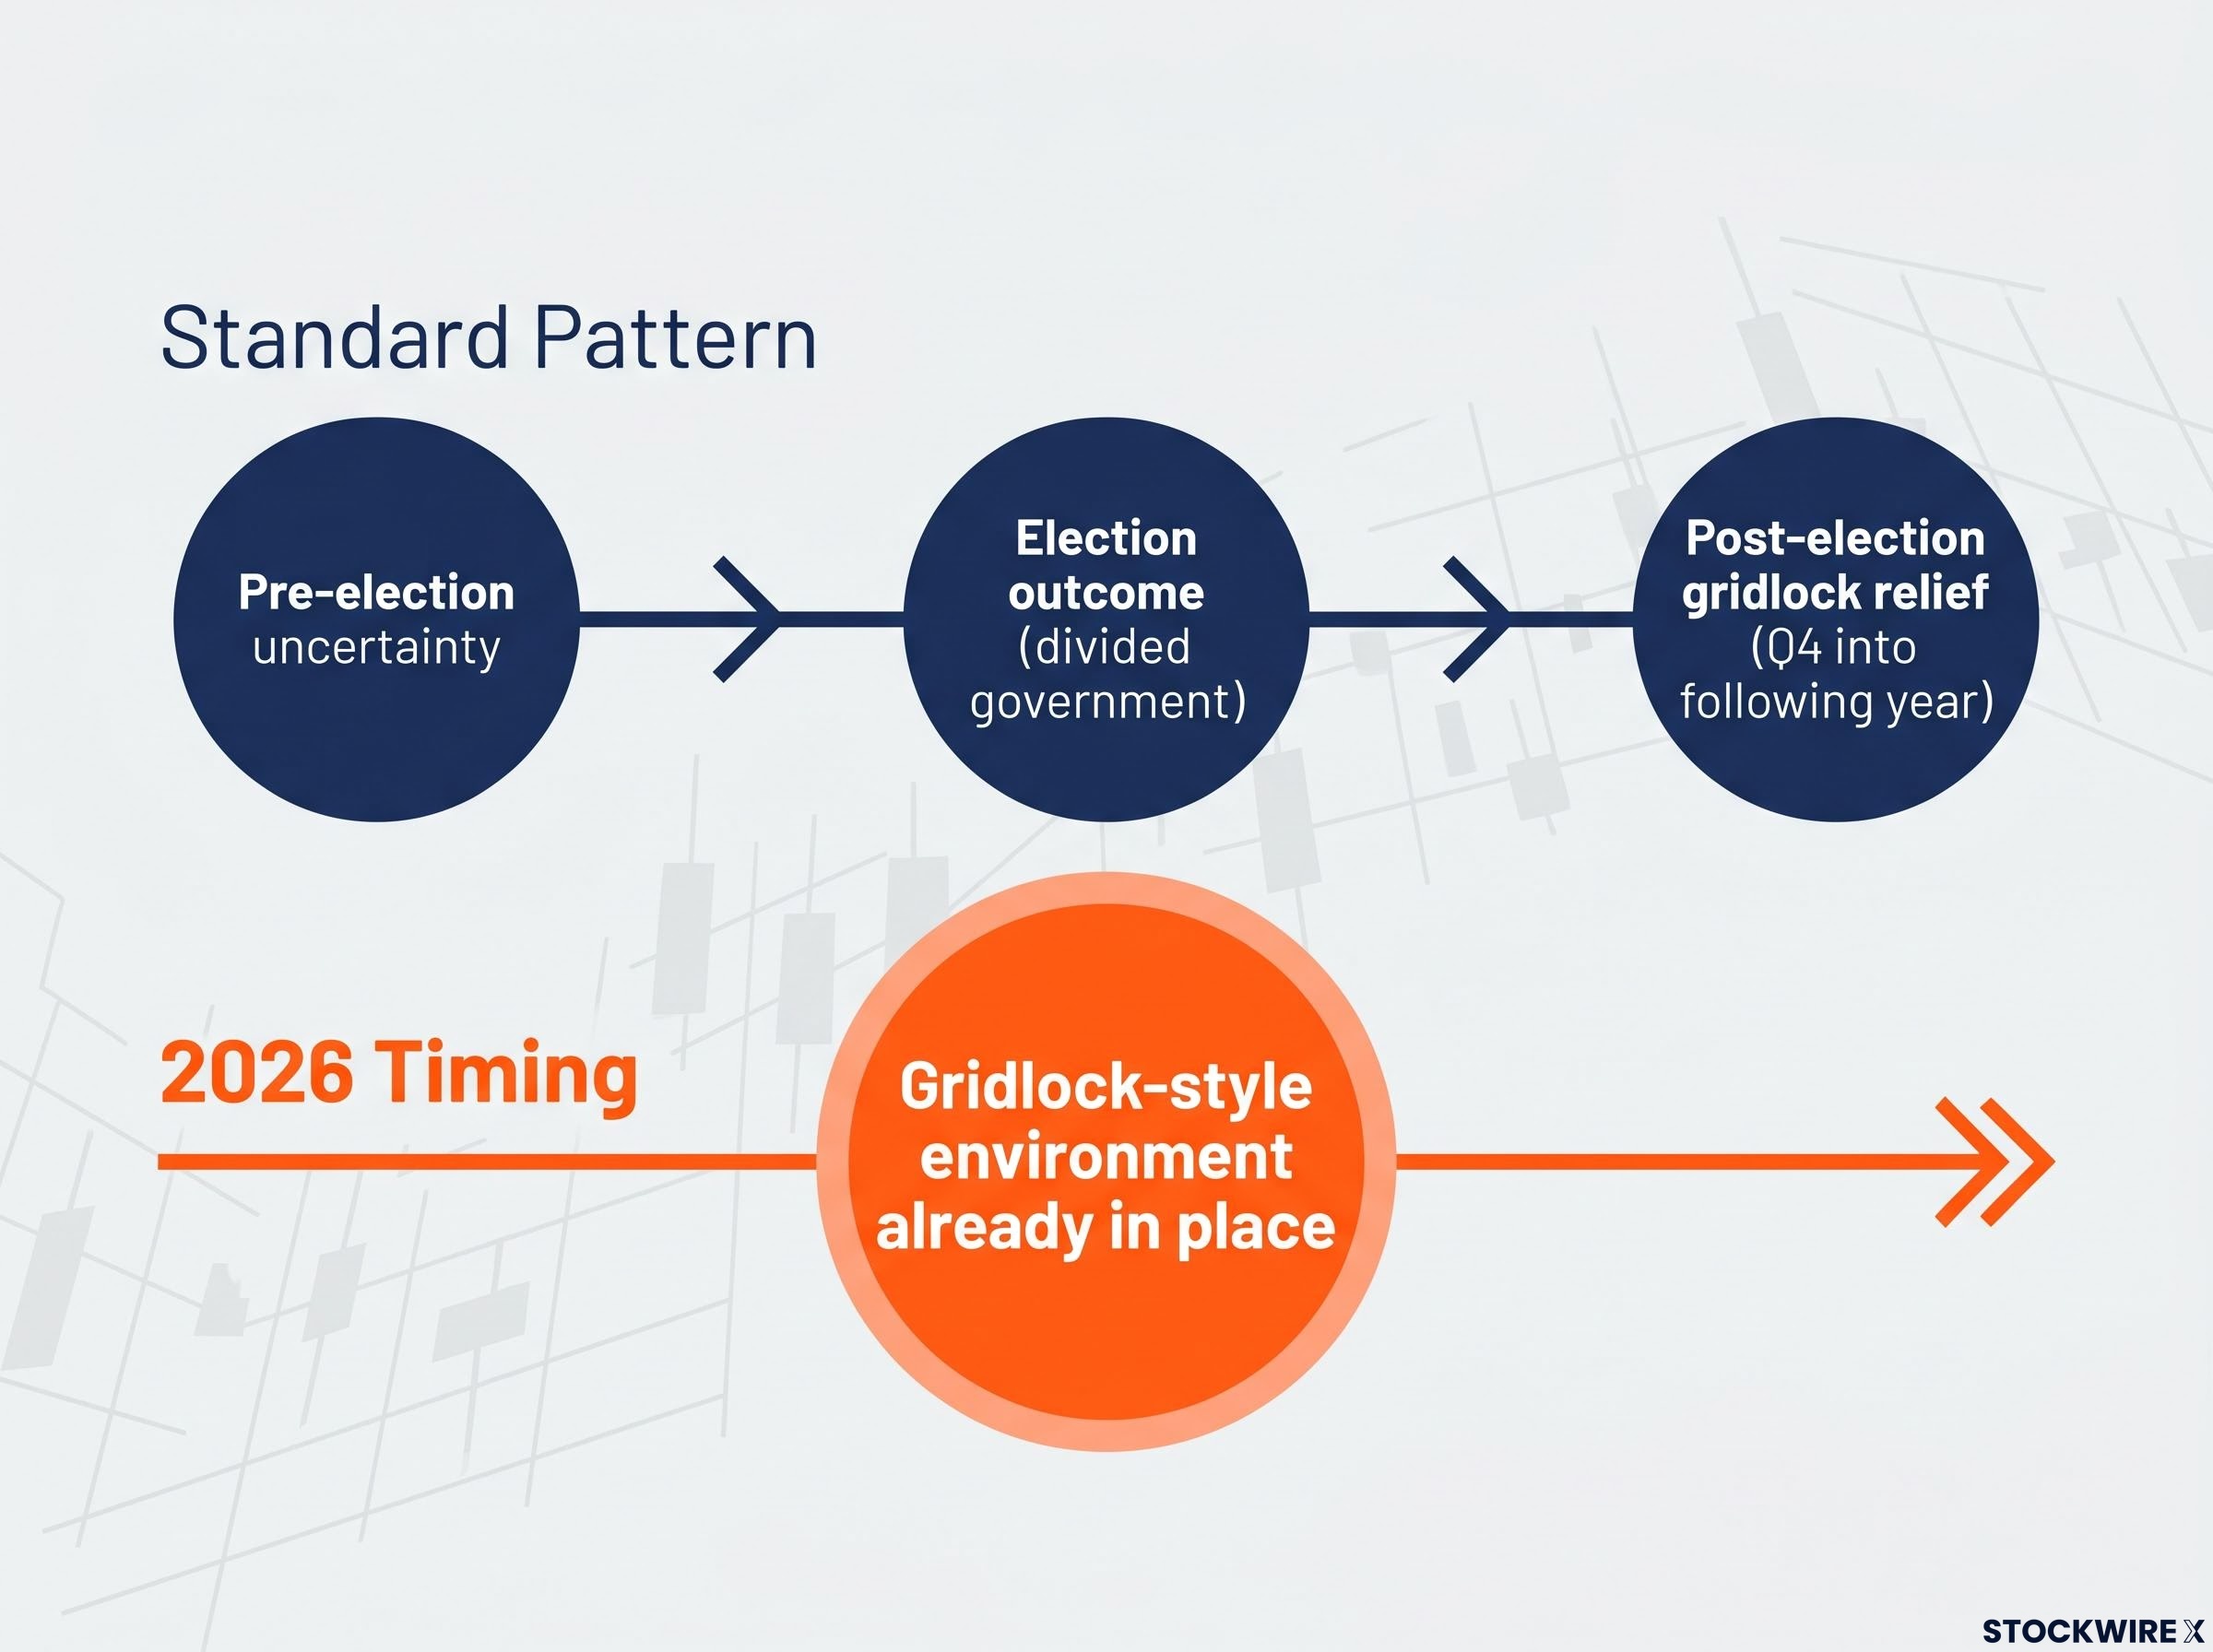
The standard pattern unfolds in three phases:
Post-midterm rally mechanics are driven by uncertainty resolution rather than partisan outcomes: settled election results allow sidelined capital to redeploy, and the S&P 500 has posted positive returns in the 12 months following every US midterm election since 1950, covering all 19 cycles with no exceptions through recessions and financial crises.
Decades of market history support this pattern. Ken Fisher has observed that midterm elections tend to produce conditions, either outright or relative to prior years, in which legislative activity is constrained, and that this reduced policy risk has historically been a positive backdrop for equities.
The 2026 complication is timing. Rather than following the standard back-loaded pattern with strength concentrated in Q4, markets appear to be grinding higher through the middle of the year, consistent with a gridlock-style environment that is already in place rather than one that needs an election to produce it.
Ken Fisher has noted that the election-cycle benefit appears to have arrived ahead of its usual schedule in 2026, with the current congressional environment already delivering the kind of legislative inertia that typically only crystallises after November. As a result, some of the return that would historically accumulate in Q4 and into the following year may already be reflected in prices, though how much further upside remains is genuinely unclear.
If you have been anticipating a strong Q4 rally based on midterm cycle history, this warrants a recalibration. The tailwind may already be partially reflected in prices. That does not mean the market falls, but it does mean the simple “midterm Q4 surge” playbook is less reliable this year than the historical averages might suggest.
Viewed together, the three dynamics describe a market that is stronger and narrower than simple index charts reveal. They are not independent events. They are mutually reinforcing conditions that together explain both the strength of headline returns and the fragility of the assumptions underneath them.
AI-tech concentration is producing index returns that overstate broad economic health. The sector composition effect means international value deserves more credit than headline comparisons give it. And the election-cycle support may already be partially priced, reducing the forward-looking case based on that factor alone.
A market driven primarily by a narrow cluster of names is not inherently a bearish signal. Vanguard and Morgan Stanley both emphasise that near-term US equity strength is heavily tied to large-cap tech earnings and AI capital spending, even as they warn that high valuations may cap long-run returns. Concentration tells you where the returns are coming from; it does not automatically tell you they are about to stop.
Historical episodes of extreme market leadership concentration, including the Nifty Fifty, Japan Inc., and the dot-com cycle, each saw the dominant cohort deliver annualised returns approximately 3-5 percentage points below the broad global market over the subsequent decade, according to BlackRock Investment Institute research, which is the structural risk embedded in any portfolio that simply extrapolates the 2026 concentration forward.
| Force | What It Explains | What It Does Not Explain | Implication for H2 2026 |
|---|---|---|---|
| AI-tech concentration | Why the index is up 10-11% and most portfolios are not | Whether broad corporate earnings are healthy | Returns depend heavily on AI earnings trajectory |
| US-vs-international value divergence | Why international exposure looks worse than it is | Whether international will outperform in absolute terms | Valuation case for international value remains intact |
| Midterm election cycle | Why the grind-higher pattern has persisted | Whether Q4 will deliver a fresh surge | Tailwind may be partially spent; less clean back-half case |
The combination of front-loaded gains, concentrated leadership, and a midterm cycle that has run early creates a more ambiguous forward picture than headline returns suggest, without requiring a bearish conclusion. Three practical takeaways follow from the framework:
The 2026 market is not broken or in a bubble by the evidence reviewed here. But the simplest version of “buy US equities for the midterm tailwind” is a less complete strategy than it would have been six months ago. Each of the three forces that produced the first-half strength carries an open question into the second half.
Whether AI tech maintains its leadership pace, whether international value closes the gap with US value, and whether the election-cycle tailwind has more to give are all unresolved as of mid-July 2026. Honest analysis acknowledges these as genuinely open questions rather than resolved ones.
The three variables to monitor from here:
Informed positioning in the second half of 2026 is about monitoring these specific, nameable signals rather than trusting the headline index number to tell you how the underlying forces are moving.
This article is for informational purposes only and should not be considered financial advice. Investors should conduct their own research and consult with financial professionals before making investment decisions. Past performance does not guarantee future results.
Three structural forces are driving the 2026 market: AI-related technology outperformance concentrated in hardware and semiconductor names, a valuation divergence between US and international equities that is largely a sector composition effect, and a midterm election cycle that has historically supported equity prices but appears to be running ahead of its usual schedule.
The S&P 500's 10-11% year-to-date gain is heavily skewed by AI-related mega-cap technology stocks, which are outperforming the broader market by roughly 4 percentage points; if your portfolio holds anything less than a heavy technology weighting, it will likely lag the index even if individual holdings are performing reasonably well.
Index concentration risk means the headline S&P 500 return overstates broad market health; the cap-weighted index returned 86% over three years versus 43% for the equal-weighted version, a gap driven by valuation expansion in a small number of mega-cap names rather than widespread earnings strength.
The apparent underperformance of international equities is largely a sector composition effect: developed and emerging market ETFs like VEA and VWO are heavy in value-oriented sectors such as banks, energy, and industrials, which means comparing them to a tech-weighted US index is not a like-for-like geographic comparison.
The midterm cycle historically delivers a post-election tailwind as gridlock reduces policy uncertainty, but in 2026 that legislative inertia appears to already be in place, meaning some of the return that would normally accumulate in Q4 may already be reflected in prices, making the traditional second-half surge less reliable than historical averages suggest.