Two sector ETFs have delivered returns of 14-25% year-to-date on an ASX that has largely gone nowhere in 2026. That gap between the benchmark and these two funds is not coincidental.
The ASX is structurally weighted toward banks and miners, leaving Australian investors underexposed to healthcare, biotechnology, and clean energy relative to global market benchmarks. In a year when broad index returns have been subdued, the Global X S&P Biotech ETF (CURE) and the VanEck Global Clean Energy ETF (CLNE) have highlighted exactly that gap. Understanding why they have outperformed requires understanding what the ASX does not give you.
Here is a framework for evaluating whether CURE and CLNE belong in your portfolio, what is actually driving their 2026 returns, and what the risks look like before you act on momentum.
Why the ASX leaves Australian investors structurally short on two sectors
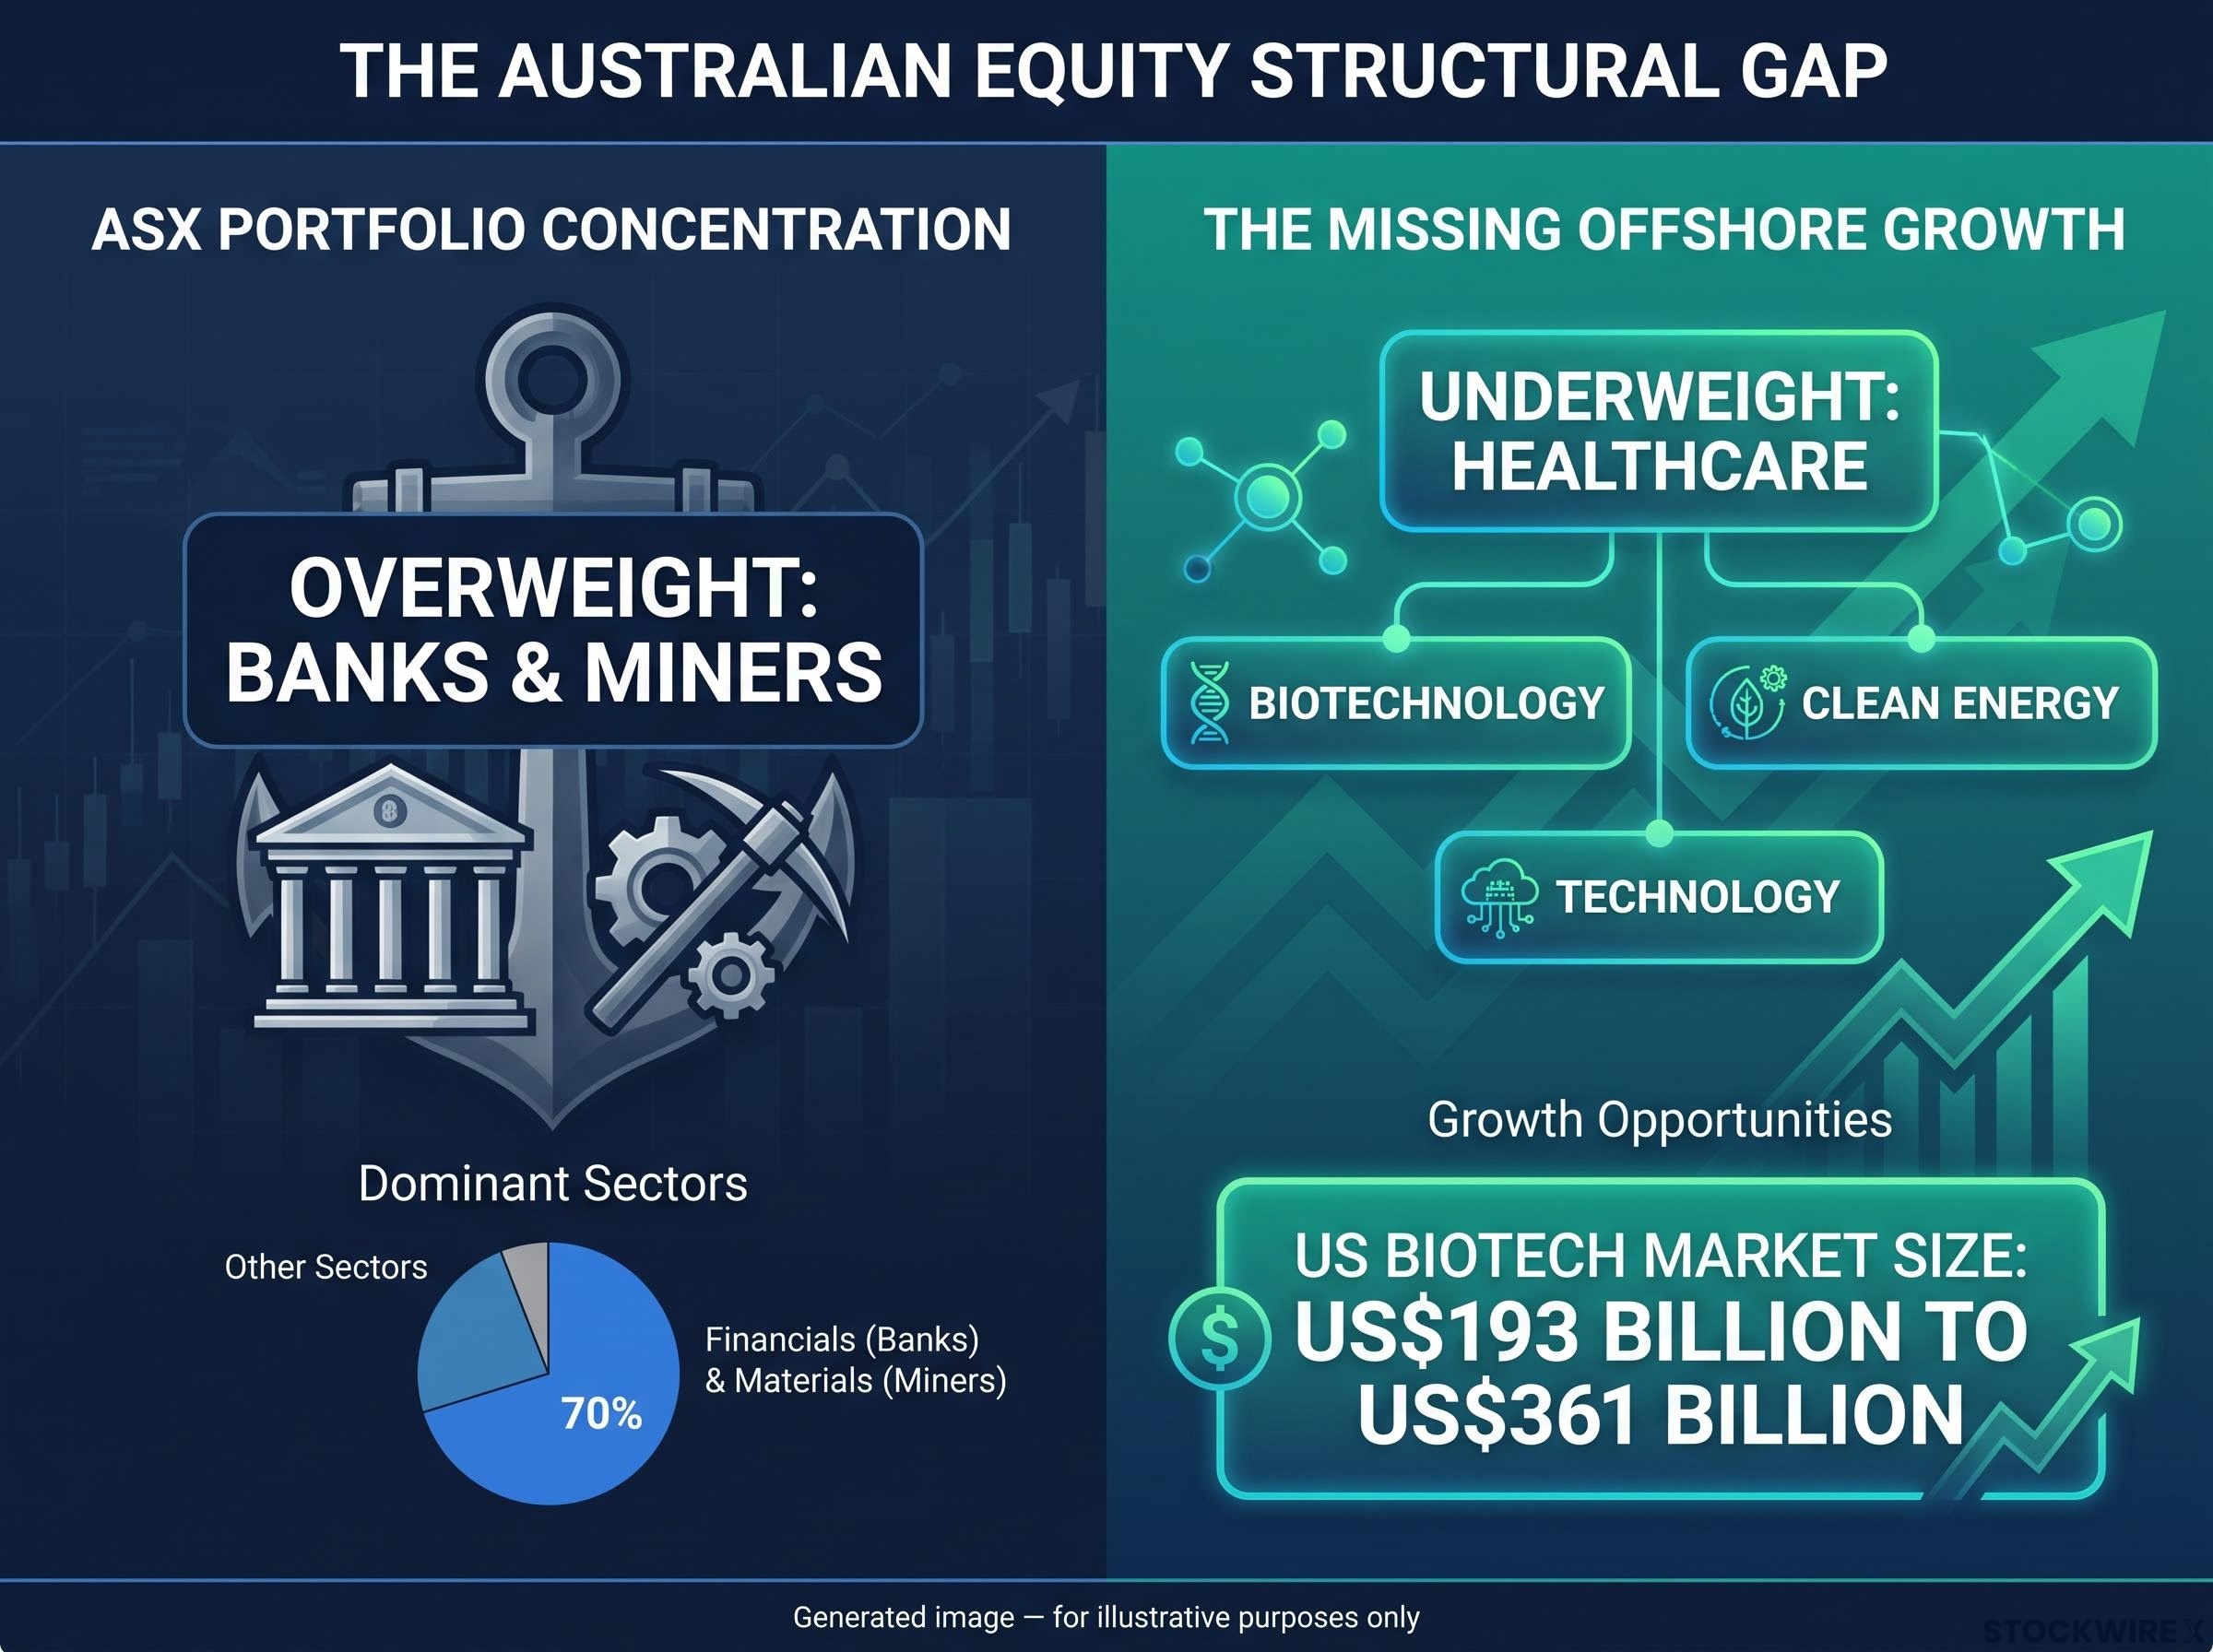
The ASX’s overweight to financials and resources is not a cyclical feature. It is structural. Banks and miners have dominated the index for decades, and that composition persists regardless of what else is happening in global markets. The consequence is a persistent underweight to sectors that drive returns elsewhere: healthcare, biotechnology, clean energy, and technology.
Home bias compounds the problem. Most Australian investors hold predominantly domestic equities, which means their actual portfolio gap is even wider than the index gap. A typical home-biased Australian portfolio looks like this:
ASX structural underperformance against global benchmarks runs at roughly 3-4 percentage points per annum over the past decade, a gap explained not by cyclical misfortune but by the index’s persistent concentration in financials and resources at the expense of the sectors now driving global returns.
- Underweight healthcare and biotechnology relative to global benchmarks
- Underweight clean energy and technology
- Heavily concentrated in banks and miners
For most Australian investors holding a standard domestic equity portfolio, CURE and CLNE are not speculative additions. They are responses to a real and measurable allocation deficit that persists year after year.
The offshore market is a different order of magnitude
CURE and CLNE are designed to bridge the gap between what the ASX lists and what global markets offer. The scale contrast makes the case clearly.
The US biotechnology industry that CURE targets dwarfs its Australian counterpart. Global X’s own product materials cite a market valued at over US$193 billion, while broader estimates range to approximately US$361 billion depending on scope and methodology. Either figure illustrates the same point: the offshore opportunity set is orders of magnitude larger than anything available domestically, and no amount of ASX stock-picking can replicate it.
When big ASX news breaks, our subscribers know first
What CURE actually holds and why the equal-weight structure matters
CURE is a passive ETF tracking the S&P Biotechnology Select Industry Index. It provides equally weighted exposure to US biotechnology equities, with the portfolio spanning approximately 140-150 holdings (the underlying index comprises roughly 152 constituents). Geographic concentration sits primarily in the United States, with minor exposure to Ireland and the UK.
The fund targets companies working across a range of biotechnology and healthcare innovation disciplines, including:
- Gene editing and genetic medicine
- Genomic sequencing and computational genomics
- Advanced therapies and immunotherapy
- Drug discovery and development
- Bioscience and technology convergence
Roughly 15-22% of assets sit in top holdings, and the fund is an ASX-listed, AUD-base-currency vehicle investing predominantly in USD-denominated assets.
The equal-weight distinction matters. Unlike market-cap-weighted funds, CURE’s equal-weight methodology gives smaller, earlier-stage companies the same index representation as established names. That is the architectural choice that drives both its upside potential and its volatility.
The equal-weight structure means CURE gives you more exposure to earlier-stage biotech companies than a market-cap fund would. That is why it can move sharply in both directions, and why its 2026 rally has been so pronounced. This is not a defensive healthcare allocation. It is a concentrated bet on biotech innovation at multiple stages of commercialisation.
What CLNE holds and how it differs as a thematic investment
CLNE tracks the S&P Global Clean Energy Select Index and holds a focused basket of roughly 30 clean energy businesses, selected for their scale and market liquidity from across the global clean energy universe. That number is worth pausing on. Where CURE spreads its risk across 140-150 holdings, CLNE concentrates it into 30.
The index draws on companies operating across the full clean energy value chain, encompassing power generation from renewable sources such as solar, wind, hydro, geothermal, and biomass, as well as manufacturers of the associated equipment and enabling technology, with holdings drawn from both developed and emerging markets. That geographic breadth gives exposure to different regulatory environments, but the concentration means a shift in one large holding or one government’s subsidy policy can move CLNE materially.
CLNE has delivered a year-to-date gain of approximately 14% per the original source, with independent data showing a range of approximately 13-19% depending on measurement date. The fund’s performance is sensitive to interest rates, policy settings, and sentiment toward long-duration growth assets, a meaningfully different risk dynamic than CURE’s 150-stock spread.
Investors treating CLNE as a broad “green” allocation should recognise they are taking a specific policy-sensitive bet, not simply diversifying into renewables as a category.
| Attribute | CURE (Global X S&P Biotech ETF) | CLNE (VanEck Global Clean Energy ETF) |
|---|---|---|
| Index tracked | S&P Biotechnology Select Industry Index | S&P Global Clean Energy Select Index |
| Number of holdings | ~140-150 | ~30 |
| Weighting methodology | Equal weight | Concentrated (largest and most liquid) |
| Geographic focus | Primarily US (minor Ireland/UK) | Developed and emerging markets |
| 2026 YTD performance range | ~25% (original source); ~24.75-29.45% (independent data) | ~14% (original source); ~13-19% (independent data) |
What is actually driving the 2026 outperformance, and what that tells you about timing risk
CURE’s headline number is striking: approximately 25% year-to-date per the original source, with independent data from InvestSMART, Yahoo Finance, and TradingView indicating a range of approximately 24.75-29.45% as of early July 2026. But the shape of that return matters as much as the magnitude.
One-month and three-month returns were both in the 20%-plus range as of early July 2026. Data from TrackInsight (flagged as unverified) cited +23.84% year-to-date, +22.48% over three months, and +21.23% over one month as of 1 July 2026. The conclusion across sources is consistent: a large portion of CURE’s annual gain arrived in a recent, sharp rally rather than a steady climb.
When more than 20% of a fund’s annual gain arrives in a single month, the question for you is not whether the thesis is right but whether the current price already reflects it.
Post-run-up entry exposes you to elevated short-term downside if sentiment reverses. Biotech’s historical pattern of sharp rallies followed by drawdowns remains highly relevant. Distinguishing between the long-term investment case and the entry-point timing question is what separates a considered allocation from chasing a return.
The thematic ETF behaviour gap between reported fund returns and actual investor outcomes is the central timing risk that strong-run momentum creates: when ARKK reported a +233% time-weighted return yet typical investors experienced approximately -35%, the cause was capital deployed near peak valuations after visible outperformance.
CLNE’s recovery and the policy sensitivity question
CLNE’s 2026 gains of approximately 14% need to be read against a challenging prior period for clean energy equities. The recovery context matters for setting expectations. This is not a sector on an unbroken run; it is one rebounding from a difficult stretch.
Clean energy equity performance correlates with interest rate direction and government policy settings. Historically, the sector has been sensitive to changes in discount rates, shifts in subsidy and regulatory frameworks, and risk-off sentiment that can hurt capital-intensive businesses. A reversal in either variable can shift the picture quickly, which means the tailwinds behind CLNE’s 2026 performance are not guaranteed to persist.
For investors wanting to understand how rate cycles translate into clean energy ETF drawdowns in practice, our dedicated guide to ERTH’s interest rate sensitivity traces the 2022-2025 decline periods directly to rate movements, providing a concrete historical model for evaluating CLNE’s exposure to the same mechanism.
The risks Australian investors need to price before acting
Before acting on CURE or CLNE’s momentum, five risk categories need explicit attention:
- Currency exposure: Both funds invest predominantly in foreign assets, giving you unhedged international equity exposure. CURE’s underlying holdings are primarily USD-denominated with an AUD base currency. CLNE carries multi-currency exposure; confirm hedge status in the Product Disclosure Statement (PDS). A falling AUD can flatter these returns significantly, which means you should separate how much of 2026 performance came from the underlying assets and how much from currency movement.
- Sector and geographic concentration: CURE is sector-concentrated (biotech only) and geography-concentrated (primarily US), even with 140-150 holdings. CLNE holds only 30 stocks, meaning subsector tilts within clean energy (solar versus wind, for example) can drive meaningful return variation.
- Thematic fee premium: Thematic ETFs typically carry higher Management Expense Ratios (MERs) than broad-market index ETFs. Higher fees are not a deal-breaker, but they compound the performance hurdle over time.
- Lower liquidity and trading mechanics: Both are smaller, specialised ETFs with lower daily volumes than large ASX-listed broad ETFs. Limit orders are generally preferable to market orders. Secondary liquidity risk also exists if investor flows reverse rapidly after a strong run.
- Tax and distribution treatment: As Australian-domiciled ETFs, distributions are typically taxable as trust income (foreign income, interest, capital gains) rather than fully franked dividends. Thematic ETFs often reinvest heavily in growth, meaning returns may be more capital-gain driven with modest distributions.
Pricing these risks accurately before entering allows you to size positions appropriately and avoid being surprised by drawdowns that are entirely consistent with how these funds are constructed.
Sector rotation risk is not hypothetical for thematic ETF investors: in 2026, technology-themed funds fell by as much as 25% while resources and energy ETFs delivered triple-digit gains, a reversal that reaffirms why position sizing and satellite discipline matter regardless of how compelling the current momentum looks.
How to size and use these ETFs as portfolio tools, not momentum trades
CURE and CLNE are satellite positions, not substitutes for broad equity index exposure. A logical sequence before transacting:
- Confirm the allocation gap. Identify whether your portfolio is underweight healthcare, biotech, and clean energy relative to your target allocation.
- Check existing exposures. Ensure you are not already exposed to these themes through other holdings, and that adding a new ETF does not create unintended concentration.
- Decide on sizing. Size according to your risk tolerance and ability to withstand cyclical drawdowns. A modest percentage of total equities is appropriate for most investors.
- Evaluate product specifics. Read the PDS and index methodology for each fund. Review the MER, holdings breakdown, geographic allocation, hedging status, and whether the ETF uses full replication or sampling.
After significant outperformance such as CURE’s 2026 run, position drift can silently create concentration that was never intended. Periodic rebalancing helps lock in gains and maintain your target allocation.
Treating these as satellite positions with explicit size limits is what allows you to capture the thematic upside without letting a strong year become an outsized and unmanaged exposure.
This article is for informational purposes only and should not be considered financial advice. Investors should conduct their own research and consult with financial professionals before making investment decisions. Past performance does not guarantee future results. Allocation decisions should reflect your individual financial situation, objectives, and risk tolerance, and ideally involve a licensed financial adviser.
What the CURE and CLNE run tells you about ASX portfolio construction in 2026
The outperformance of CURE and CLNE is not primarily a story about two clever fund picks. It is a story about the ASX’s structural composition and what it systematically excludes. When the sectors the domestic market underweights deliver the year’s standout returns (CURE at approximately 25%, CLNE at approximately 14%, versus a subdued broader ASX), the gap is the message.
The thematic thesis for biotech and clean energy does not expire after a strong year. Genomics, advanced therapies, and the global energy transition are structurally important investment themes. But the entry price matters, and the structural gap in Australian portfolios persists regardless of near-term return cycles.
If 2026 has demonstrated anything for Australian investors, it is that the sectors the ASX underweights are capable of delivering the year’s strongest returns, and that structural gap will not resolve itself.
The question is not whether these sectors matter. It is how much of each you want, at what price, and within what risk parameters. That framework applies not just to CURE and CLNE in this cycle but to every thematic ETF decision you will face in the years ahead.
—