Overnight, the US-Iran conflict tore open the world’s most important oil chokepoint, and markets are repricing everything from crude contracts to semiconductor valuations in real time.
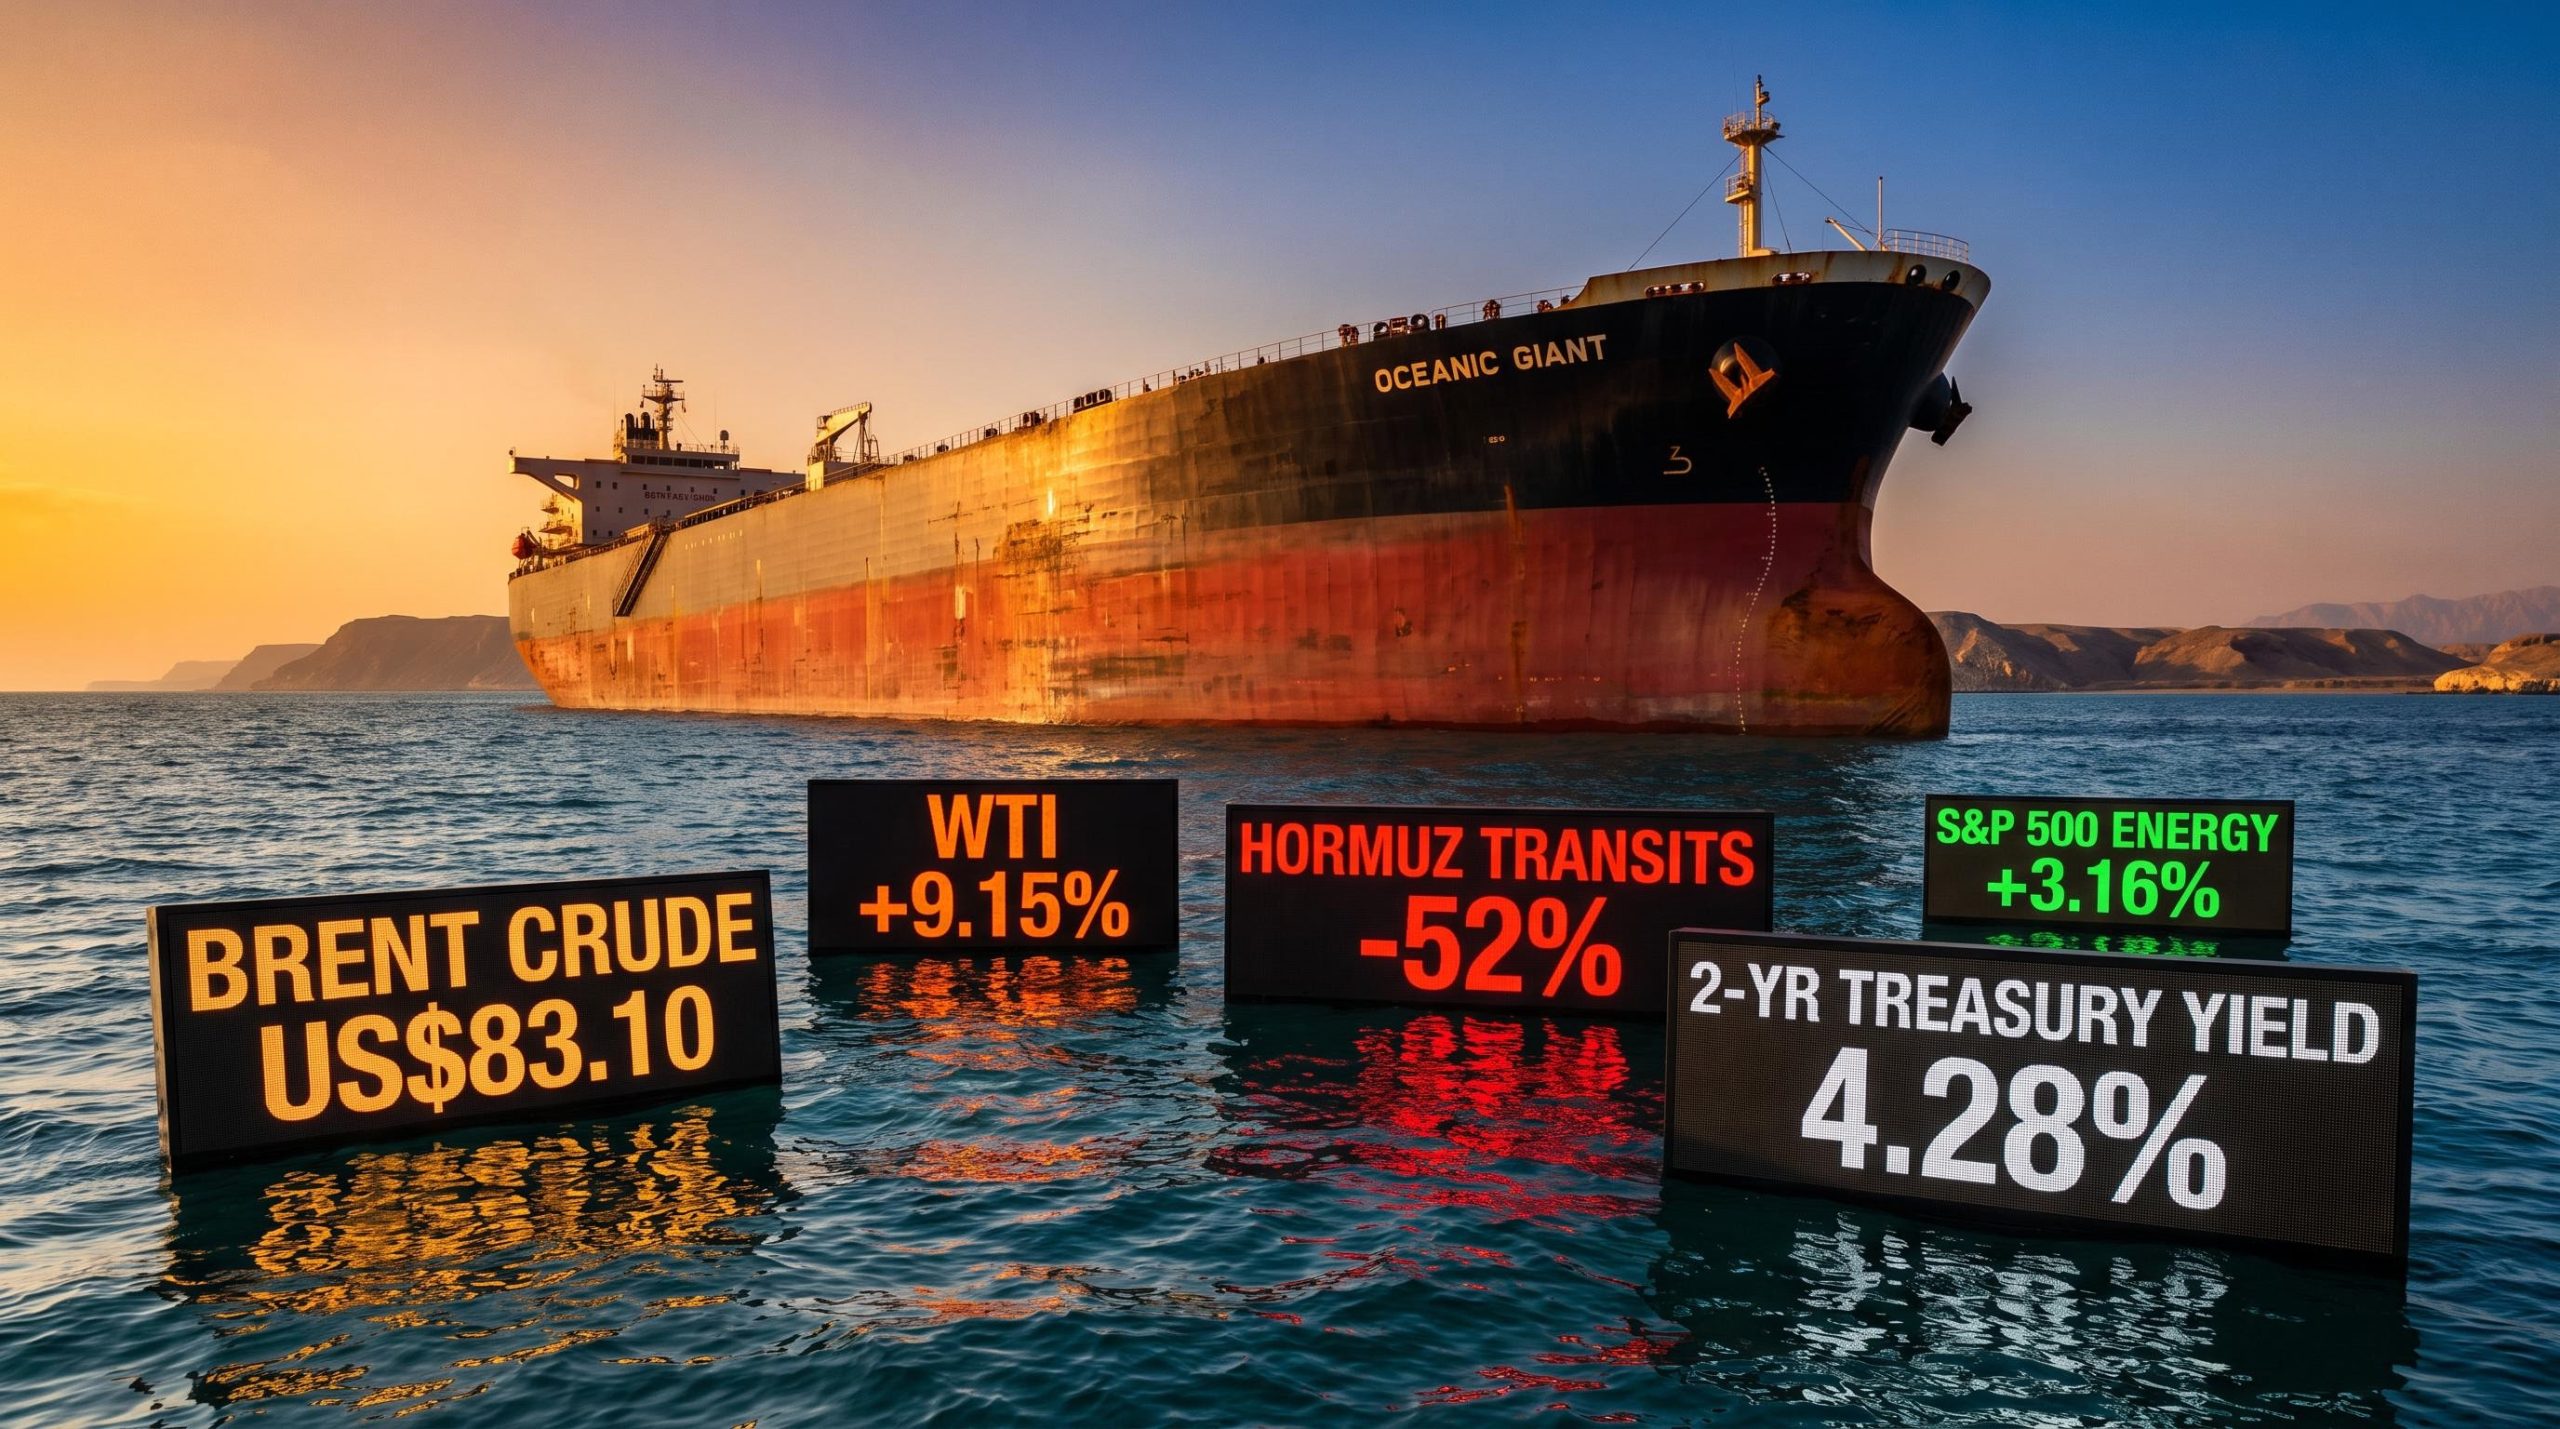
Weekly shipping transits through the Strait of Hormuz fell 52% in a single week as tankers stalled or rerouted following US Central Command strikes and Iranian retaliatory missile attacks. Brent crude hit US$83.10 per barrel, WTI surged 9.15%, and the S&P 500 Energy sector posted its best single-session performance in months. At the same time, tech stocks dropped 2%, Treasury yields climbed to multi-year highs, and gold fell despite the chaos. This session did not behave like a simple flight-to-safety trade, and that asymmetry is what matters most.
Here is what caused this market session, what it means for the sectors moving hardest in either direction, and what three variables will determine whether this is a one-day repricing or the start of a sustained regime shift.
What just changed in the Strait of Hormuz
Over the weekend, US Central Command carried out a broad offensive against Iran, destroying more than 140 targets on Saturday and striking further sites on Sunday. Notably, the operation marked the first use of one-way attack sea drones in this conflict, representing a meaningful step up in the methods of force being deployed.
US Central Command’s 140-target strike package and Iran’s coordinated retaliatory launches across five countries were confirmed by Associated Press reporting, establishing the operational scope of a weekend escalation that markets had not fully priced into Friday’s close.
In response, Iran launched coordinated missile and drone strikes against US military positions across five countries:
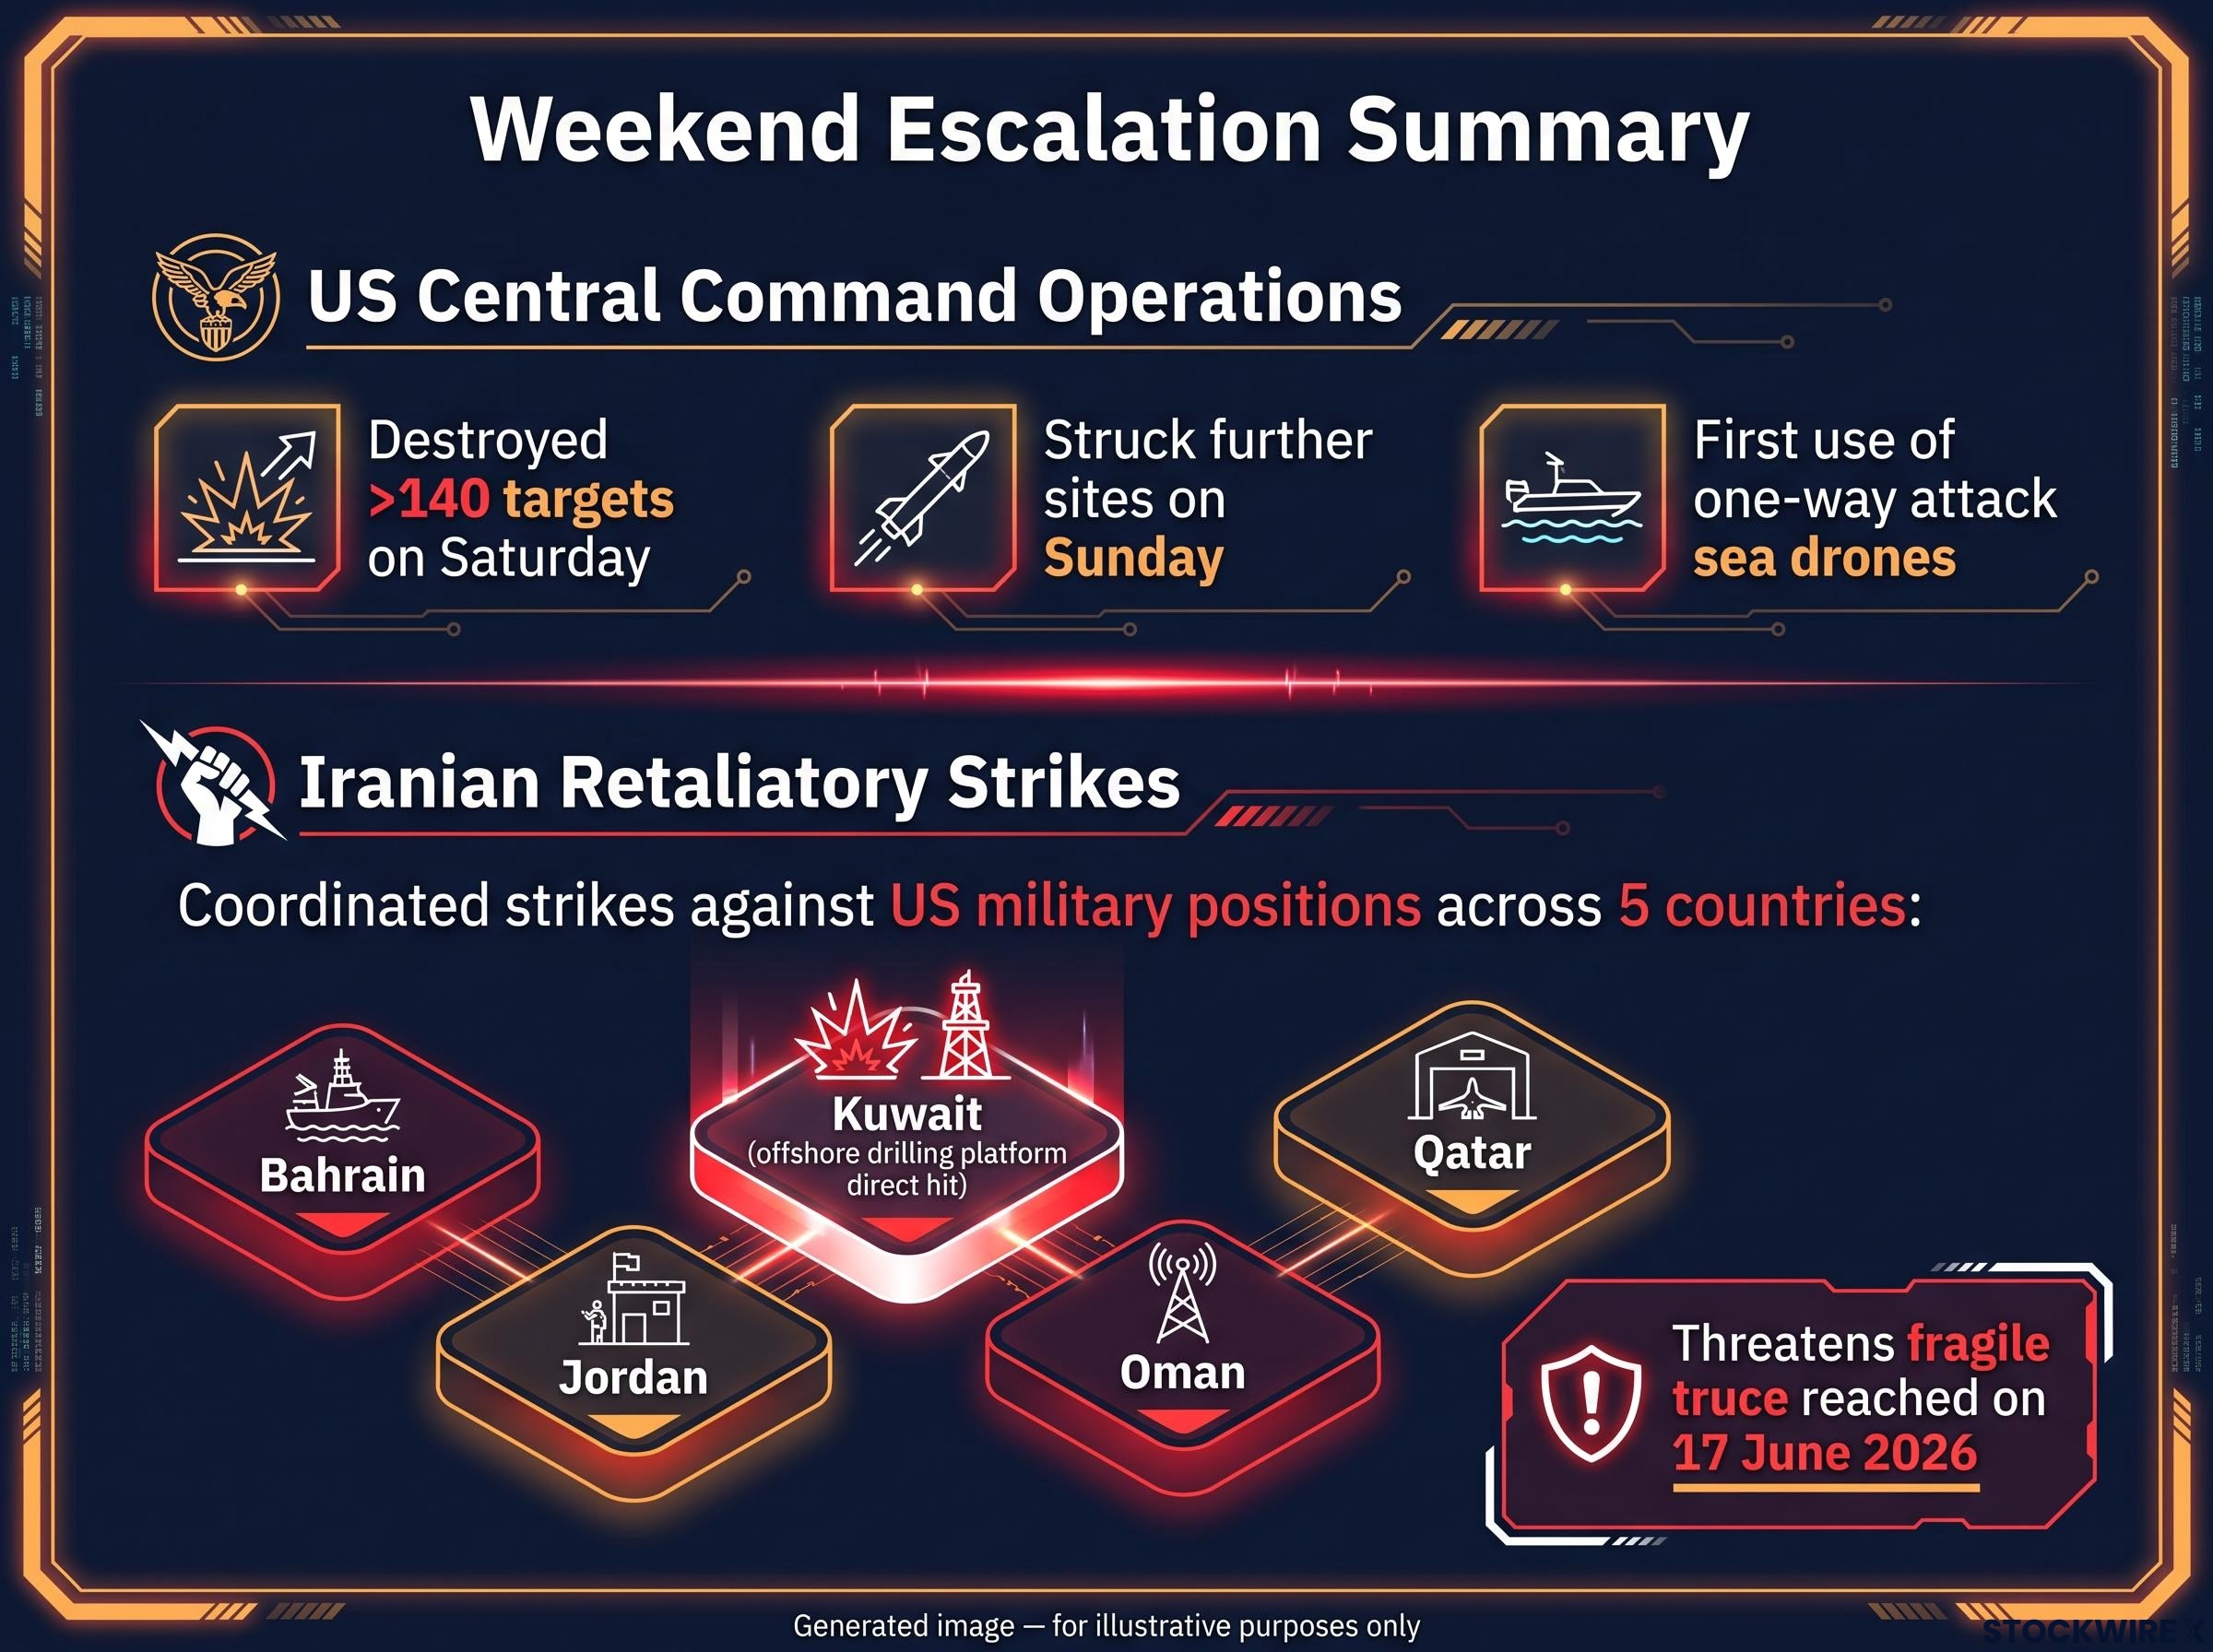
- Kuwait (where an offshore drilling platform sustained a direct hit)
- Bahrain
- Jordan
- Oman
- Qatar
The escalation cast serious uncertainty over the fragile truce the two nations had reached on 17 June 2026, with the fresh violence calling into question whether that framework can hold. President Trump announced that the US would serve as the guarantor of safe passage through the Strait of Hormuz, stating that the waterway would remain open to shipping regardless of what Iran does. Separately, according to Axios, the administration moved to restore a naval blockade restricting vessel movements in and out of Iranian ports, though broader reporting characterises a fully formalised comprehensive blockade regime as not yet confirmed. Trump also put forward a 20% charge on cargo moving through the strait, described as compensation for the security the US is providing. That proposal’s enforcement status remains in flux.
The Strait of Hormuz: why this chokepoint is different
Roughly a fifth of all oil shipped by sea passes through this tight corridor running between Iran and Oman. Any sustained disruption here is structurally inflationary, not locally contained.
Vessel tracking data cited by Reuters showed that weekly shipping transits through the strait dropped 52% against the previous week, bringing Hormuz traffic to its lowest level in two months. For any investor holding energy, logistics, or global industrials exposure, that 52% collapse in physical shipping is the number that explains why portfolios moved today. This is not a disruption that resolves in days. Dubai’s planned port facility on the Fujairah coast signals that regional actors are already pricing in a longer disruption horizon.
When big ASX news breaks, our subscribers know first
Oil surges, but the energy trade is more nuanced than it looks
Brent crude surged to US$83.10 per barrel on 14 July 2026, the highest level since 16 June 2026. WTI crude jumped 9.15% to US$78.00 per barrel.
Key context: At US$83.10, Brent is running roughly 16% above where it traded before the conflict began, a move that goes well beyond a single-session reaction and into territory that actively reshapes inflation expectations.
The S&P 500 Energy sector posted a 3.16% gain on the session, its strongest single-day result since the conflict’s earlier phases, and has clawed back approximately 7.4% from the trough it set on 1 July 2026.
But the gap between a 9% crude spike and a 3% equity sector gain tells you the market is not fully convinced this disruption is structural. Energy equities historically underreact to geopolitically driven oil spikes because the market discounts rapid de-escalation risk. If Hormuz traffic data deteriorates further next week, that discount closes fast. The pattern gives investors a framework for assessing whether the sector move has more room rather than chasing the commodity price alone.
How the rest of the market is rotating (and why)
The 14 July session produced a clean sector rotation: energy and defensives outperformed, while rate-sensitive growth and cyclical sectors absorbed the heaviest selling. The mechanism is straightforward. Rising oil drives inflation expectations, which lifts yields, which compresses the present value of future earnings most severely in long-duration growth stocks. That is why tech was hardest hit.
Capital rotation patterns in 2026 had already shifted before this session, with energy gaining more than 22% year-to-date and institutional strategists advocating a barbell of retained quality technology alongside defensive income plays, a positioning framework that today’s sector moves reinforce rather than contradict.
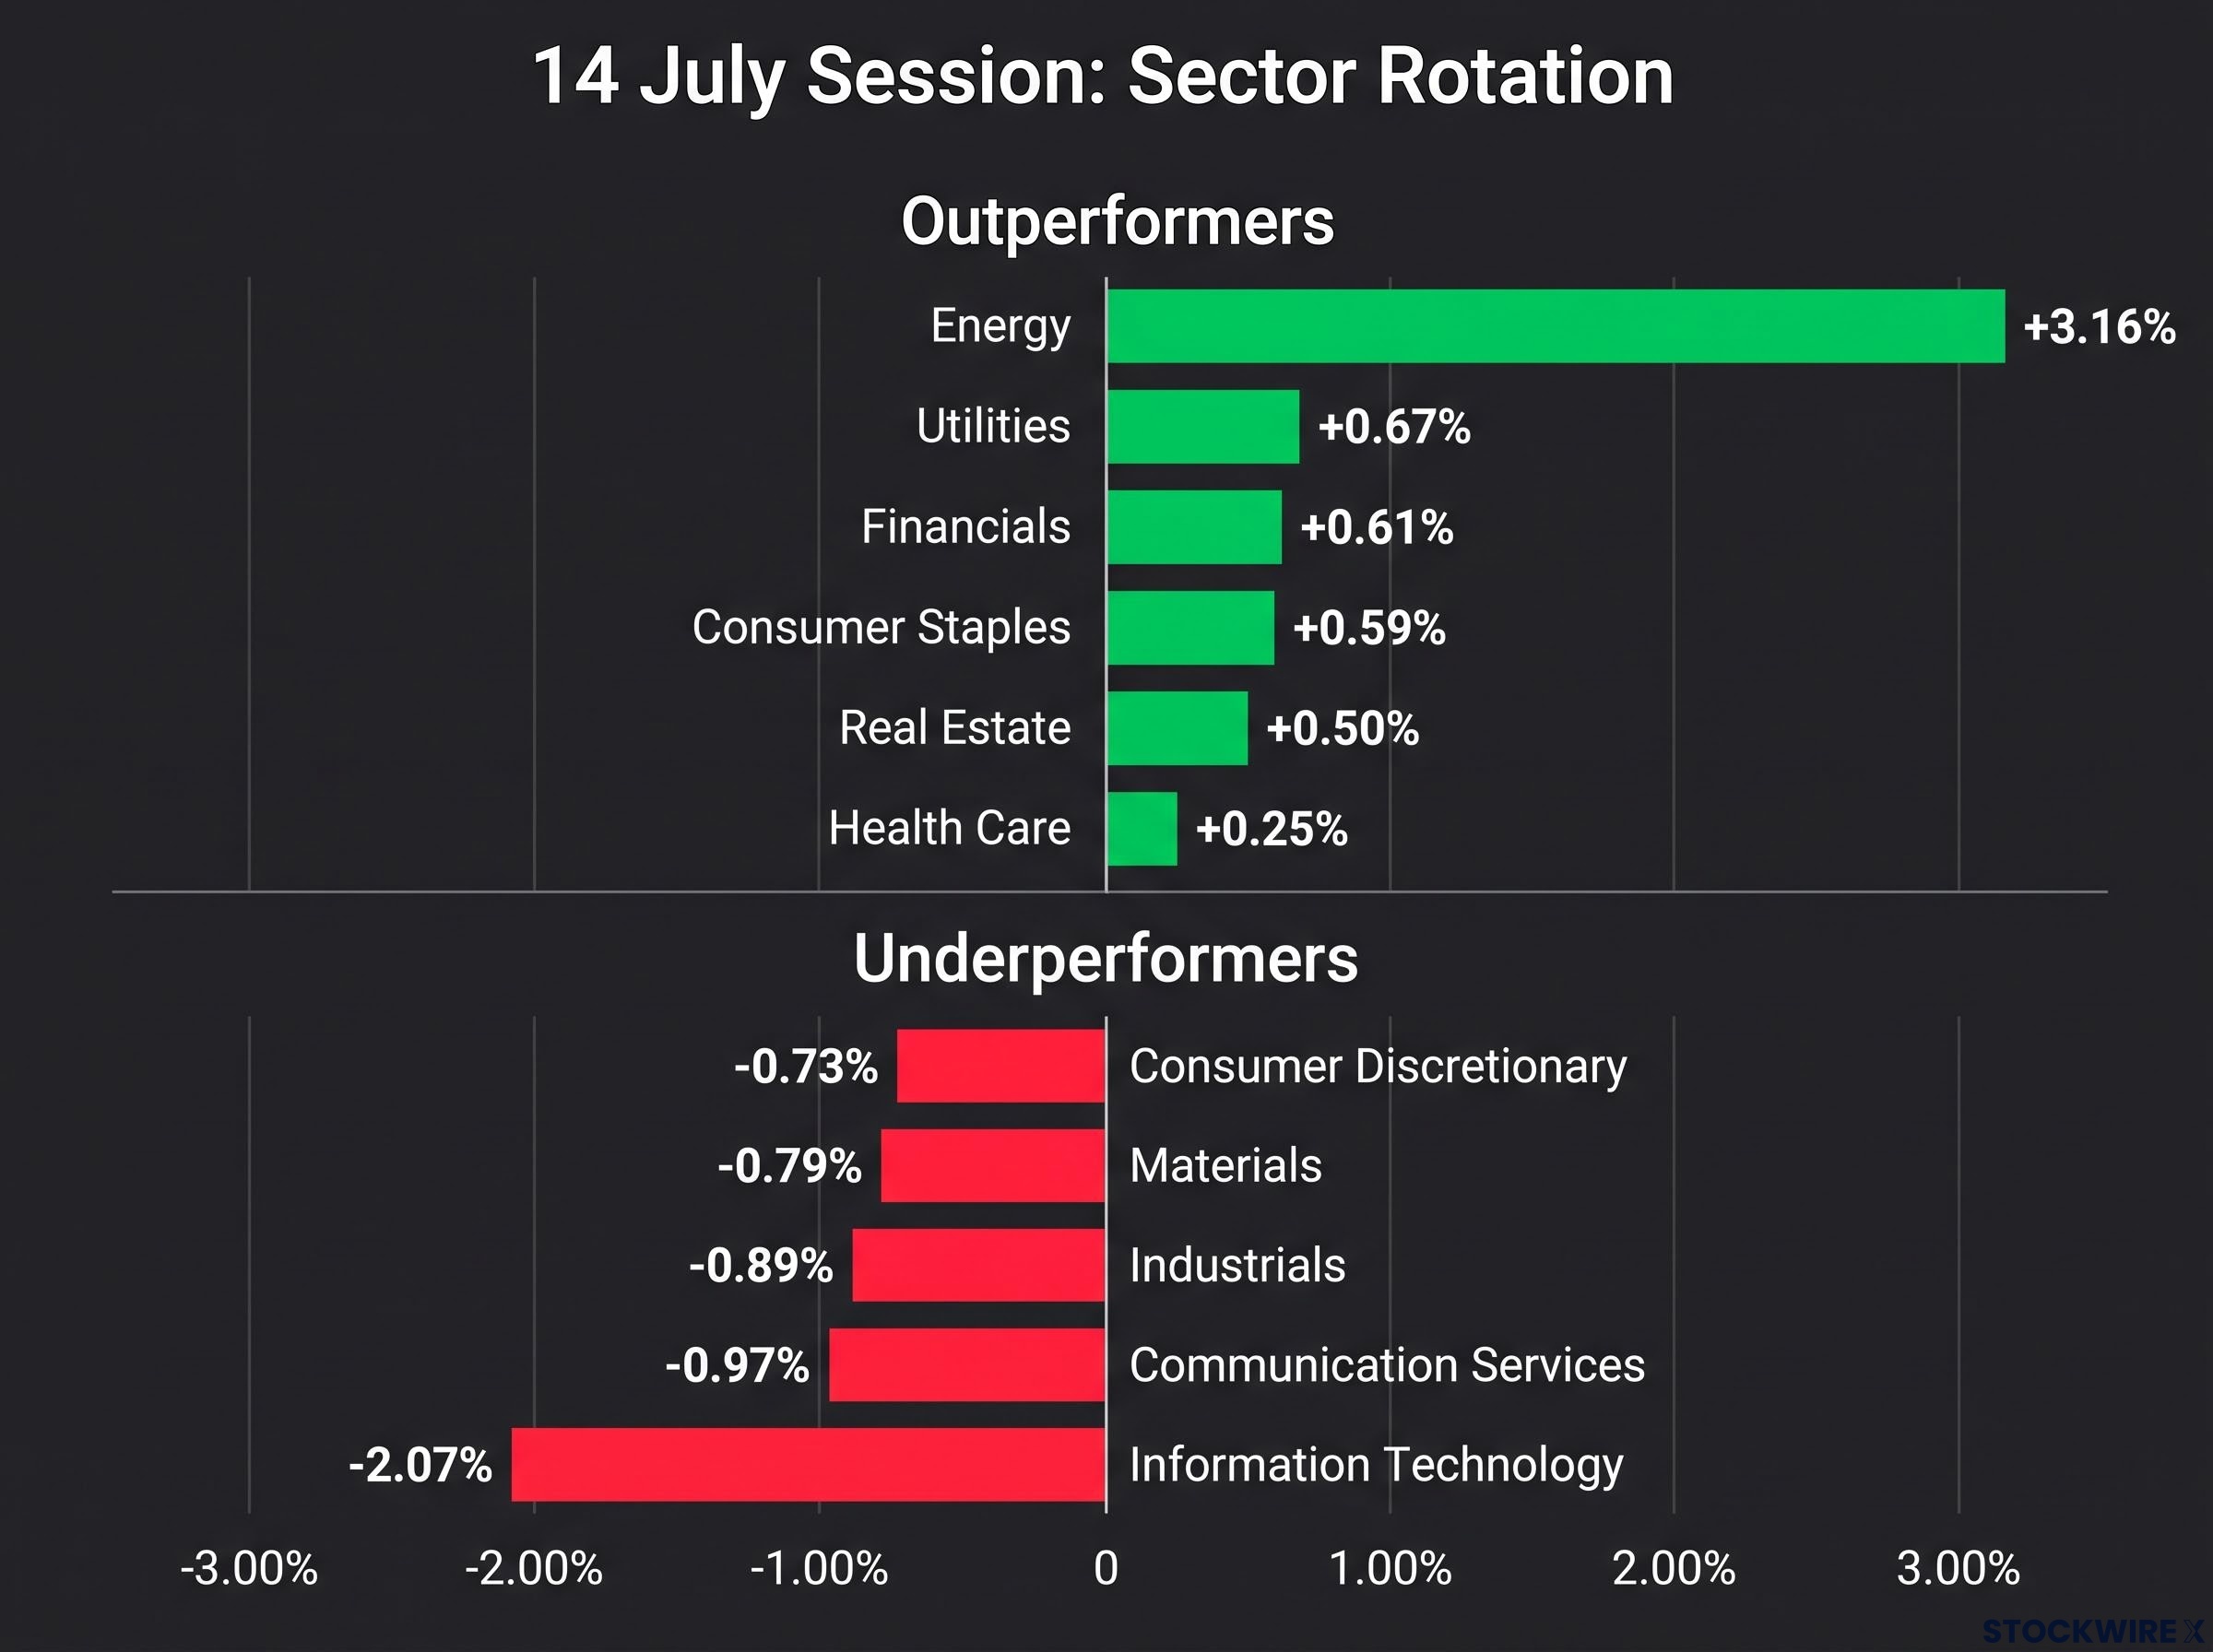
| Sector | Direction | Session move |
|---|---|---|
| Outperformers | ||
| Energy | Up | +3.16% |
| Utilities | Up | +0.67% |
| Financials | Up | +0.61% |
| Consumer Staples | Up | +0.59% |
| Real Estate | Up | +0.50% |
| Health Care | Up | +0.25% |
| Underperformers | ||
| Information Technology | Down | -2.07% |
| Communication Services | Down | -0.97% |
| Industrials | Down | -0.89% |
| Materials | Down | -0.79% |
| Consumer Discretionary | Down | -0.73% |
Mining equities were a separate category of underperformer, pressured by US dollar strength and rate-hike repricing rather than any direct exposure to Hormuz shipping flows:
- Gold Miners ETF: fell 2.86% to 73.37, sitting approximately 15.7% in the red year-to-date and at its weakest point since 21 November 2025
- Uranium ETF: dropped 5.24% to 40.72, recording its lowest closing level since 5 September 2025 and now down approximately 6% year-to-date
- VanEck Rare Earth/Strategic Metals ETF: declined 4.3% to 76.27, its lowest reading since 2 January 2026
- Copper Miners ETF: -2.86%
- Silver Miners ETF: -2.74%
What is driving these miners lower has nothing to do with tanker counts in the Persian Gulf. The real culprits are a rising dollar and markets pricing in renewed rate pressure, and treating this selloff as a geopolitical trade leads to the wrong positioning decision.
Why Treasury yields are the hidden driver of this session
The Hormuz shock did not hit equities directly. It hit them through yields.
Higher oil raised inflation expectations, which pushed yields up, which compressed growth stock valuations through a discount rate effect (the mechanism by which future earnings are worth less today when interest rates rise). That single chain of causation unites every disparate move from this session.
On 14 July 2026, the 2-year Treasury yield reached 4.28%, its highest level in 17 months. For any investor expecting rate cuts in the next two quarters, this session is a serious complication to that thesis.
The 10-year Treasury yield climbed to 4.609%, up 0.88% on the session. The VIX surged 14.17% to 17.16, elevated but below acute stress levels. Even gold shed 2.83% to close at US$4,004.28, a reminder that assets traditionally regarded as safe havens are not immune when a stronger dollar and rising yields are the dominant forces.
What the Fed does next will matter more than the next headline
Federal Reserve statements on inflation and rate expectations in coming weeks will be a primary input to growth and technology equity valuations, independent of whether the military situation escalates or de-escalates. Elevated oil prices complicate the central bank’s path to rate cuts, and any hawkish signal from the Fed will extend the pressure on rate-sensitive sectors.
Fed committee fractures between pro-cut and pro-hike factions, visible in the FOMC’s largest dissenting vote since 1992, mean that any hawkish signal from Warsh in coming weeks would land on a committee already predisposed toward tightening, amplifying the yield and growth-equity pressure the current oil shock is generating.
A VIX at 17.16 signals elevated anxiety but not crisis pricing. The market has room to reprice further if Fed commentary turns hawkish in response to oil-driven inflation data.
What is Hormuz, and why does it matter so much
Linking the Persian Gulf to the Arabian Sea, the Strait of Hormuz is a narrow corridor running between Iran and Oman. Roughly one in every five barrels of seaborne oil moves through it. That concentration makes it a single point of failure for global oil supply, meaning disruption does not stay regional; it transmits immediately to global prices.
Markets had previously adopted an infrastructure-specific pricing framework for this conflict, where risk premiums rose materially only when the strait or production facilities faced direct physical threat; the 52% transit collapse reported this week represents precisely the kind of concrete disruption signal that framework treats as a genuine repricing trigger.
For a US investor, Hormuz is not a foreign policy abstraction. It is a direct input to domestic petrol prices, airline fuel costs, and the inflation number that drives Federal Reserve decisions.
Three reasons it cannot be easily bypassed in the near term:
- Geography: The strait narrows to roughly 33 kilometres at its tightest point, with designated shipping lanes even narrower. There is no alternative maritime route out of the Persian Gulf.
- Pipeline capacity limits: Existing overland pipelines that bypass Hormuz carry a fraction of the volume that transits by tanker. They cannot absorb a 52% traffic decline.
- Alternative port timelines: A port development project on Dubai’s Fujairah coastline represents a possible long-run alternative, but construction schedules place it well beyond any window that could alleviate the current supply shock.
What investors should watch to know which way this resolves
The session was dramatic. What matters now is whether it becomes a pattern. Four specific, observable signals will tell you:
- Hormuz weekly shipping transit data. This is the primary leading indicator of supply shock severity. If the 52% decline deepens or persists into next week, the oil move extends.
- Policy trajectory. Track developments around the proposed 20% transit charge (put forward as a policy proposal with enforcement status unresolved as of 14 July 2026) and whether the naval blockade on Iranian ports moves toward a fully formalised structure (restored according to Axios, but a comprehensive regime has not been confirmed in broader reporting).
- Federal Reserve and central bank statements. Yield moves and rate expectations will drive growth and technology equity valuations as much as any military development.
- Sector positioning signals. Energy and defensives (utilities, staples, health care) remain relative beneficiaries in continued escalation; beaten-up growth sectors are potential rebound candidates if de-escalation gains credibility.
Three scenarios to frame your monitoring: Base case: Intermittent disruption, elevated oil, yields under upward pressure. Sector leadership skews toward energy and quality defensives. Escalation: Extended Hormuz closure or formalised blockade. Sharper oil shock, deeper drawdowns in risk assets. De-escalation: Credible ceasefire, partial shipping normalisation. Energy consolidates; growth sectors could rebound.
The investor who monitors Hormuz transit volumes and Fed language simultaneously is watching the two inputs that will determine whether today’s rotation is a tactical trade or the beginning of a sustained regime.
What today’s session tells you about the weeks ahead
The 14 July session was not a simple flight-to-safety trade. It was a simultaneous supply shock (energy up) and rate-repricing (growth down) event, driven by a single geopolitical trigger operating through two distinct transmission channels.
Those two channels, the physical supply disruption flowing through Hormuz traffic data and the inflation-to-yields chain flowing through Fed language, are the durable lens for reading future sessions. Watch both. They will not always move in the same direction, and knowing which one is driving the day’s price action is the difference between informed repositioning and reactive headline trading.
In a high-materiality event like this, the investors who fare best are those who distinguish the signal (physical disruption severity, policy trajectory) from the noise (single-session price moves, unconfirmed blockade characterisation). The framework is set. The data will fill it in.
For readers wanting a rigorous analytical framework to apply to future sessions, our dedicated guide to sector rotation strategy explains how business cycle phases structurally favour different sectors and how to use Relative Rotation Graphs and fund flow data to track institutional positioning in real time.
This article is for informational purposes only and should not be considered financial advice. Investors should conduct their own research and consult with financial professionals before making investment decisions. Past performance does not guarantee future results. All specific price levels, blockade status, and levy details remain subject to rapid change with new policy announcements or military developments.