SpaceX IPO Hits $3 Trillion Market Cap in 72 Hours
30 mins ago
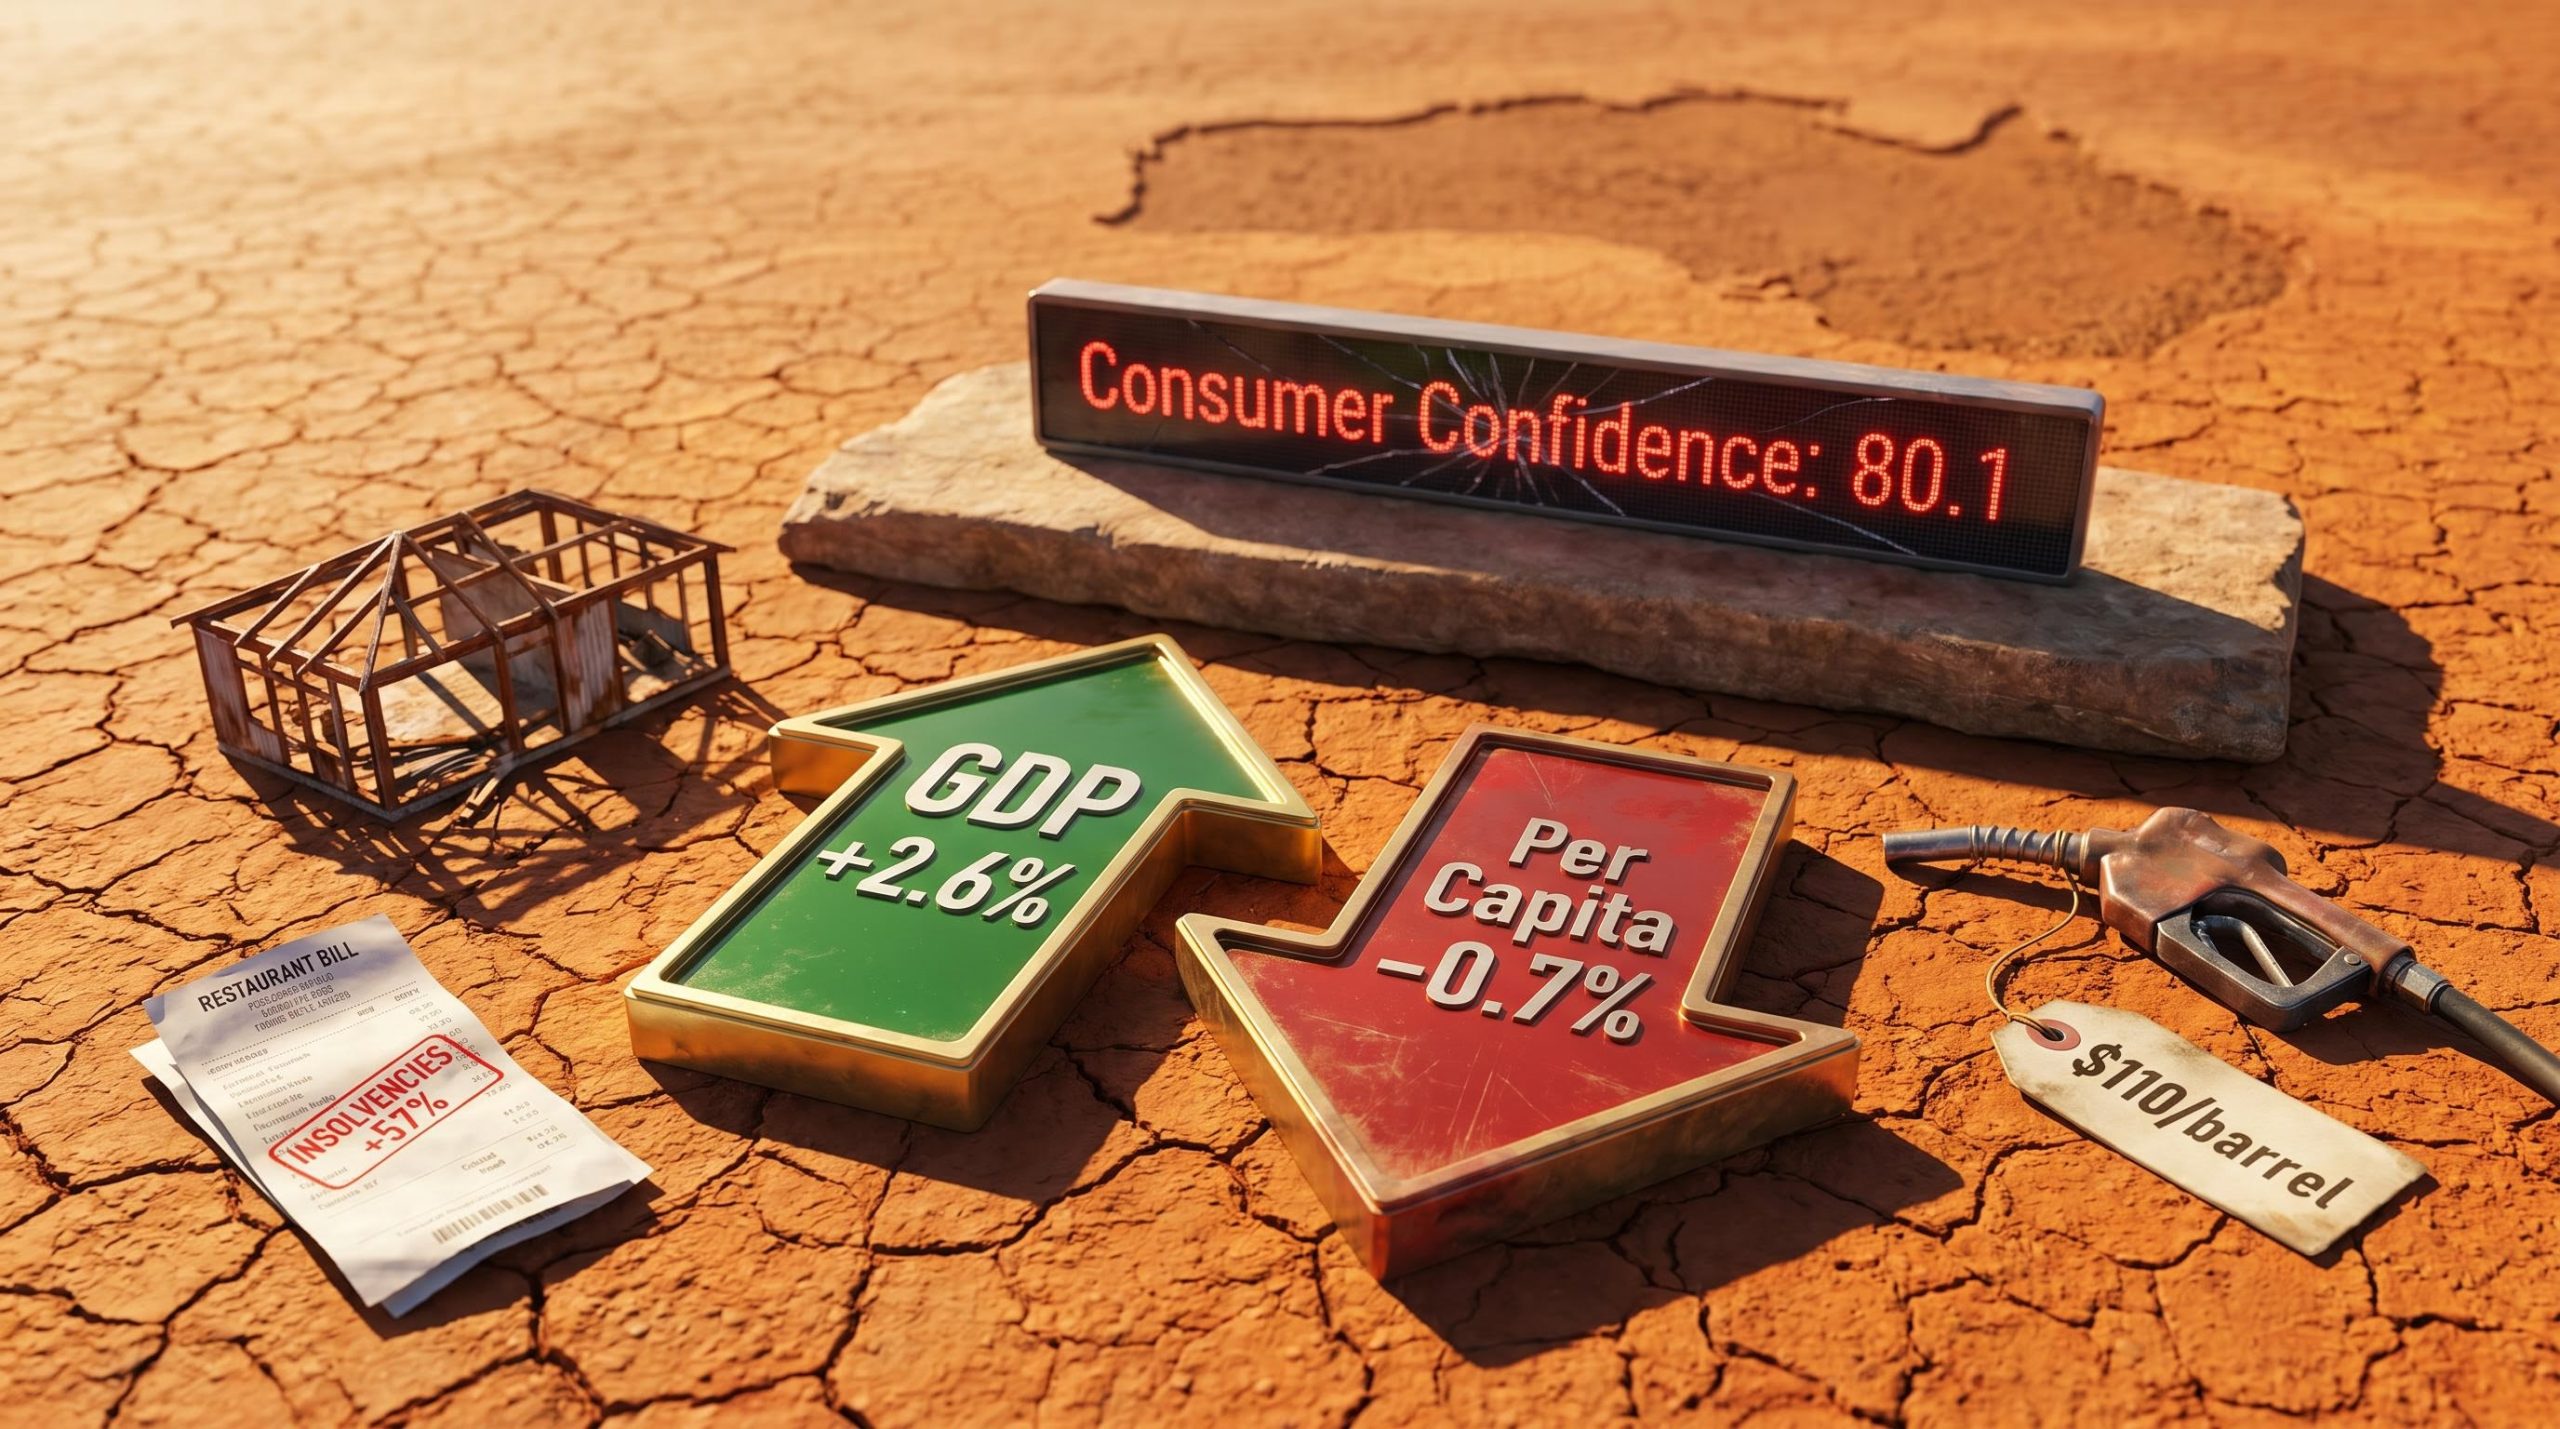
Australia’s headline GDP expanded at an annualised rate of 2.6% in the December quarter of 2025, the strongest pace in nearly three years. On paper, the economy is growing. In practice, corporate insolvencies have reached their highest level since the 1990-91 recession, consumer confidence has collapsed to readings not seen since the pandemic, and real wages have gone backwards. The gap between what the official numbers say and what households and businesses actually experience has never been wider.
How a recession is measured matters enormously. The standard “two consecutive quarters of negative GDP” definition captures one kind of contraction; it misses others entirely. This analysis breaks down the difference between headline GDP growth and per capita economic output, profiles the sectors where the damage is concentrated, traces the fuel shock that accelerated the pain, and provides a practical framework for reading economic data more critically, so that the next time a GDP figure lands, readers can evaluate it on their own terms.
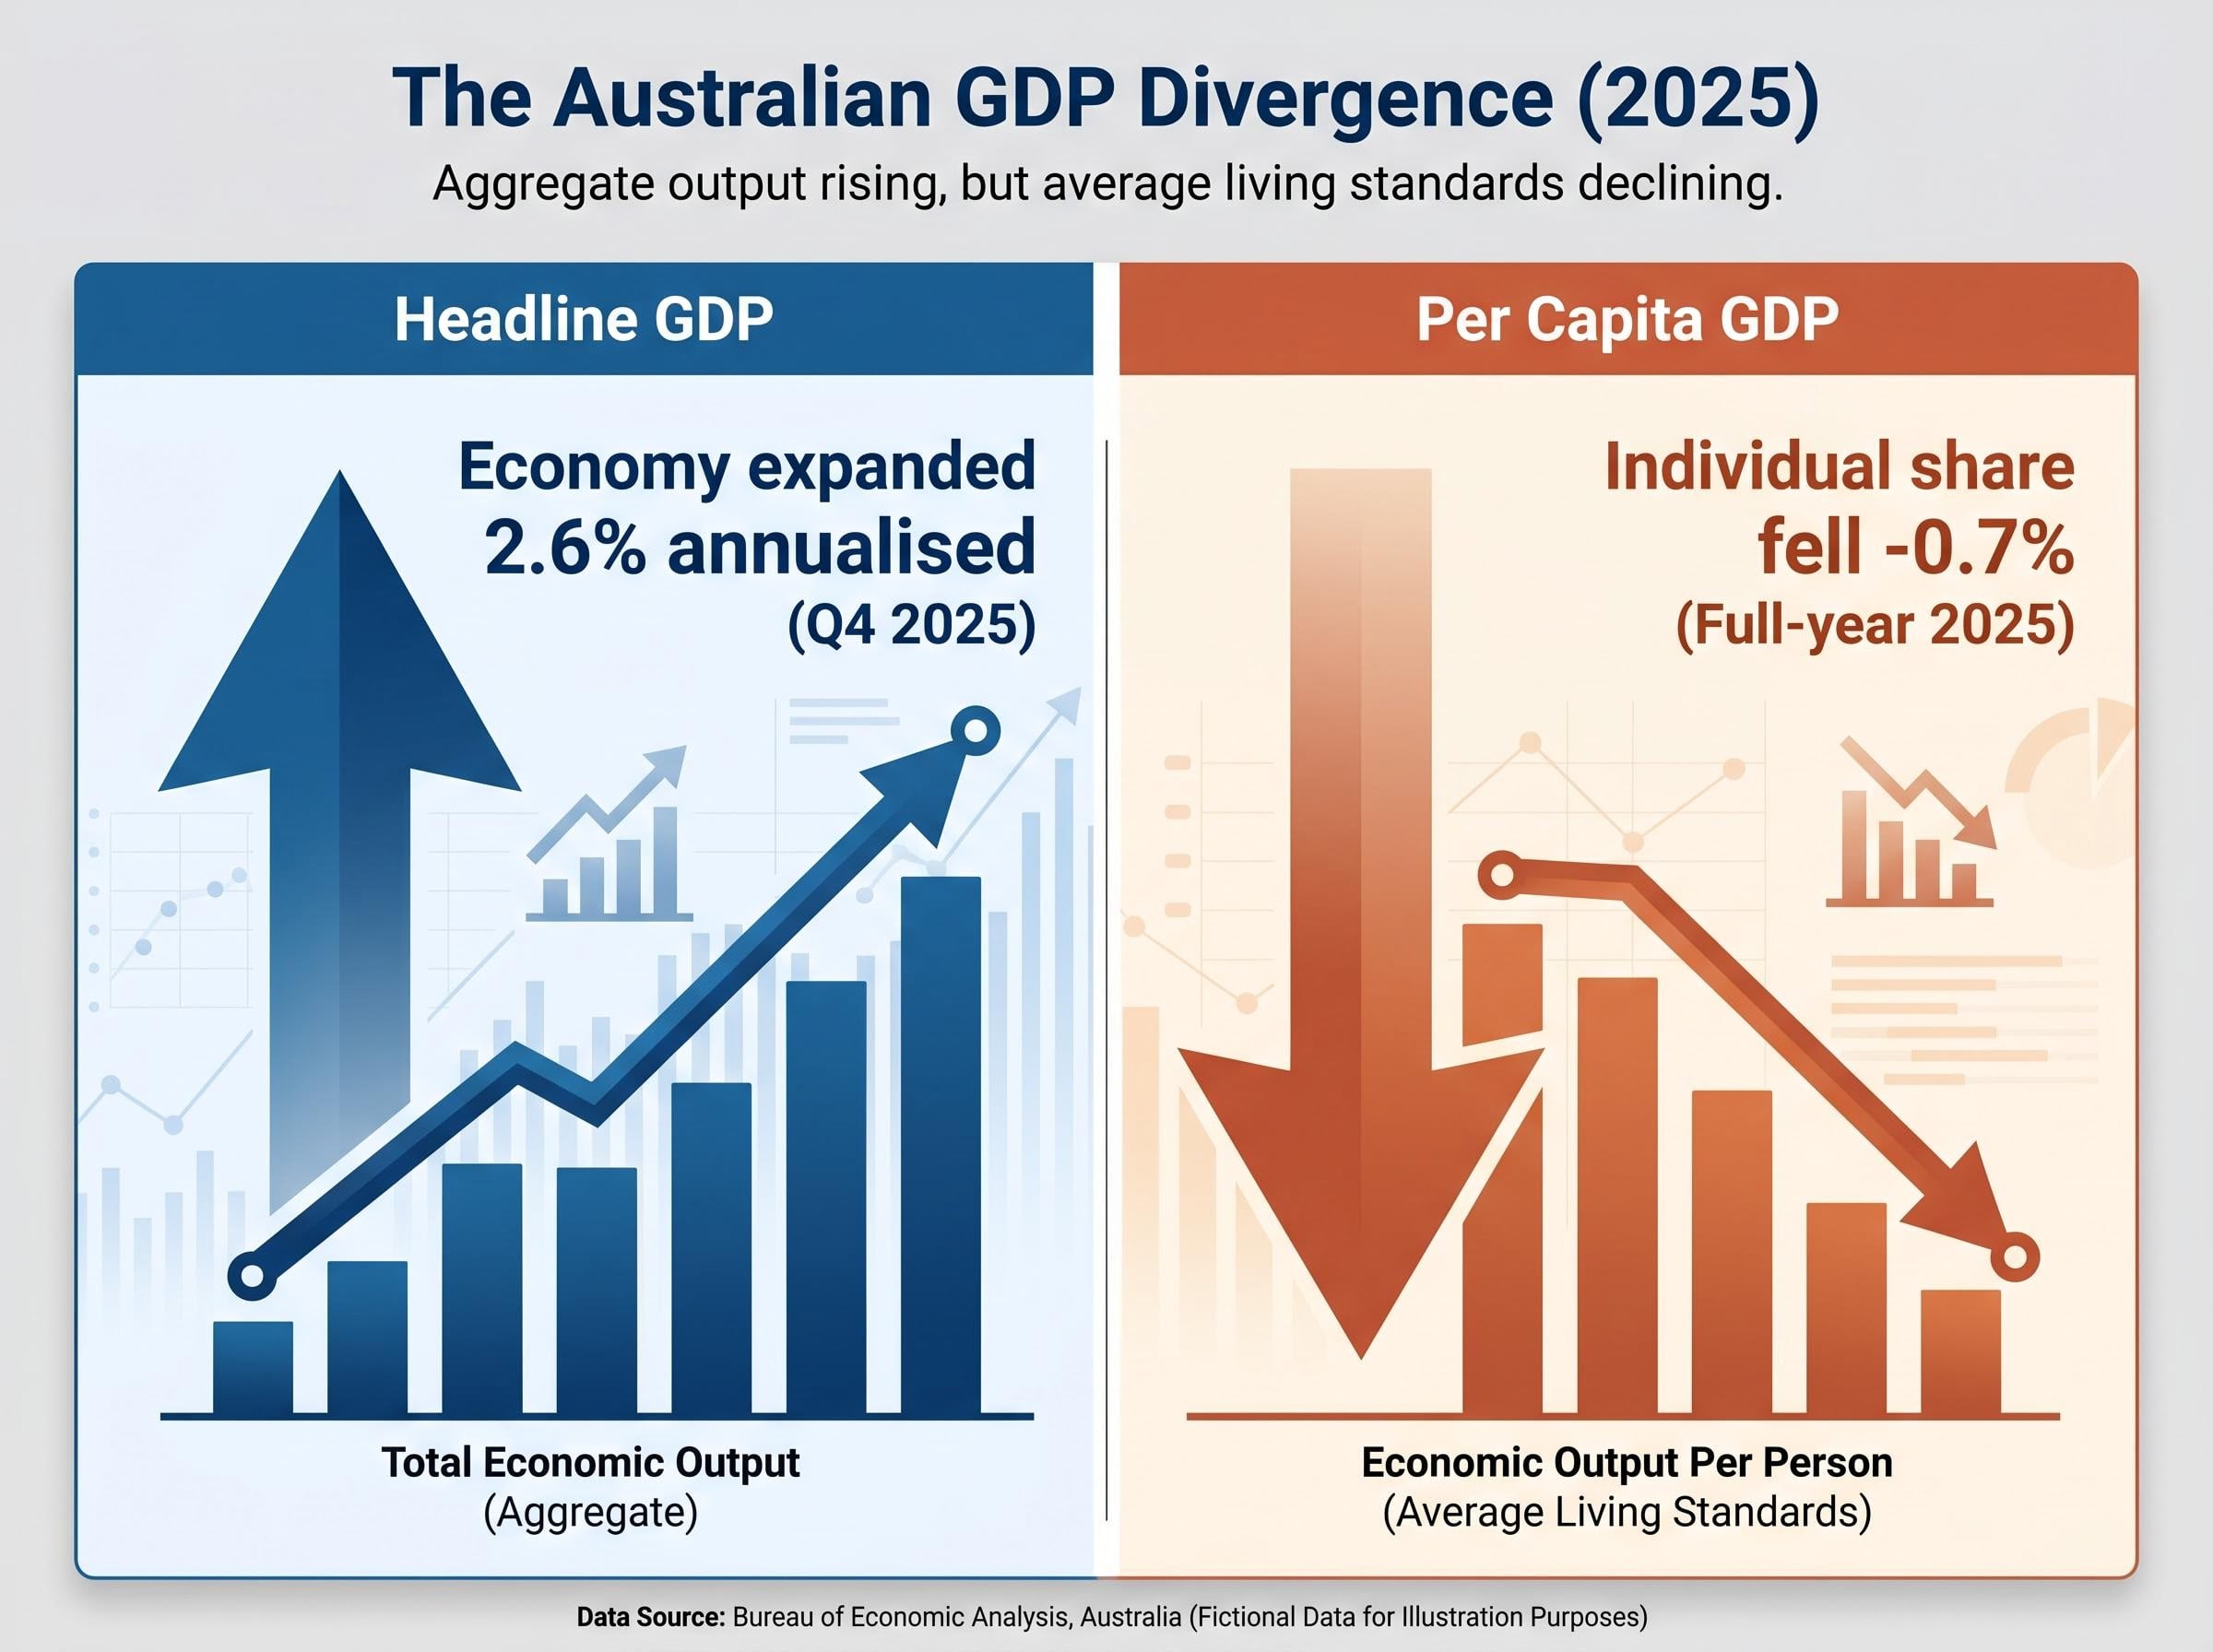
That 2.6% annualised growth figure in the December quarter of 2025 looks healthy until one variable is introduced: population. Australia recorded one of the fastest rates of population growth in the developed world over the same period. When the same GDP is divided across a rapidly expanding population, the picture inverts.
Per capita GDP, the measure of economic output per person, declined approximately -0.7% across full-year 2025, according to ABS data released in March 2026. The economy grew in aggregate; the average person’s share of that economy shrank.
The ABS national accounts data released in March 2026 recorded aggregate GDP growth of 2.6% annualised in the December quarter while showing per capita output declining across the full year, a divergence that illustrates precisely why headline figures can misrepresent the distribution of economic gains across a rapidly growing population.
The Australian government’s Mid-Year Economic and Fiscal Outlook (MYEFO), published in December 2025, projected +1.5% per capita GDP growth for 2026. Most private forecasters now consider that figure optimistic. However, the picture is genuinely contested: KPMG’s Q1 2026 Outlook projects mild 1.7% overall growth and notes some stabilisation in per capita terms, a reading that complicates the narrative of relentless decline.
What headline GDP shows versus what per capita GDP shows:
The April Flash Purchasing Managers’ Index (PMI) reinforces the ambiguity: 50.1 in April, barely above the 50.0 threshold separating expansion from contraction, and recovering from a contractionary 46.6 in March. That is a fragile rebound, not a recovery.
A per capita recession occurs when total GDP grows while the average person’s share of economic output shrinks. This happens when population growth is the primary driver of aggregate expansion rather than productivity gains or rising real incomes. It does not require two consecutive quarters of negative headline GDP. It can persist invisibly within positive aggregate growth figures for extended periods, which is precisely what has occurred in Australia.
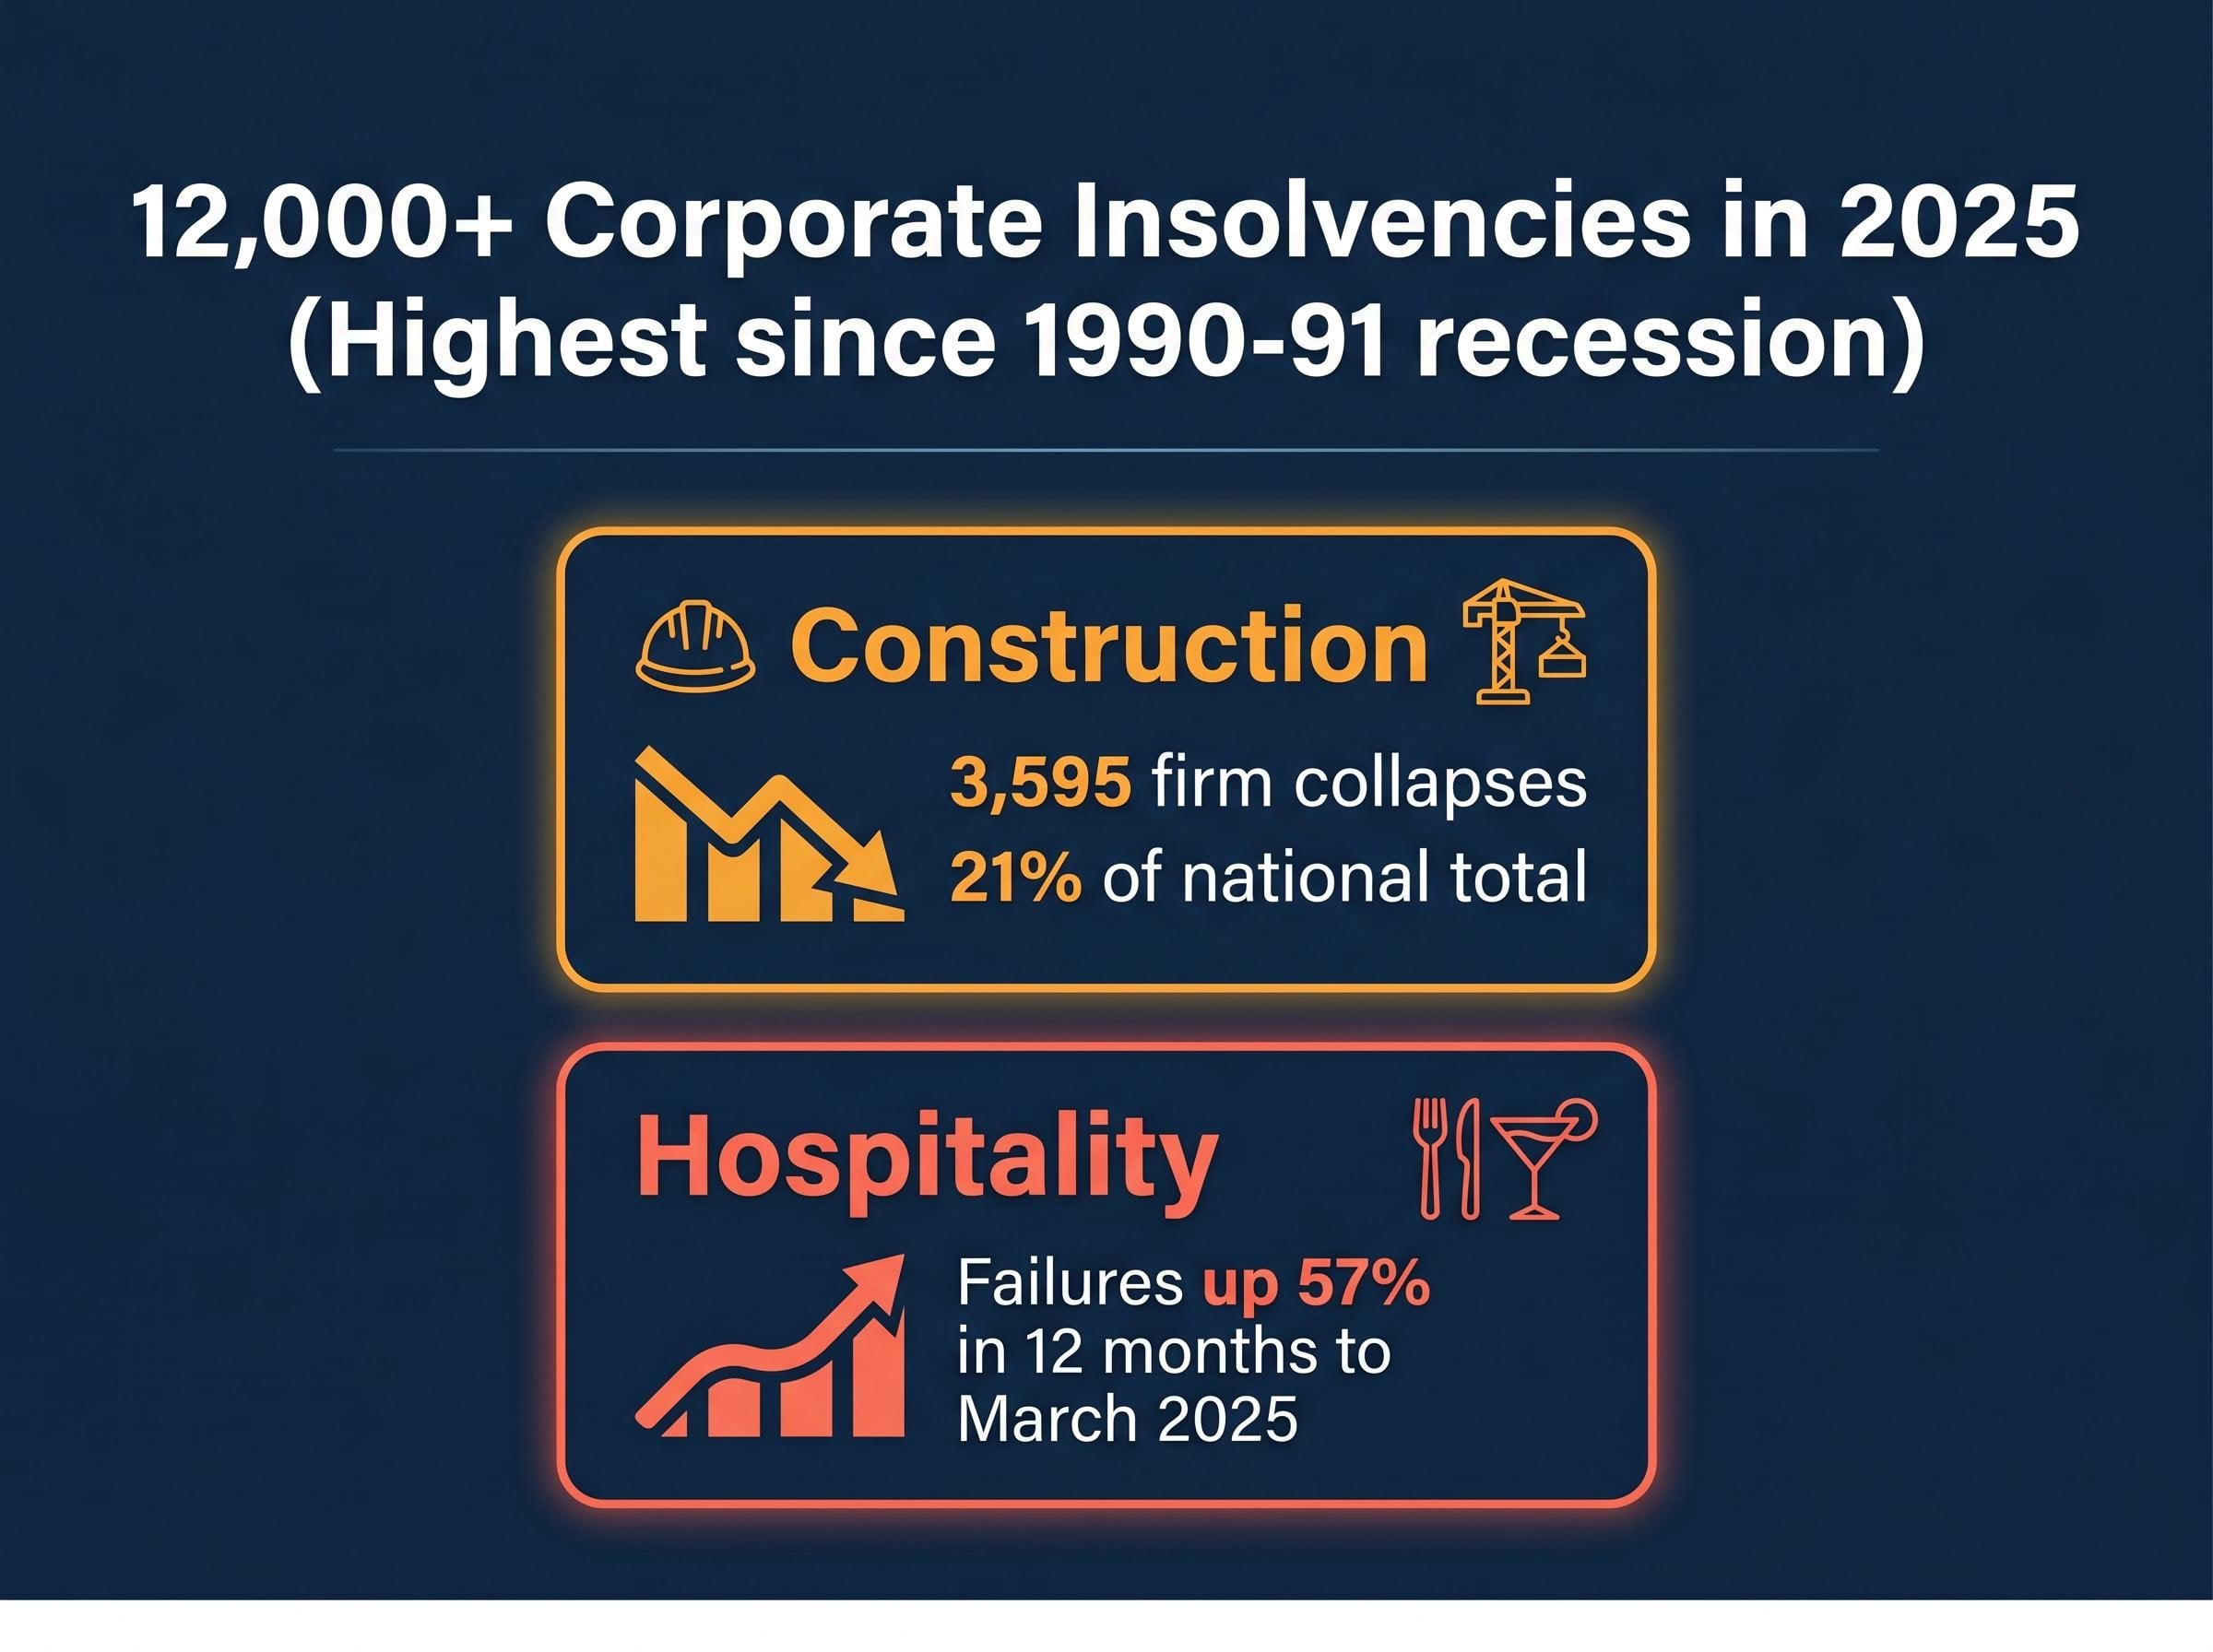
Full-year 2025 recorded approximately 12,000+ corporate insolvencies across Australia, the highest level since the 1990-91 recession. The failures were not evenly distributed. Two sectors absorbed a disproportionate share of the damage, and the pattern reveals structural vulnerabilities that pre-existed the current cycle.
Construction accounted for 3,595 firm collapses in 2025 alone, representing 21% of all national business failures. The sector’s exposure was specific: fixed-price contracts signed before the cost surge locked builders into margins that evaporated as materials, fuel, and financing costs climbed simultaneously. Persistent interest rates at 4.10% compounded the pressure, choking project financing and delaying new starts.
Construction cost acceleration tied to oil-derived building materials and diesel-powered supply chains has added a self-reinforcing dimension to the sector’s distress: the same fuel shock that crushed margins on existing fixed-price contracts is simultaneously pushing up the cost base for any new project a surviving firm might take on.
Hospitality failures rose 57% in the twelve months to March 2025. Margin compression from fuel costs, mandated wage increases, and weakened discretionary consumer spending combined to destroy viability for operators already running on thin margins. The sector’s cost structure offers almost no buffer; when inputs rise and customer spending falls simultaneously, closures follow quickly.
Projections for 2026 point to a continuation or worsening of 2025’s record pace, though specific analyst figures have not been independently verified. The directional trend is consistent across forecasters: insolvencies are rising, not stabilising.
| Sector | 2025 Insolvency Impact | Key Pressure Driver |
|---|---|---|
| Construction | 3,595 firm collapses (21% of national total) | Fixed-price contract exposure, materials cost blowouts, persistent interest rates |
| Hospitality | Insolvencies up 57% in 12 months to March 2025 | Fuel costs, wage increases, weakened discretionary spending |
| Retail | Elevated failures amid consumer pullback | Real wage decline reducing household spending capacity |
NAB Business Survey, March 2026: Business confidence fell 29 points in a single month, the sharpest collapse in the survey’s recent history. NAB’s capacity utilisation measure sits at levels historically consistent with unemployment above 5%, well above the official 4.3% rate.
The arithmetic is straightforward and unforgiving. A worker whose wages rise by 3.4% in a year where prices rise by 3.7% has not received a pay rise in any meaningful sense. Purchasing power has declined. The pay packet is larger in nominal terms and buys less in real terms.
That is the condition facing Australian workers in early 2026. The Wage Price Index (WPI) recorded growth of approximately 3.4% year-on-year, while headline CPI inflation ran at 3.7%. The RBA’s preferred trimmed mean measure, which strips out volatile price swings, came in higher still at 3.9%. On a WPI basis, real wage growth sat at approximately -0.3% year-on-year.
How a nominal pay rise becomes a real pay cut:
The consumer response has been measurable and severe. The Westpac-Melbourne Institute Consumer Sentiment Index fell 12.5% in April to 80.1, its lowest reading since the pandemic. Household expenditure declined 0.5% in December and remained subdued through the following months. Mortgage arrears rose approximately 15% year-on-year, according to the RBA’s Financial Stability Review published in April 2026.
Two-thirds of CPI basket items are rising at an annualised pace above 3%, a figure that matters because it demonstrates the cost-of-living pressure is not a narrow fuel story that will resolve when oil prices retreat; it is a broad-based squeeze that the trimmed mean, at 3.9%, was already capturing before the Hormuz disruption added its separate layer.
The RBA Financial Stability Review published in April 2026 flagged rising household mortgage stress as one of the primary financial system risks, with arrears data consistent with the consumer confidence collapse and real wage deterioration documented across the broader economy.
ANZ-Roy Morgan Consumer Confidence Survey: The index hit a record low in late March 2026, the weakest reading since the survey’s inception in 1973. That is not a soft patch. It is the lowest confidence Australians have recorded in over half a century.
The feedback loop is direct. When real purchasing power falls, discretionary spending contracts, which feeds directly into the business failures documented in the previous section. The wage squeeze and the insolvency crisis are not parallel stories; they are the same story told from different ends.
Australia imports approximately 80% of its fuel. When the Iran-linked conflict disrupted shipping through the Strait of Hormuz in early 2026, the transmission to Australian households and businesses was rapid, broad, and severe.
Crude oil prices rose to approximately $110 per barrel before retreating to around $95 following the ceasefire on 8 April 2026, a level still well above pre-conflict pricing. Diesel prices, which flow directly into freight, construction, and agricultural costs, rose to nearly three times their start-of-year level. The ceasefire brought diplomatic relief; maritime disruptions in the Strait of Hormuz have continued.
Energy Minister Chris Bowen noted that Australia held just 46 days of domestic petrol supply reserves, underscoring the country’s vulnerability to prolonged disruption.
Four transmission channels carried the fuel shock into the broader economy:
Fizz.org research: A $1 rise in petrol prices delivers a household impact equivalent to losing approximately $3,475 in monthly income, a figure that captures the compounding effect across transport, groceries, and energy bills simultaneously.
Construction and hospitality, the two sectors driving insolvency records, are also the two most fuel-cost-exposed industries in the Australian economy. The fuel shock did not create their vulnerabilities. It converted existing structural weaknesses into acute failures.
The gap between official optimism and lived experience is not a conspiracy. It is a measurement problem. Headline GDP was designed to capture aggregate economic output, not individual wellbeing. Once that distinction is understood, interpreting the data becomes more straightforward.
Four indicators provide a more complete picture than headline GDP alone. Each is publicly accessible and released on a regular schedule:
Trimmed mean inflation strips out the most volatile price movements, including food and fuel extremes, to reveal the persistent underlying inflation trend. It is the measure the RBA uses to set monetary policy.
The gap between trimmed mean versus headline CPI is wider in the current cycle than in any recent period, because the fuel shock has driven a single volatile component to distort the aggregate figure in a way the underlying measure deliberately excludes; that divergence is exactly what makes the RBA’s policy decision harder to read from public headlines alone.
With trimmed mean at 3.9%, above the RBA’s 2-3% target band, rate cuts remain constrained regardless of what the headline CPI does. Bank forecasts reflect this uncertainty: Westpac projects cuts to 3.85% by Q3 2026; ANZ sees a risk of a further hike to 4.35% if inflation persists; NAB holds the rate steady at 4.10% through 2026. The divergence among credible institutions underscores that the path forward is genuinely unclear.
Per capita output has been declining. Business failures are at a generational high. Real wages have gone backwards. Consumer confidence has collapsed to its weakest level in more than half a century. These are not leading indicators of a downturn. They are the downturn as experienced by participants in the real economy.
Whether it qualifies as a “recession” depends entirely on the definition applied. The RBA forecasts 1.9% GDP growth for 2026. NAB projects approximately 2.0%. KPMG expects mild 1.7% growth with some stabilisation in per capita terms. Oxford Economics has cited a 40% probability of a technical recession (two consecutive quarters of negative headline GDP) by Q4 2026, though that specific figure should be treated with caution pending independent verification. The label is contested; the conditions are not.
Three triggers could convert the per capita recession into a technical one. These are not predictions but signals worth monitoring:
Australians who feel that the official numbers do not describe their lives are reading the situation correctly. Headline GDP was never designed to measure lived economic experience. It measures the total size of the economy, not how that economy is distributed across the people who participate in it. On the measures that capture individual wellbeing, per capita output, real wages, consumer confidence, and business survival rates, the data tells a consistent story: the squeeze is already here.
Investors wanting to translate this economic picture into portfolio decisions will find our comprehensive walkthrough of ASX portfolio positioning during inflation covers the specific instruments, including cash ETFs, quality equity exposure, and fixed income allocations, that have historically preserved purchasing power through tightening cycles, with worked examples relevant to the current 4.10% cash rate environment.
This article is for informational purposes only and should not be considered financial advice. Investors should conduct their own research and consult with financial professionals before making investment decisions. Economic forecasts and projections cited are subject to revision as new data becomes available.
—
A per capita recession occurs when total GDP grows but the average person's share of economic output shrinks, typically because population growth is driving aggregate expansion rather than productivity gains. Australia's per capita GDP fell approximately 0.7% across 2025 even as headline GDP grew 2.6% annualised in the December quarter, meeting the conditions of a per capita recession.
Approximately 12,000 or more corporate insolvencies were recorded across Australia in full-year 2025, the highest level since the 1990-91 recession, with construction accounting for 3,595 collapses alone, representing 21% of all national business failures.
The Wage Price Index grew approximately 3.4% year-on-year while headline CPI inflation ran at 3.7% and the RBA's preferred trimmed mean measure reached 3.9%, meaning real purchasing power declined by roughly 0.3% and each dollar earned bought less than it did a year earlier.
The Iran-linked disruption to Hormuz shipping in early 2026 pushed crude oil to around $110 per barrel and diesel to nearly three times its start-of-year level, hitting household budgets, business operating costs, food prices, and adding more than one percentage point to headline inflation according to Westpac economists, which constrained the RBA's ability to cut rates.
Investors should monitor per capita GDP from the ABS, the monthly Judo Bank/S&P Global PMI (which hit a fragile 50.1 in April 2026), the Westpac-Melbourne Institute Consumer Sentiment Index (80.1 in April, its lowest since the pandemic), and ASIC's monthly insolvency data as a real-time leading indicator of economic stress.