Hightouch Raises $150M in AI Marketing Funding at $2.75B Valuation
2 mins ago

Starbucks shares surged 5.84% on 29 April 2026 after the company posted its strongest North America transaction growth in three years, beating Wall Street estimates on revenue, earnings per share, and comparable store sales. The result arrives roughly one year into CEO Brian Niccol’s “Back to Starbucks” turnaround, a period in which investors have waited for hard evidence that operational changes are converting to real foot traffic. Q2 fiscal 2026 delivers that evidence across every major metric. What follows breaks down the numbers behind the beat, the specific store-level changes driving it, what the raised full-year guidance actually signals, how two named analyst firms are revising their models, and why the China joint venture restructuring reshapes how future quarters will read.
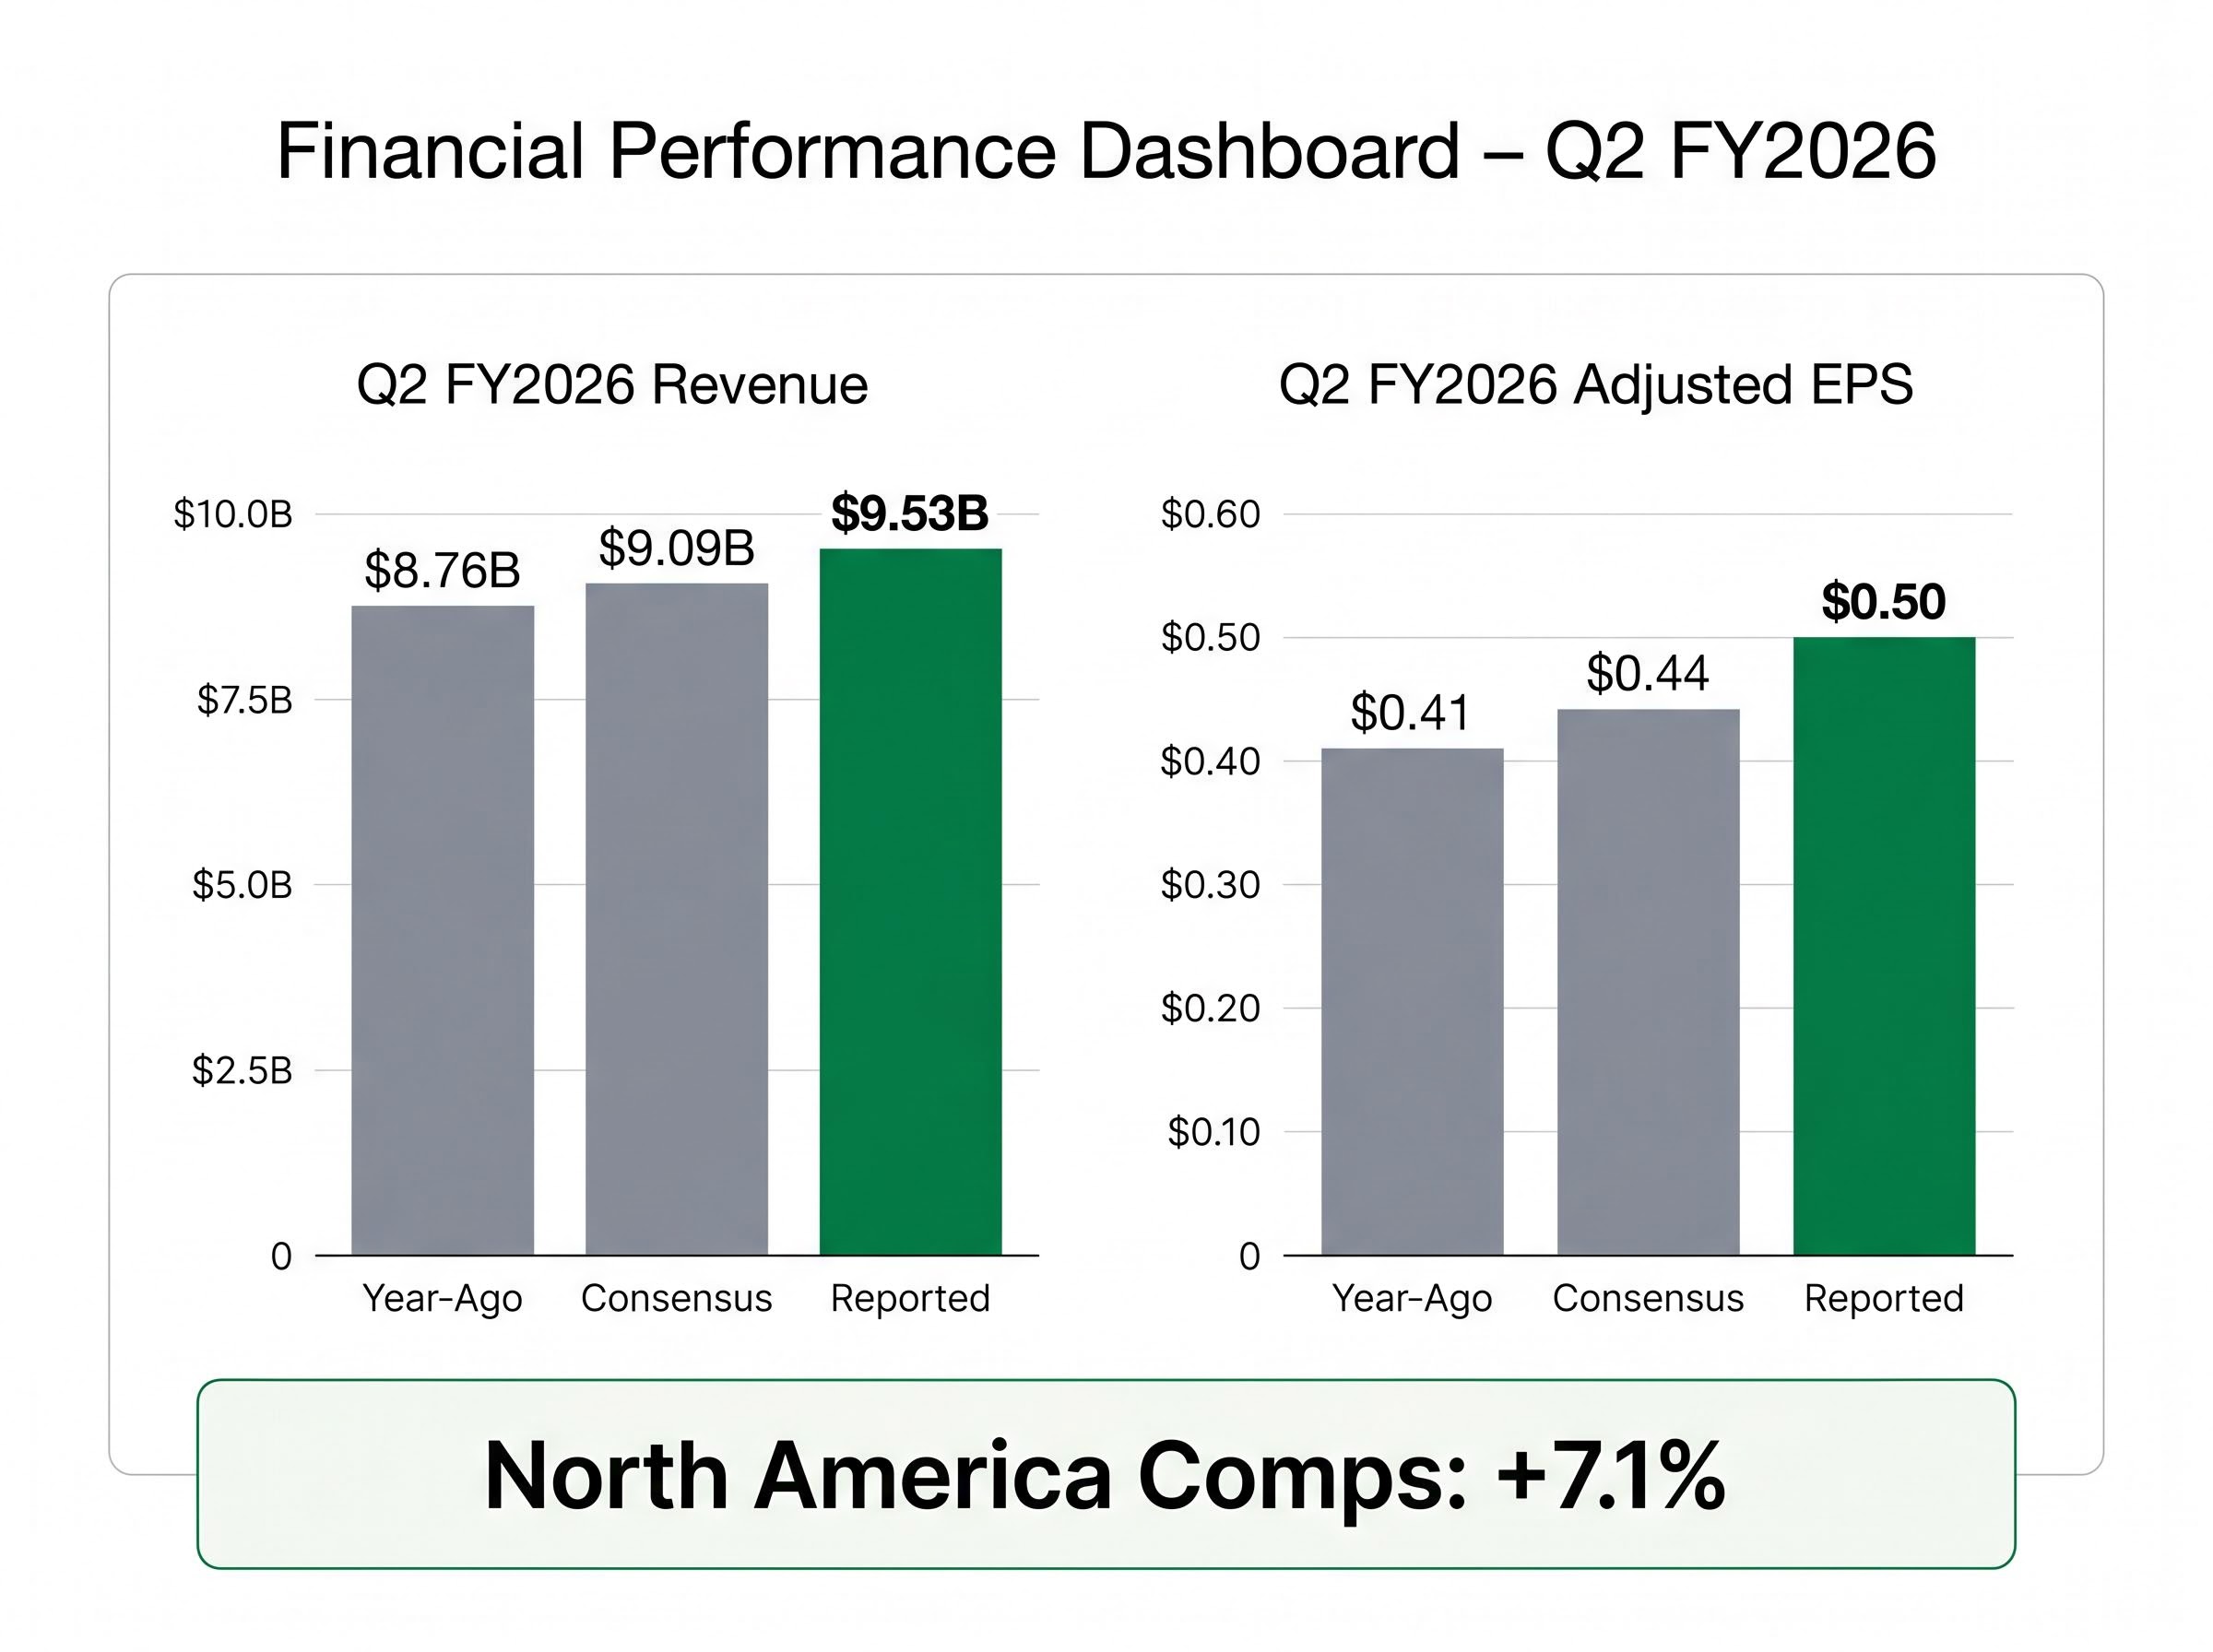
Starbucks reported Q2 fiscal 2026 revenue of $9.53 billion, up 8.8% year-over-year and well above the analyst consensus of approximately $9.09 billion. Adjusted earnings per share came in at $0.50, clearing the $0.44 consensus by $0.06 and marking a 22% increase from the prior-year figure of $0.41.
Global comparable store sales rose 6.2%. North America comps accelerated to 7.1%, with transaction growth exceeding 4 percentage points of that figure.
| Metric | Reported | Consensus | Year-Ago |
|---|---|---|---|
| Revenue | $9.53B | $9.09B | $8.76B |
| Adjusted EPS | $0.50 | $0.44 | $0.41 |
| Global Comps | +6.2% | N/A | N/A |
| North America Comps | +7.1% | N/A | N/A |
The breadth matters. A clean sweep across revenue, earnings, and traffic removes the possibility that any single metric was a one-off. According to Evercore, North America same-store sales have improved by 13 percentage points across the prior six quarters.
North America comparable store sales have swung 13 percentage points over the past six quarters, per Evercore, representing one of the sharpest turnaround trajectories in the company’s recent history.
The numbers trace back to specific decisions inside stores. Niccol described Q2 as “the turn in our turnaround,” framing the quarter not as a one-time recovery but as confirmation that structural changes are producing sustained traffic gains.
The initiatives cited by management include:
Beyond the service floor, Starbucks launched a reimagined loyalty programme in March 2026. Wolfe Research noted encouraging early data from the programme’s first weeks. In April 2026, the company introduced its Energy Refresher product line, which Wolfe Research flagged as tracking positively in early sales data.
The distinction between these initiatives and short-term promotions is the investment thesis question that matters most. Discounting pulls demand forward and fades; staffing, service standards, and loyalty redesigns compound over time. Niccol’s framing positions the recovery in the second category.
The transaction recovery does not exist in a vacuum: Starbucks’ U.S. market share has declined to approximately 48% from 52% in 2023, and U.S. market share pressure from Dutch Bros and McDonald’s McCafe continues to frame the competitive baseline against which each quarter’s traffic gains are measured.
Comparable store sales, often called “comps,” measure revenue change at locations open for at least one year. The metric strips out the effect of new store openings and closures, isolating whether existing stores are attracting more customers or generating higher spending per visit.
The composition of a comp figure carries as much information as its headline number. Growth can come from higher average ticket prices (customers paying more per order) or from increased transaction counts (more customers walking through the door). Transaction-led growth is generally considered higher quality because it reflects genuine demand rather than price increases that may eventually deter visits.
The Black Box Intelligence comparable sales definition frames transaction count as the more operationally meaningful component of a comp figure, because ticket-driven gains are more easily reversed by consumer resistance to higher prices than visit-frequency gains driven by improved experience.
North America transaction growth exceeded 4 percentage points of the 7.1% comparable store sales figure in Q2, indicating the majority of the comp improvement came from more customers, not higher prices.
The trajectory matters as much as the single quarter. A 13-percentage-point improvement over six quarters, as tracked by Evercore, moves the result from a quarterly data point to a multi-quarter trend. Global comps of 6.2% confirm that the U.S. recovery is outpacing the international portfolio, reinforcing the domestic turnaround as the primary driver of the current re-rating.
Management raised the full-year fiscal 2026 outlook on both comps and earnings. Comparable sales guidance moved to above 5% from above 3%. Adjusted EPS guidance was revised to $2.25-$2.45, up from a prior range of $2.15-$2.40.
| Metric | Prior Guidance | Updated Guidance |
|---|---|---|
| Comparable Sales Growth | Above 3% | Above 5% |
| Adjusted EPS | $2.15-$2.40 | $2.25-$2.45 |
The FY26 EPS consensus sits at approximately $2.28-$2.29, meaning the updated guidance range brackets the street estimate but does not dramatically exceed it.
The margin story is less straightforward. Consolidated operating margin came in at 9.4%, while North America operating margin contracted approximately 170 basis points despite the strong sales result. Net margin stood at 3.63%, and return on equity remained negative at -28.66%.
Three categories of headwind account for approximately 190 basis points of margin pressure:
Management expects these pressures to moderate in the second half of fiscal 2026. Headquarters relocation costs and labour-related expenses have also weighed on profitability. The tension between accelerating comps and compressing margins is the most important dynamic for readers to track into Q3.
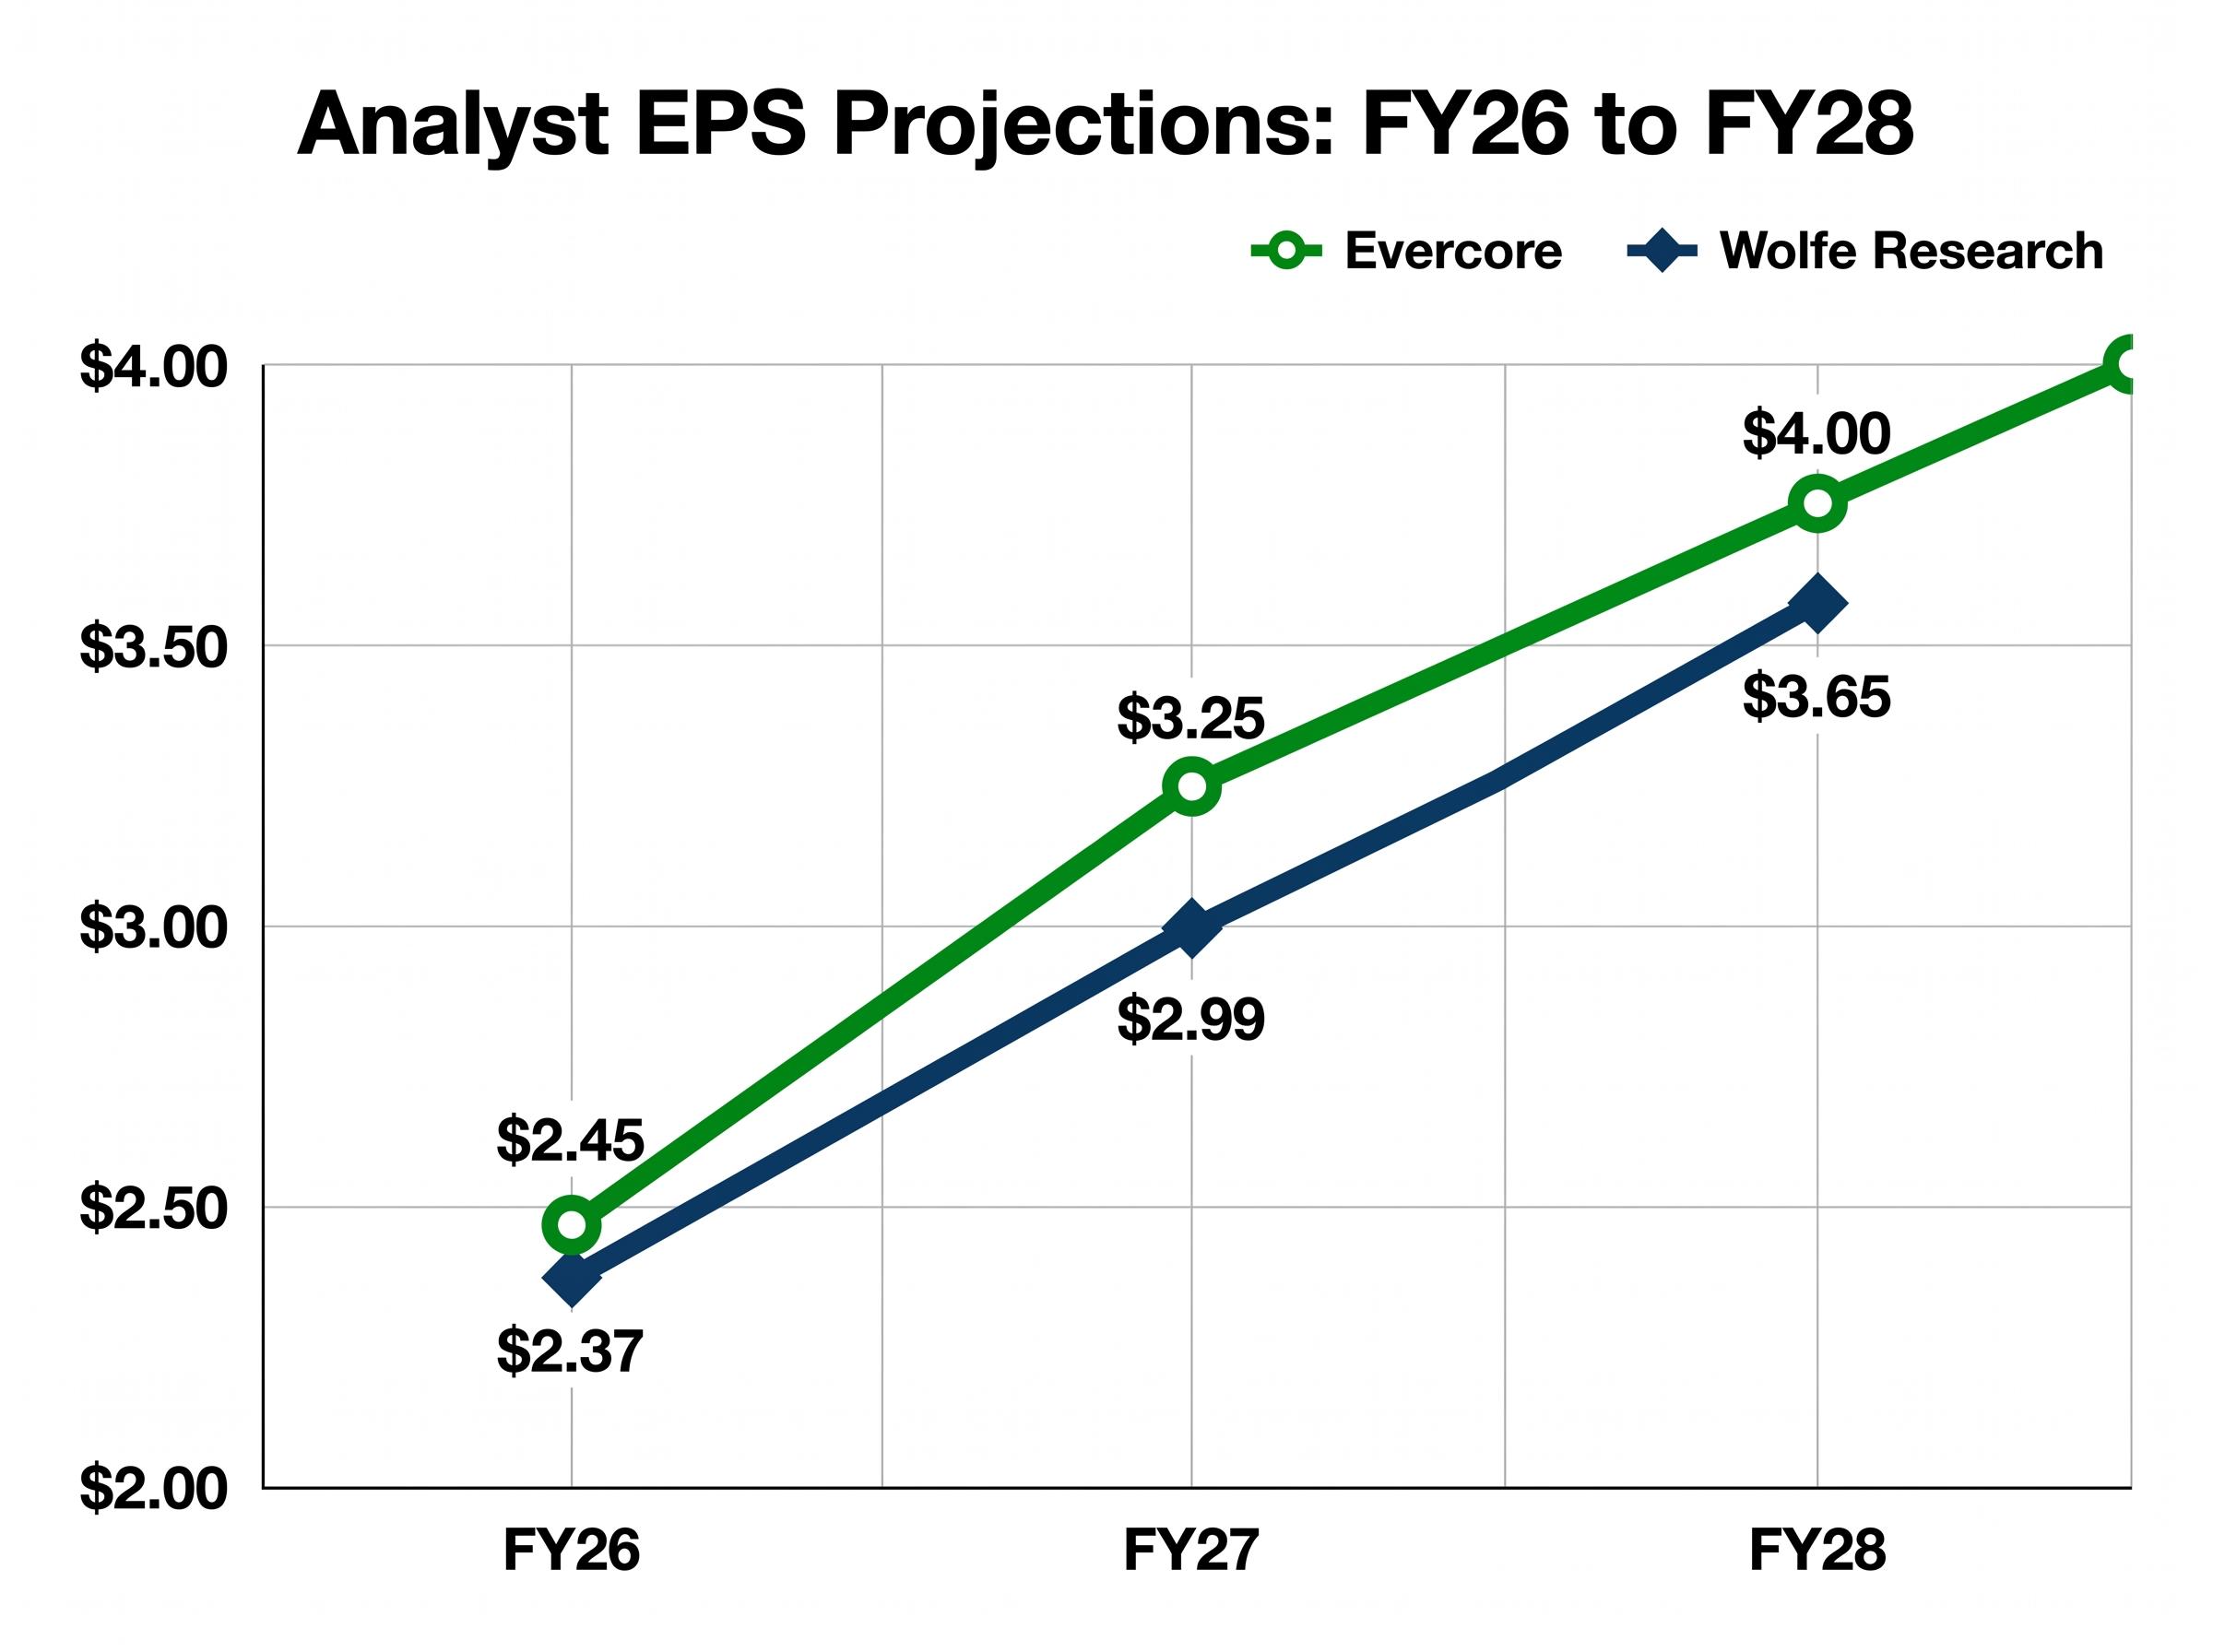
Evercore raised its price target on Starbucks to $115 from $110, maintaining an Outperform rating. The firm revised its FY26 EPS estimate to $2.45 from $2.30, its FY27 estimate to $3.25 from $3.09, and its FY28 estimate to $4.00 from $3.92.
The analytical anchor behind the multi-year thesis: Evercore projects North America incremental margins exceeding 50% in fiscal 2027, a sharp reversal from an estimated negative 7% in fiscal 2026. Productivity-driven cost savings are projected to reach $2 billion by fiscal 2028.
Evercore projects North America incremental margins exceeding 50% in FY2027, compared with an estimated negative 7% in FY2026, framing the current margin compression as temporary friction rather than a structural problem.
Wolfe Research moved in the same direction, revising its FY26 EPS estimate to $2.37, FY27 to $2.99, and FY28 to $3.65.
| Analyst Firm | FY26 EPS | FY27 EPS | FY28 EPS |
|---|---|---|---|
| Evercore | $2.45 | $3.25 | $4.00 |
| Wolfe Research | $2.37 | $2.99 | $3.65 |
SBUX traded at approximately $102.68 in after-hours activity on 28 April, up roughly 5.55% from the $97.28 close. Two independent firms revising in the same direction gives readers a benchmark for assessing whether the stock’s reaction is proportionate to the fundamental improvement.
Investors wanting to stress-test the multi-year earnings trajectory will find our deep-dive into what Evercore’s $115 target actually requires, which works through the 340 basis point operating margin expansion needed to bridge from today’s 9.4% to the normalised assumption, and maps where the Evercore and Wolfe Research models diverge across FY2026-2028.
Alongside the domestic turnaround, Starbucks completed a restructuring of its China operations. Boyu Capital acquired a 60% stake in Starbucks China’s retail operations in a deal valued at approximately $4 billion. Starbucks retained a 40% stake.
The China joint venture transaction was valued at approximately $4 billion, making it one of the largest single-market restructurings in Starbucks’ history.
The deal closed in early April 2026. Financial impacts will begin appearing in Q3 FY2026 results, meaning Q2’s numbers do not yet reflect the change. Going forward, China operations will no longer be fully consolidated in Starbucks’ reported revenue, reducing headline revenue but improving earnings quality.
AP News coverage of the Boyu Capital deal confirmed the $4 billion valuation and outlined the joint venture terms, establishing the transaction as one of the largest single-market divestitures in Starbucks’ operating history.
The retained 40% stake represents a deliberate balance: reducing operational risk and margin drag from a high-cost, competitive market while preserving participation in long-term upside. For readers interpreting future quarters, the restructuring means reported revenue will step down even as the underlying earnings profile improves.
Q2 fiscal 2026 delivered a clean beat across revenue, EPS, and comparable store sales, underpinned by the strongest North America transaction growth in three years. The 5.84% share price gain reflects the market’s verdict. Raised guidance of $2.25-$2.45 in adjusted EPS sets a new earnings floor for the fiscal year, and two analyst firms have revised their multi-year models higher in response.
The margin picture remains the open question. Near-term compression from tariffs, coffee costs, and innovation mix has not resolved, though management expects moderation in the second half.
Q3 FY2026 will carry additional significance as the first quarter to reflect the China joint venture’s financial impact. That makes it the next material test of whether the turnaround narrative can hold as the reporting structure changes beneath it.
This article is for informational purposes only and should not be considered financial advice. Investors should conduct their own research and consult with financial professionals before making investment decisions. Past performance does not guarantee future results. Financial projections are subject to market conditions and various risk factors.
Starbucks reported Q2 fiscal 2026 revenue of $9.53 billion, up 8.8% year-over-year, with adjusted EPS of $0.50 beating the $0.44 consensus, and global comparable store sales rising 6.2%.
Comparable store sales measure revenue change at locations open for at least one year, stripping out new openings to show whether existing stores are attracting more customers; Starbucks posted North America comps of 7.1% in Q2 2026, with more than 4 percentage points driven by transaction growth rather than price increases.
The Back to Starbucks strategy, led by CEO Brian Niccol, focuses on operational improvements including Green Apron service standards, the GROW Scorecard performance framework, store renovations, menu innovation, faster throughput, and a redesigned loyalty programme launched in March 2026.
Evercore raised its Starbucks price target to $115 from $110, maintaining an Outperform rating, and revised its FY26 EPS estimate to $2.45, projecting North America incremental margins exceeding 50% in fiscal 2027.
Boyu Capital acquired a 60% stake in Starbucks China's retail operations for approximately $4 billion, with the deal closing in April 2026; from Q3 FY2026 onwards, China will no longer be fully consolidated in reported revenue, reducing headline revenue while improving overall earnings quality.