Warsh Strips Fed Statement to 130 Words, Drops All Guidance
32 mins ago

Starbucks beat Q2 FY2026 earnings per share consensus by more than 13%, but the stock’s real story over the coming weeks will not be written by the quarter itself. It will be written by whether two of Wall Street’s more bullish firms are right about what happens to margins between now and 2028. On 28 April 2026, SBUX closed at $97.28 after rising 5.84% on the earnings release. EPS of $0.50 beat the $0.43-$0.44 consensus range, and management raised full-year guidance to $2.25-$2.45. Evercore and Wolfe Research both raised multi-year estimates and price targets in response. The consensus analyst community, however, remains on Hold at an average target of $103.07, suggesting meaningful disagreement about how quickly the margin recovery can compound. This Starbucks stock analysis unpacks exactly what each firm revised, why their 2027-2028 estimates diverge, and what the margin mechanics mean for investors deciding whether SBUX belongs in a portfolio at current levels.
The headline numbers were strong. EPS of $0.50 represented 22% year-over-year growth, beating consensus of $0.43-$0.44 by approximately 13.6%-16.3%. Revenue reached $9.5 billion, up 8% year-over-year. CFO Cathy Smith noted the quarter marked EPS growth after more than two years without it.
The Starbucks Q2 FY2026 earnings release confirmed EPS of $0.50, revenue of $9.5 billion, and raised full-year guidance to $2.25-$2.45, providing the primary data set underpinning both the Evercore and Wolfe Research estimate revisions discussed in this analysis.
The more durable signal, though, sits in the transaction data. North America comparable sales exceeded 7%, with more than 4 percentage points of that figure driven by transaction volume rather than pricing. International comparable sales rose 2.6%, led by over 2% in transaction growth. Year-to-date delivery growth exceeded 30%.
CEO Brian Niccol characterised Q2 as an “inflection point” in the company’s turnaround.
Evercore tracked a 13 percentage-point improvement in North America same-store sales trajectory across the prior six quarters. For investors, understanding whether a beat is price-driven or traffic-driven is the difference between a temporary margin boost and a structural recovery. Transaction growth of this magnitude, after multiple quarters of decline, is the data point that justifies why both Evercore and Wolfe Research revised not just 2026 but 2027 and 2028 estimates.
Evercore maintained its Outperform rating and raised its price target to $115 from $110. The estimate revisions tell the story of why.
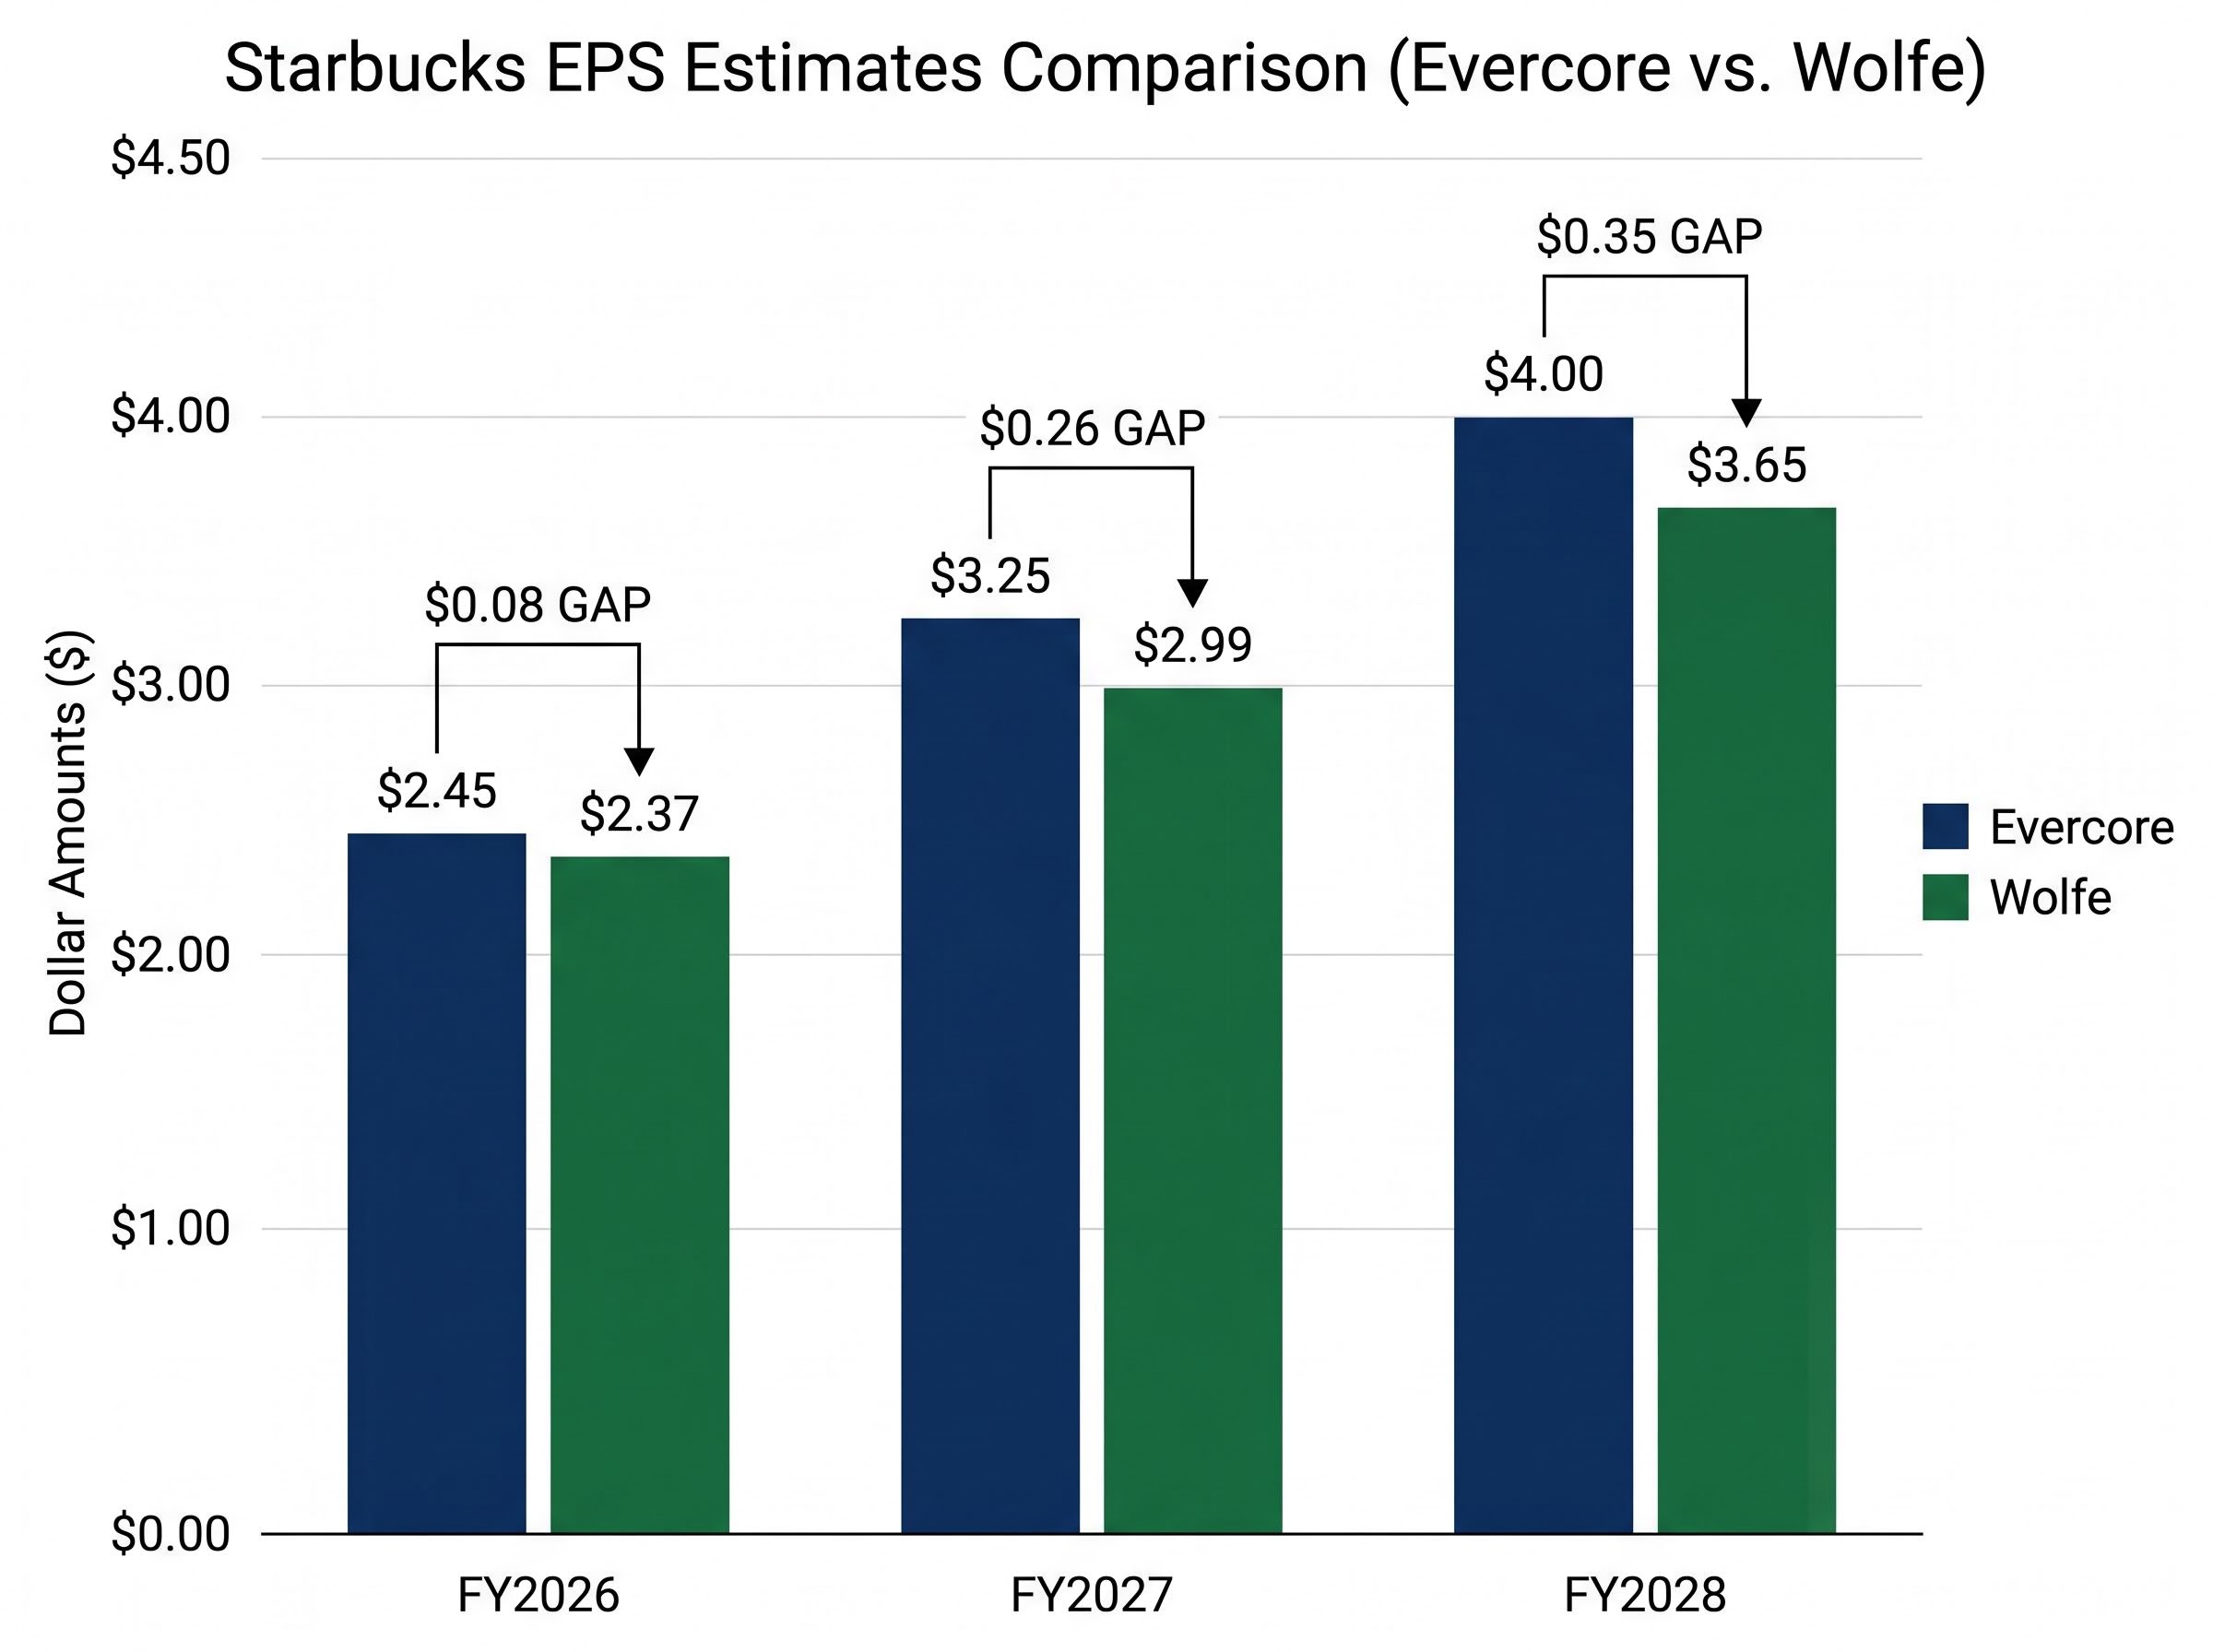
For FY2026, the firm raised its EPS estimate to $2.45 from $2.30. For FY2027, it moved to $3.25 from $3.09. For FY2028, it projected $4.00, up from $3.92. The increments accelerate across each year, and that acceleration is not accidental. It reflects a specific margin thesis: the reinvestment costs weighing on current earnings are expected to cycle out, releasing operating leverage that compounds through the estimate horizon.
| Fiscal Year | Prior Estimate | Revised Estimate | Change |
|---|---|---|---|
| FY2026 | $2.30 | $2.45 | +$0.15 |
| FY2027 | $3.09 | $3.25 | +$0.16 |
| FY2028 | $3.92 | $4.00 | +$0.08 |
Incremental margin measures the percentage of each additional revenue dollar that flows to operating income. It captures how efficiently a company converts revenue growth into profit growth once fixed costs are covered.
Evercore projects North America incremental margins exceeding 50% in FY2027, compared to an estimated negative 7% in FY2026. That swing, from destroying incremental profit to capturing more than half of every new revenue dollar, requires the labour reinvestment cycle to have peaked. The negative figure in FY2026 reflects the ongoing cost of store-level investments under CEO Niccol’s turnaround programme. The 50%-plus figure in FY2027 reflects the operating leverage that emerges once those fixed cost investments are fully absorbed.
Underpinning the projection is a $2 billion productivity savings target through FY2028, attributed to the broader turnaround programme. If labour reinvestment costs are truly cycling out in FY2027, the earnings trajectory accelerates sharply. If they persist, the model breaks.
Wolfe Research also raised its estimates following Q2, but the resulting numbers tell a more conservative story. The firm projects FY2026 EPS at $2.37, FY2027 at $2.99, and FY2028 at $3.65. That FY2028 figure sits $0.35 below Evercore’s $4.00.
| Fiscal Year | Evercore EPS | Wolfe EPS | Gap |
|---|---|---|---|
| FY2026 | $2.45 | $2.37 | $0.08 |
| FY2027 | $3.25 | $2.99 | $0.26 |
| FY2028 | $4.00 | $3.65 | $0.35 |
Wolfe cited specific catalysts for its upward revisions:
The widening gap from $0.08 in FY2026 to $0.35 in FY2028 reveals the analytical disagreement. Wolfe’s more conservative outyear estimate likely reflects either a more cautious view on how fully the $2 billion productivity savings will materialise, a slower margin normalisation assumption, or both. At a 28-29x forward multiple, that $0.35 EPS gap implies a price target disagreement of roughly $10. Investors need to understand which firm’s margin assumptions they are implicitly endorsing when they buy at current prices.
Q2 FY2026 operating margin was 9.4%. North America segment margin was 10.2%, reflecting a 170 basis-point year-over-year decline. These figures reflect deliberate investment rather than operational deterioration.
The gap between the current 9.4% and the 12.8% normalised operating margin embedded in an independent valuation model (projected through December 2028) is approximately 340 basis points. That is the scale of expansion the bull case requires over two to three years.
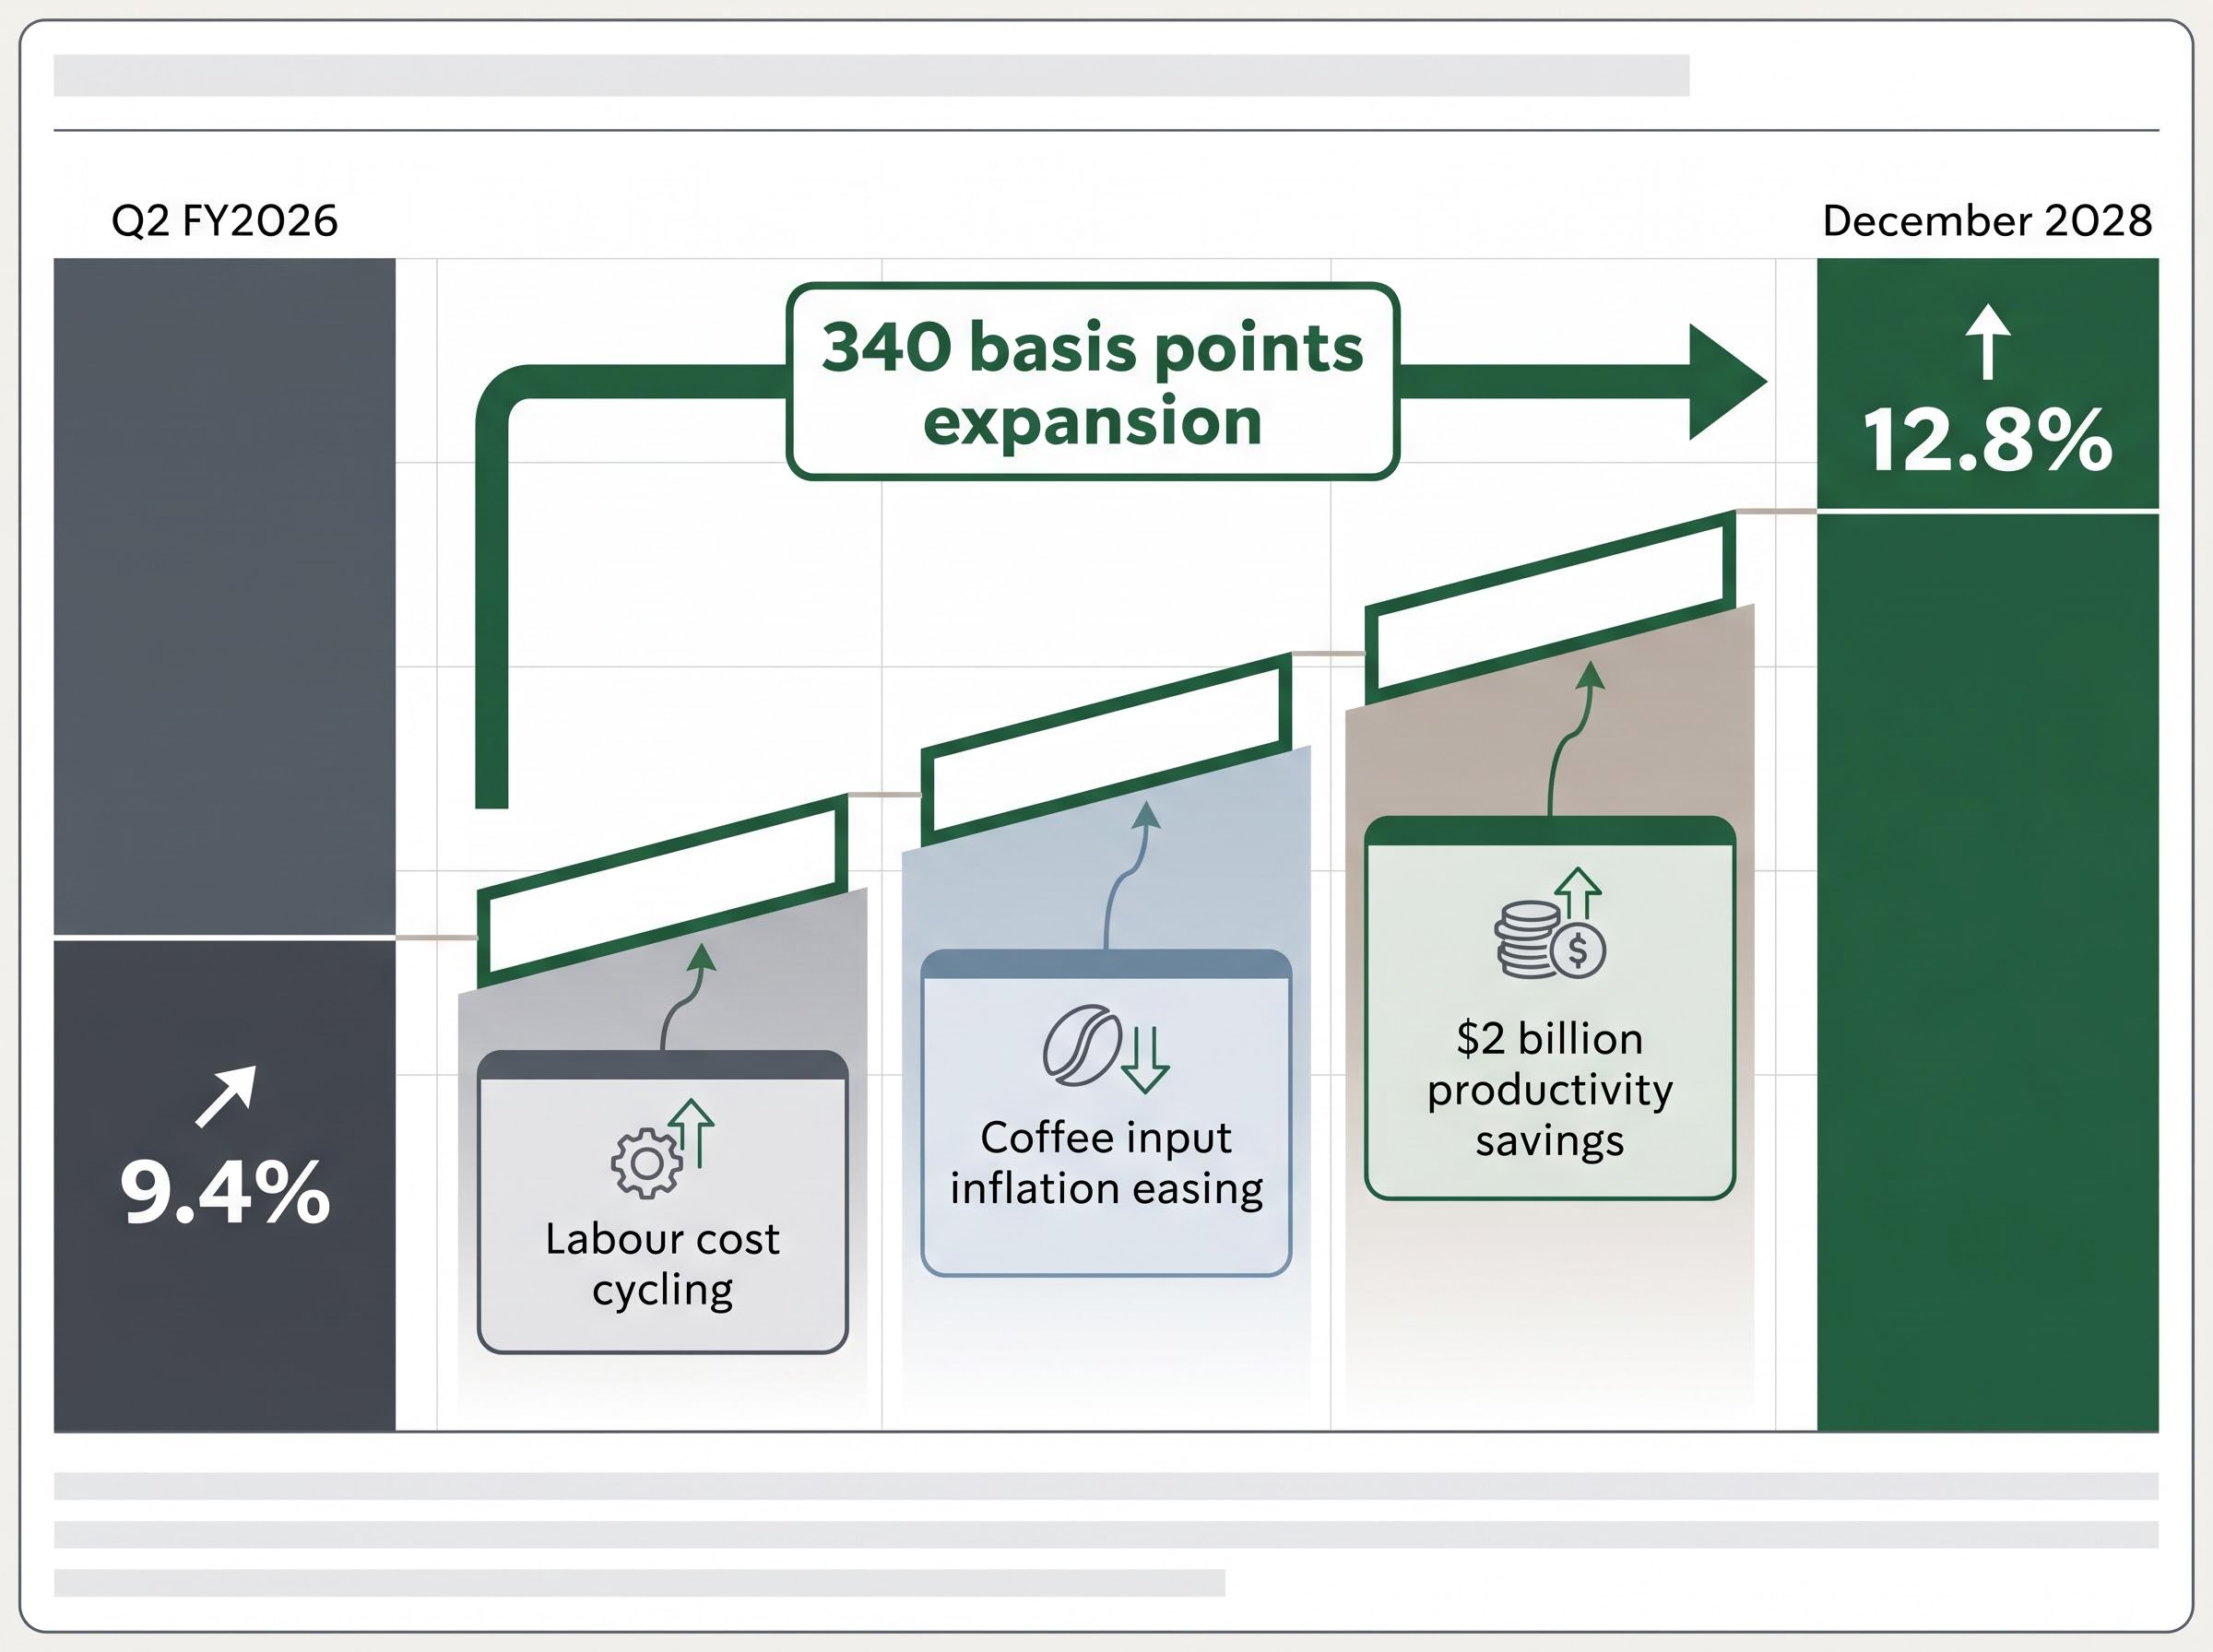
The margin recovery path requires roughly 340 basis points of expansion from the current 9.4% to the 12.8% normalised assumption, a gap that separates the bull and bear cases on SBUX.
RBC Capital Markets offered a dissenting view before earnings, downgrading SBUX to Sector Perform and citing labour cost pressures and margin uncertainty as primary concerns. That caution has not been fully resolved by the Q2 beat.
Consumer discretionary spending pressure from elevated gasoline prices adds a macro overlay to the SBUX recovery thesis: with national average gasoline at $4.25 per gallon as of late April 2026, historical data shows the S&P 500 has fallen an average of 11% in the six months following weeks when prices breach the $4.00 threshold, a pattern that has historically hit traffic-sensitive restaurant and retail concepts before margin normalisation can fully take hold.
Labour cost cycling. The investment in store wages and operations required by CEO Niccol’s turnaround programme is expected to peak in FY2026, with the cost base stabilising as a percentage of revenue in FY2027.
Coffee input inflation easing. Commodity cost pressures cited by multiple analysts are expected to moderate, improving gross margin contribution in coming quarters.
Productivity savings realisation. The $2 billion programme begins generating measurable returns in FY2027-FY2028 rather than FY2026, where the costs are being incurred. This sequencing is why the current margin looks compressed relative to what the models project.
Margin trajectory is the variable that separates the bull and bear cases. The current 9.4% does not reflect what the business earns at steady state; it reflects a deliberate investment period. Investors who understand this distinction can assess analyst price targets with more clarity than those reading only the headline operating margin.
The backward-looking earnings data confirmed the recovery. The forward-looking demand signals will determine whether it sustains.
Starbucks reported a record 35.6 million 90-day active US Rewards members in Q2 FY2026. That figure connects directly to the transaction growth acceleration in North America: loyalty members visit more frequently and spend more per visit, making the programme a structural driver of comparable sales rather than a marketing cost.
Wolfe Research described early signals from the March 2026 loyalty programme overhaul as promising, though deeper engagement metrics beyond the member count have not yet been made public.
Loyalty engagement and new product velocity are the leading indicators investors should track between now and the Q3 FY2026 report. If the 35.6 million member base continues to expand and the Energy Refresher demonstrates durable velocity, Wolfe’s more conservative FY2028 estimate could become the floor rather than the base case.
The consensus picture frames the debate. SBUX closed at $97.28 on 28 April 2026, carrying a YTD total return of 16.27% and trading within a 52-week range of $75.50-$104.82. The consensus rating is Hold, with an average price target of $103.07. Evercore’s $115 target sits meaningfully above that cluster.
| Firm | Rating | Price Target |
|---|---|---|
| Evercore | Outperform | $115 |
| Independent Model | N/A | $108 |
| Consensus Average | Hold | $103.07 |
| JP Morgan | Not specified | $100 |
The Hold consensus reflects Wall Street broadly acknowledging turnaround progress while withholding upgrades pending evidence that margin expansion is sustained rather than one-quarter optimism. RBC’s pre-earnings Sector Perform downgrade represents the more sceptical institutional view, and that position has not been formally revised following the Q2 beat.
The pattern of dual analyst frameworks on an earnings beat producing divergent price targets is not unique to SBUX; T-Mobile’s Q1 2026 results generated a near-identical dynamic, with JPMorgan cutting its target while Oppenheimer upgraded, yet both firms remained directionally bullish on a stock that beat every headline metric.
Three variables will determine whether Evercore’s $115 or the $103 consensus more accurately prices the risk:
At $97.28, SBUX trades below the consensus target, 29% above its 52-week low, and roughly 18% below Evercore’s 12-month target. The spread between where the stock trades and where analysts are clustered is the opportunity cost investors are pricing in for margin recovery uncertainty.
The Q2 results and raised guidance confirm the turnaround is real. Transaction growth is accelerating, loyalty membership is at a record, and management raised its outlook. None of those facts are in dispute.
The tension is that the 9.4% operating margin means investors are paying for a 2027-2028 earnings story at 2026 prices. That requires a view on execution that the consensus is not yet willing to endorse. FY2026 guidance calls for comparable sales growth exceeding 5% and EPS of $2.25-$2.45, both achievable on current trajectory. The harder question is what happens after.
Concrete milestones that would signal the recovery is on track before year-end:
At the independent model’s 28.7x exit P/E and the $3.65-$4.00 FY2028 EPS range across Wolfe and Evercore, the implied price range is approximately $105-$115. The current price of $97.28 offers a margin of safety only if the recovery timeline holds.
The YTD return of 16.27% reflects the Q2 re-rating but does not yet price the full recovery. The risk is not that the turnaround is failing; the data does not support that conclusion. The risk is that the margin recovery is slower than the 2027 model demands, and patience has a cost when the consensus is already asking for proof.
This article is for informational purposes only and should not be considered financial advice. Investors should conduct their own research and consult with financial professionals before making investment decisions. Past performance does not guarantee future results. Financial projections are subject to market conditions and various risk factors.
The consensus analyst rating on SBUX is Hold, with an average price target of $103.07. Evercore is the most bullish outlier with an Outperform rating and a $115 price target, while JP Morgan holds a $100 target.
Starbucks reported Q2 FY2026 EPS of $0.50, beating the consensus range of $0.43-$0.44 by approximately 13.6% to 16.3%, and representing 22% year-over-year earnings growth.
Evercore projects FY2028 EPS of $4.00 while Wolfe Research estimates $3.65, a $0.35 gap that reflects differing assumptions about how quickly the $2 billion productivity savings programme will materialise and how fast Starbucks margins will normalise.
Investors should monitor Q3 FY2026 operating margin improvement from the current 9.4%, whether the 35.6 million loyalty member base sustains above 35 million with higher per-member spend, and any quantified progress on the $2 billion productivity savings target disclosed on the Q3 earnings call.
The current 9.4% operating margin reflects deliberate reinvestment in store wages and operations under CEO Brian Niccol's turnaround programme, not structural deterioration. Analysts expect this cost base to stabilise as a percentage of revenue in FY2027, releasing operating leverage that could push margins toward a normalised 12.8% level.