Roughly $32.67 million in ask-side call premium hit SanDisk in the opening minutes of trade on Wednesday, 7 October 2026. It arrived straight after a three-day slide, when the shares had been drifting sideways and sentiment looked tired.
That timing is what makes SNDK call buying of this size worth examining. It could be genuine conviction from a well-funded buyer, or it could be a loud print that means less than the headline number suggests.
Fiscal Q1 earnings are reported to land on 29 October, and the stock is up about 650% in 2026. Big option flows draw attention at exactly these moments. The flow data, however, comes from one presenter’s reading of the tape on Tasty Life, and public sources had not corroborated it through 8 October. Treat every trade figure here as “as reported.”
You will come away with a method for reading the structure of a trade like this (strikes, expirations, open interest, break-evens and implied volatility) and judging how much weight it deserves in your own thinking.
What the three call trades actually show
Start with the tape as reported. Three call purchases, all filled at the ask, which means buyers paid the seller’s asking price rather than waiting for a better fill. That is impatience, and impatience usually signals intent.
| Trade | Strike | Expiry | Premium | Break-even |
|---|---|---|---|---|
| January call | 1760 | 15 Jan (100 days) | ~$17M | ~1949 |
| December call | 1750 | 18 Dec (72 days) | ~$14.6M | ~1923 |
| Near-dated call | 1720 | 2 days | ~$1.07M | Not reported |
The near-dated trade is a sideshow. It expires before earnings and carries a fraction of the money, so it says little about where the buyer thinks SanDisk is heading.
The two long-dated blocks are the story. On the January line, 92 contracts traded against open interest of 76. Open interest is the number of contracts already outstanding, so volume above it points to fresh positioning rather than an old trade being rolled forward. The December block filled at about 99% of the ask, another sign of a buyer opening new exposure.
Now the hurdle. By the presenter’s calculation, the break-evens near 1923 and 1949 require roughly 16-17% upside. About 97% of the premium (around $31.6 million) sits in contracts that outlast the 29 October report.
The odds priced in Implied volatility of about 61-62% implies roughly a 1-in-4 chance the trade pays off. Implied volatility is the market’s estimate of how far a stock may move, built into option prices.
Implied volatility is extracted from live option prices rather than historical data, so a reading of 61-62% reflects what traders collectively expect SanDisk to do, not what it has done, and it says nothing about direction.
What this tells you is that the buyers need a big repricing within 72-100 days. This is not a hedge against a small wobble, and you should weigh it as a high-variance bet.
Signal versus noise: how to read the structure
The tape shows size, price and side. It does not show the buyer’s wider book, any linked stock trades, or other legs. That gap is where most misreadings start.
Signal:
- Fills at or near the ask
- Volume exceeding existing open interest
- Premium clustered in one or two expirations
- Expiries that extend past a known catalyst
Noise or ambiguity:
- The calls may be one leg of a spread or collar
- A dealer may be hedging structured notes
- A short seller may be buying upside insurance
- Single-day flow can be short-term speculation
No named analysts commented on these trades. Practitioners treat unusual activity as one input, never a standalone tell.
When big ASX news breaks, our subscribers know first
Earnings, analyst targets and valuation: does the setup justify the bet?
If the trade is a bet on repricing, the obvious question is whether Wall Street sees room for one. On the presenter’s figures, it does.
- Average analyst target of about 2206, with 15 buy ratings, 2 holds and no sells
- Mizuho reportedly raised its target from 1875 to 2500 this week
- The January strike sits about $260 below the average target
- P/E of about 22, against roughly 21.5 for the S&P 500
- Shares fell about 7% in the first six October sessions and entered Wednesday 29% below the 52-week high
The P/E (price-to-earnings ratio, or share price divided by annual earnings per share) is the eye-catcher. A stock up 650% this year trading near the market multiple suggests earnings have grown fast enough to keep pace with the price. That gives dip buyers a defensible entry.
Then comes the asterisk.
As reported, not verified The 29 October date, the 2206 consensus, the rating split and the Mizuho hike come from the presenter. Public research through 8 October found no corroboration of any of them.
The last verified public price is $1,719.99 on 1 October, per Nasdaq. The latest confirmed results, fiscal Q1 2026 released on 6 November 2025, showed EPS of $0.75 and revenue of $2.31B against a $2.12B estimate, according to MarketBeat.
Your read should be this: valuation looks defensible, but you should treat the consensus and Mizuho figures as unconfirmed until you check them against your own data source.
Why timing beyond the earnings date matters
Expiries in December and January let the buyers ride the earnings reaction, any follow-through and a possible rerating. They also cushion the sharp drop in option prices that usually follows a report.
The window still differs from the analysts’. Targets cover about 12 months, while this trade has to work in 72-100 days.
Why NAND demand is surging, and how much is structural
The bullish case rests on memory demand. NAND is the flash memory inside solid-state drives (SSDs). As AI shifts from training models to serving them, high-layer SSDs hold model weights and working data, and that pulls NAND demand into the data centre.
The independent evidence lines up behind the direction.
| Source | Date | Finding | What it implies |
|---|---|---|---|
| IDC-linked report | 2026 | AI server needs 8-10x more DRAM, 3x more NAND | Per-server demand uplift |
| TrendForce | July 2026 | NAND demand led by AI inference and data centres | Consumer devices no longer the driver |
| Deloitte | July 2026 | Capacity shifting to enterprise SSDs and HBM; early-2026 growth largely ASP-led | Pricing doing heavy lifting |
| Altium | March 2026 | Data centres could take up to 70% of high-end memory output | Concentrated customer base |
| Dataintelo | 3 Oct 2026 | SanDisk data centre revenue up 437% to $5,153M in fiscal 2026 | Company is capturing the shift |
The harder question is how much of this lasts.
- Structural: AI architectures, inference workloads and the move of high-end memory demand into data centres
- Cyclical: average selling prices (ASPs), capacity reallocation and the low 20% industry NAND bit-shipment growth Dataintelo cites for calendar 2026
The presenter’s company-specific claims, including data centre share rising from 12% to 38%, a $94 billion backlog, eight large customer agreements and SpaceX reportedly seeking $40 billion for Nvidia GPUs, were not publicly confirmed.
If much of the revenue strength is price rather than volume, you should read the next report through margins and ASP commentary, not just the headline beat.
Roughly two-thirds of SanDisk’s latest sequential revenue growth came from price rather than volume, so current earnings power is directly exposed to any loosening in NAND supply conditions.
Risks, volatility and the 1800 chart level
The cost of being wrong here is the full premium. Ranked by relevance to a 72-100 day window, the risks look like this:
- Beating the vol. Heavy call buying lifts implied volatility, so buyers can lose on a good report if the actual move is smaller than priced.
- Peer correlation. SanDisk weakened after Micron’s report, and memory names trade as a pack.
- Rates. A 10-year Treasury yield near 5.3% pressures growth multiples; Micron and AMD fell 2-3% early Wednesday before rebounding as yields eased.
- ASP dependence. Profitability leans on pricing that competition or a slowdown could compress.
- New supply. Micron, Samsung and Kioxia could add capacity. The presenter also cited a Toshiba HDD expansion that knocked Seagate and Western Digital about 10% each, which was not publicly verified.
Implied versus realised After a large run with heavy call interest into earnings, implied volatility tends to exceed the move that actually happens, unless guidance materially outpaces expectations. This is a general pattern; no named memory-stock precedents were found.
What the chart says about 1800
The presenter’s chart work puts resistance near 1800, a level SanDisk has failed to hold since mid-July. A breakout attempt in September lasted one day, and there has been only one close above about 1880 since 14 July.
Wednesday’s rebound came off an intraday low near 1617.95 to roughly 1726. Peers such as Micron, Marvell, AMD, Nvidia and TSM breaking out could help.
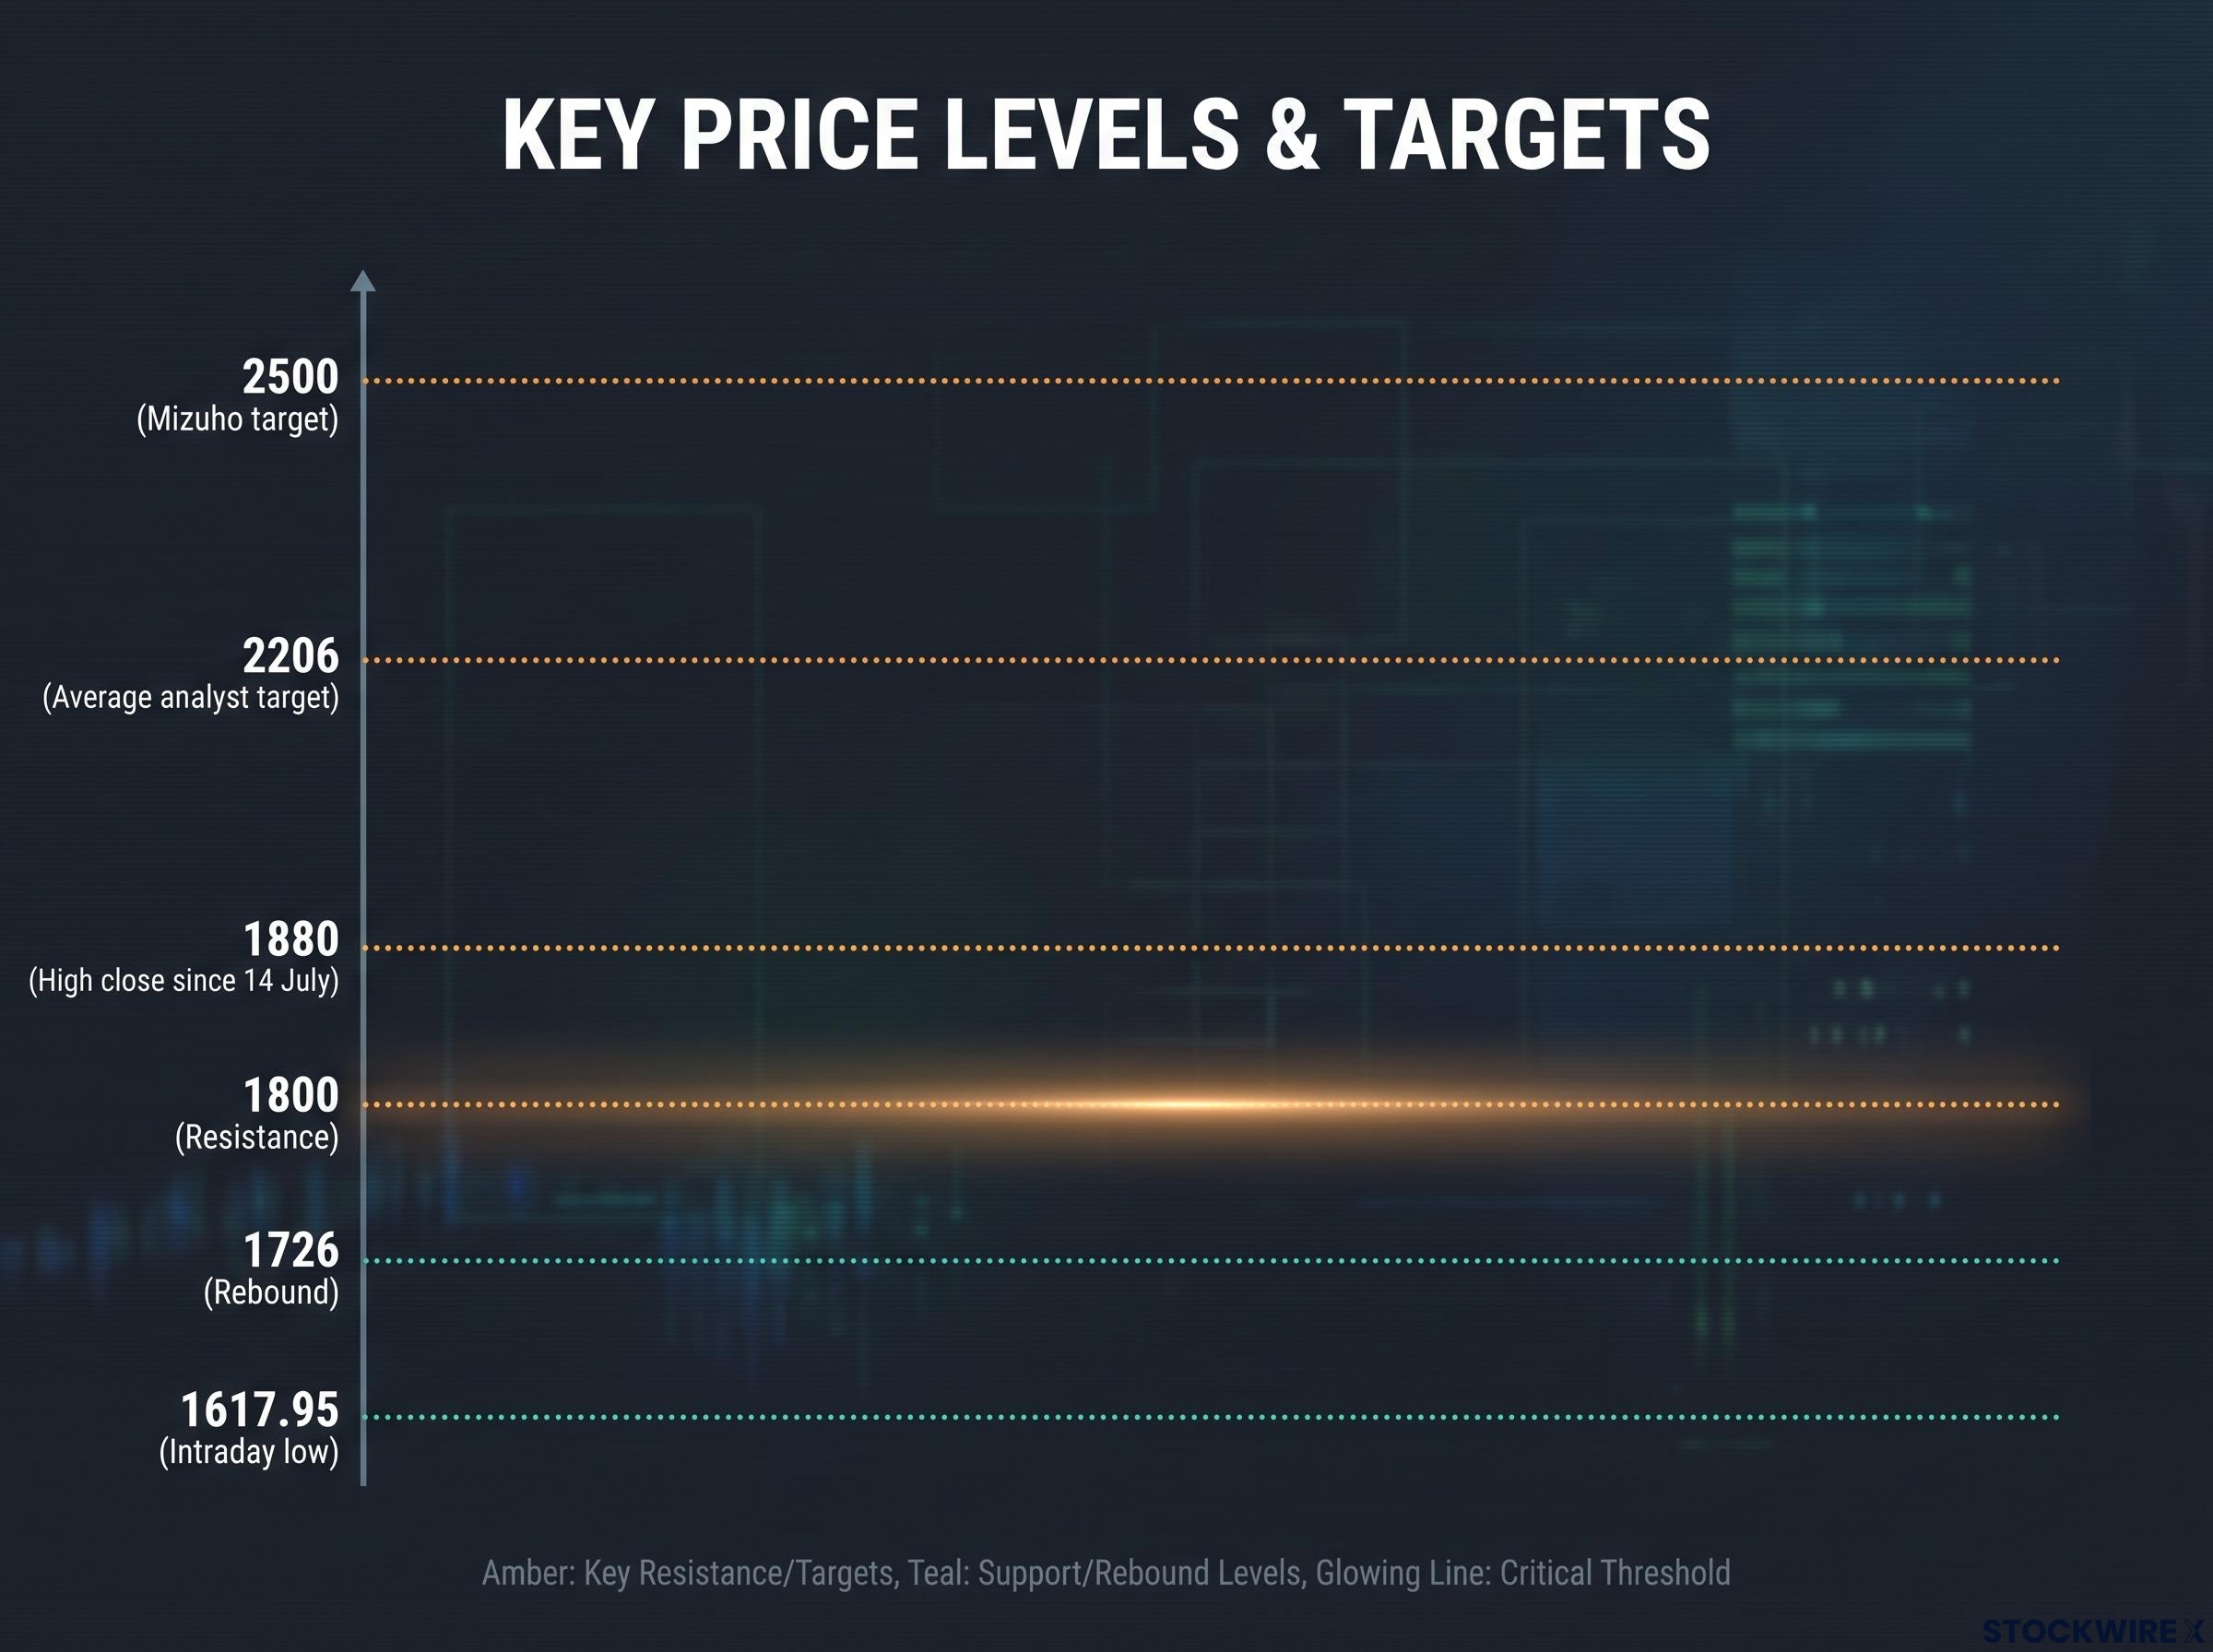
The trade needs both a good print and a clean break above 1800. Failure at either can leave call buyers wrong even if the long-term story holds.
Past performance does not guarantee future results. Forward-looking views are speculative and subject to change.
What the flow does and does not prove about SanDisk
The structure points to a defined-risk bet on a large move, with time built in beyond earnings. It remains one reading of the tape, not proof of insider conviction.
Before 29 October, check three things:
- Whether the earnings date and consensus figures are confirmed by your own data source
- How the implied move compares with SanDisk’s historical post-earnings moves
- How the shares behave around 1800
Unusual options activity belongs in your analysis as one input. It cannot do the analysis for you, and this piece is analysis rather than personalised advice.
This article is for informational purposes only and should not be considered financial advice. Investors should conduct their own research and consult with financial professionals before making investment decisions.