Most traders treat lunchtime as the part of the US session where nothing happens. The data says otherwise. Across more than a decade of S&P 500 intraday behaviour, the hours that changed most since the pre-COVID years are the quiet midday ones, while the familiar busy open and busy close still hold.
The comparison spans three periods: 2012-2019, 2020-2023, and the last two years. All times are in Central Time.
That timing matters more now because same-day options account for roughly 60% or more of S&P 500 index (SPX) options volume. When most contracts expire within hours, the clock becomes part of the trade.
Here is what the hourly numbers show about when the market moves, what is and is not proven about why, and how that should shape the way you think about timing your entries.
What stayed the same: the U-shaped pattern across three eras
Start with the reassuring part. The basic rhythm of the trading day has survived every shock of the past decade.
Volatility, meaning how much prices swing, forms a U-shape across the session. It runs high at the open, sinks to its lowest readings mid-session, and rises again into the close. The morning sits above the close, so the left arm of the U is the taller one.
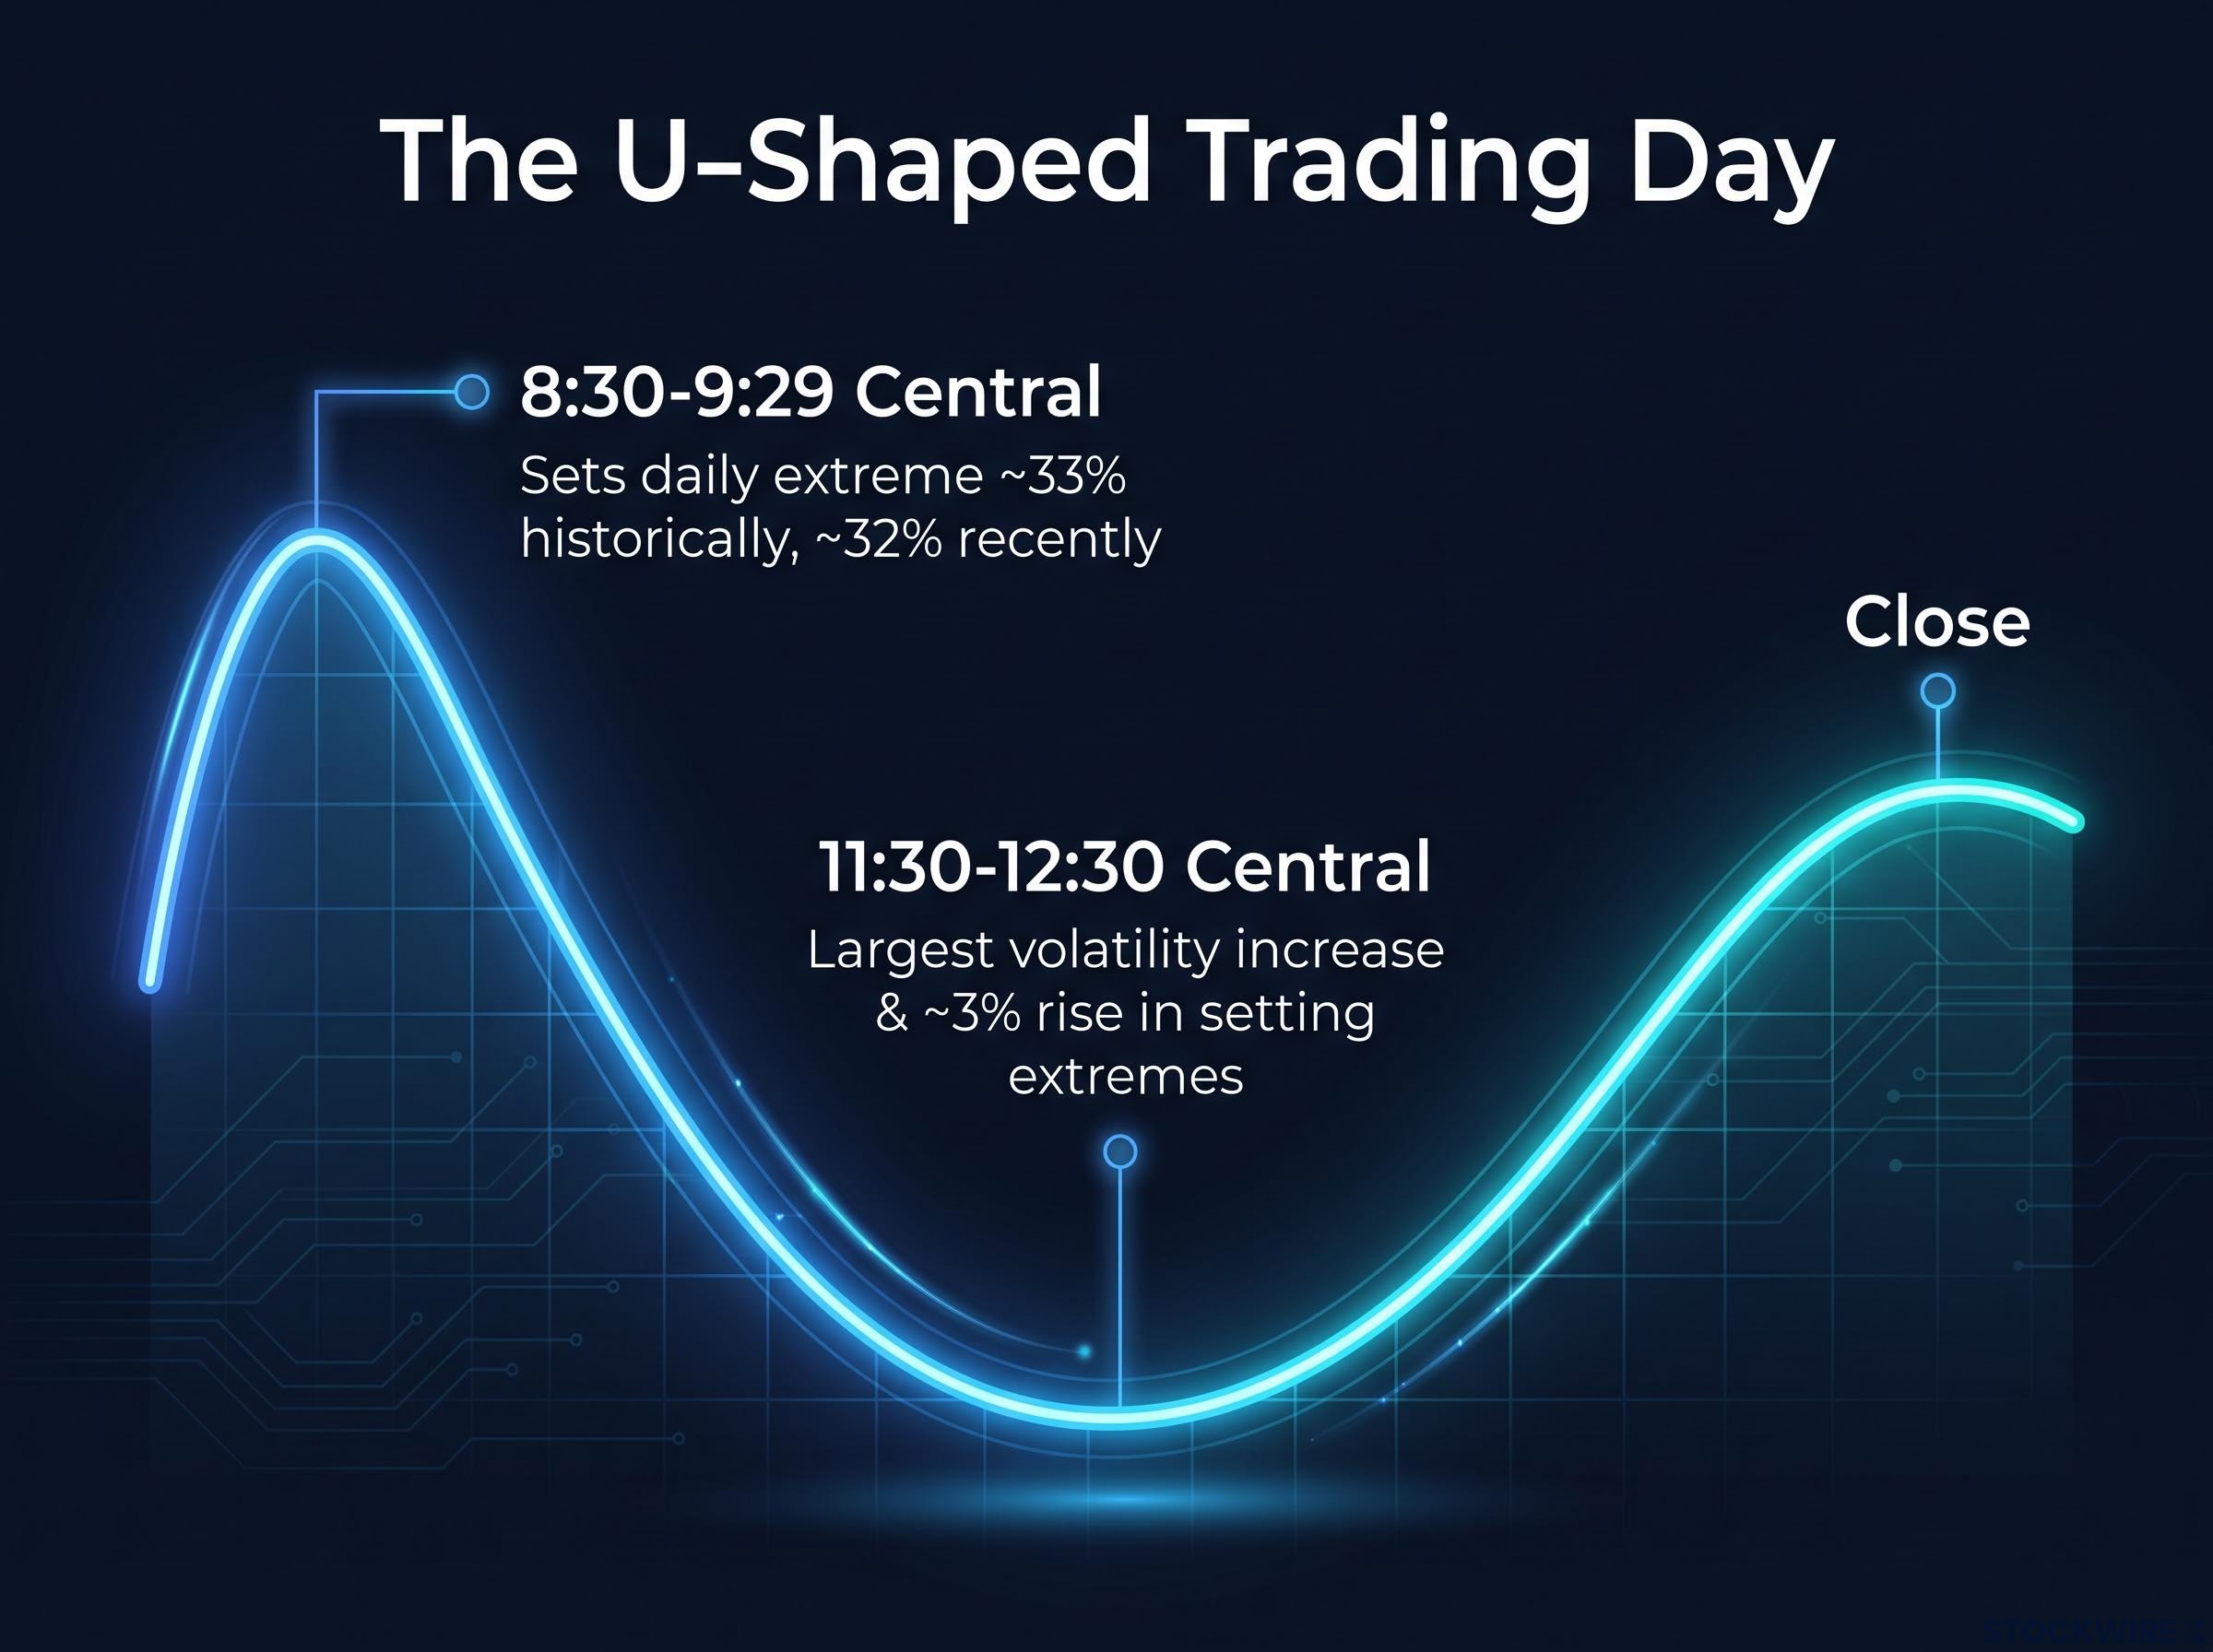
The pattern that held In all three periods studied, intraday volatility was highest at the open and close and lowest in the middle of the day.
The analysis, presented by Julia on the Tasty Live show using research by Sahil, measured three things for each hourly window. These were percentage price change, volatility built from one-minute returns, and the absolute change from the first price in the hour to the last.
How the three eras compare
Each period behaves like its own regime:
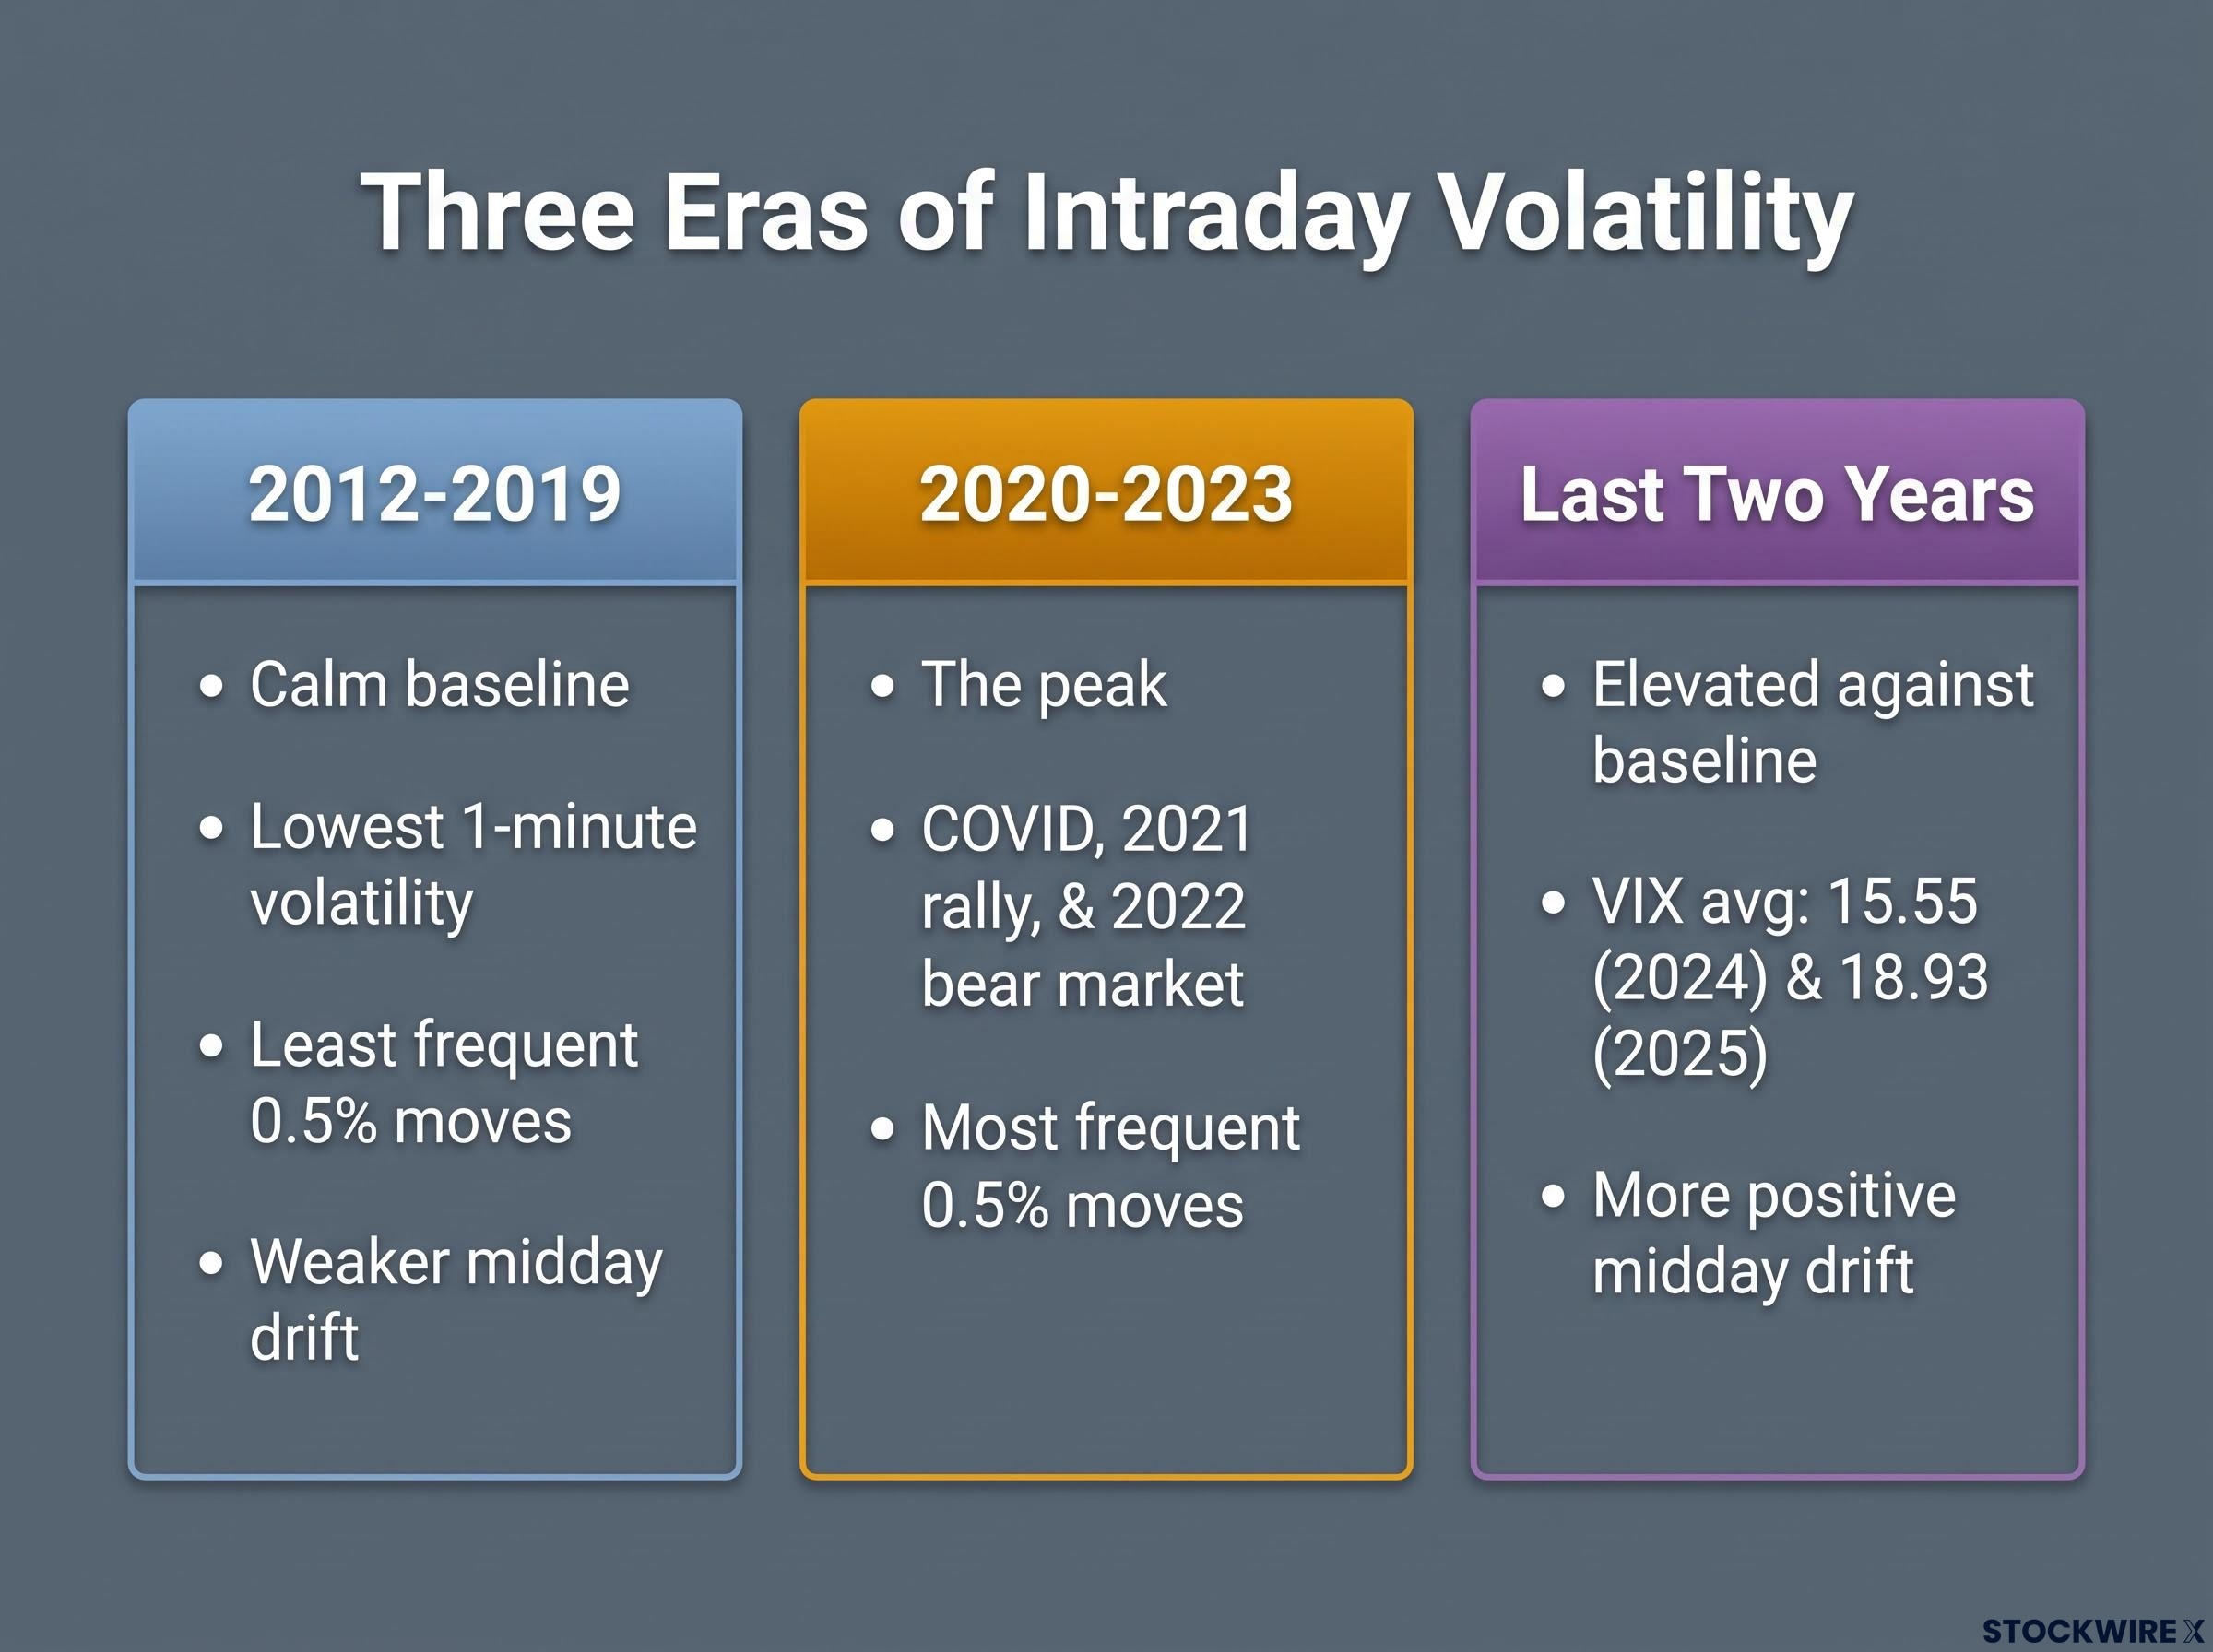
- 2012-2019: The calm baseline, with the lowest volatility of the three.
- 2020-2023: The peak, with COVID, the 2021 rally and the 2022 bear market packed into a short span.
- Last two years: Elevated against the baseline, but well below the peak.
Recent volatility is higher than in 2012-2019 in nearly every hour, yet clearly beneath 2020-2023. The Cboe Volatility Index (VIX), a gauge of expected S&P 500 volatility, averaged 15.55 in 2024 and 18.93 in 2025, consistent with a market that is livelier than the 2010s but far from crisis mode.
The morning remains the most volatile stretch and the place where big moves cluster. The first hour, 8:30-9:29 Central, still sets the day’s high or low most often: about 33% of the time historically and about 32% recently.
That near-identical figure tells you the open-and-close logic still applies to your timing. Whatever changed underneath, it is an adjustment at the margins of the day, not a rewrite of the playbook. The interesting question is what is happening in that low point of the U.
When big ASX news breaks, our subscribers know first
Zero-DTE options and why timing matters: the concepts behind the shift
To read the midday numbers, you need one product in your vocabulary.
A zero-DTE option is an option that expires on the same trading day it is traded. DTE stands for “days to expiration”, so zero means it is gone by the close. Because its life is measured in hours, its value reacts sharply to every intraday move.
SPX options are the standard S&P 500 index options. XSP is the mini version, a smaller contract suited to smaller accounts. In 2022, SPX expirations expanded to five days a week, so you can now trade a contract expiring today on any weekday.
Adoption has been steep:
| Period | Zero-DTE share of SPX volume | Source | Note |
|---|---|---|---|
| 2016 | About 5% | Cboe | Before daily expiries |
| After Tuesday/Thursday expiries | Over 40% | Cboe | Market-impact note, 2024 |
| Full-year 2025 | 59% | Cboe | 2025 industry report |
| May 2026 | 65% | Cboe, via Investing.com | Q2 2026 slide deck |
| July 2026 | 66.2% | Cboe, via Finance Magnates | Reported as a record |
| August 2026 | 62.4% | Article citing Cboe data | Most recent reported figure |
Monthly figures vary by month and by source, so treat “around 60-65%” as the fair summary. Across all US listed options, zero-DTE reached 24.1% of volume in 2025, up from 21.5% in 2024. Cboe’s Q2 2026 figures put SPX average daily volume at 5.1 million contracts, of which 3.1 million were zero-DTE, up 48% year on year.
Why would any of this affect the index itself? The answer runs through the dealers on the other side of your trade. Delta is how much an option’s price moves for each point the index moves. Gamma is how fast delta itself changes, and it is highest in options close to expiry.
Dealers who sell options usually hedge by buying or selling S&P 500 futures to stay neutral. Suppose thousands of same-day contracts sit near one strike price. A small move towards that level can force dealers to trade futures in size, which can push the index further in the same direction.
Because dealers hedge in futures as the index nears a crowded strike, dealer hedging can turn a quiet afternoon into a directional one, and gamma is highest in contracts closest to expiry, which is why the effect grows toward the close.
For you, the point is simple. With most SPX options volume expiring within hours, the time of day shapes risk and reward in a way it did not a decade ago, so treat the clock as a variable in every short-dated trade.
Four mechanisms commonly cited
Commentators offer these explanations, though none is proven as a cause:
- Dealer hedging: Clustered same-day positions can force large futures trades, often in late morning and around the European close.
- Retail day-trading: Cboe estimates retail at about 50-60% of SPX zero-DTE trading in 2026, concentrating speculative flow into short windows.
- Systematic flows: Algorithmic intraday strategies can interact with options-driven flow, allowing stronger moves in once-quiet hours.
- News timing: Economic releases and central bank communication cluster at set times, and hedging around them can lift volatility.
What changed: midday volatility, large moves, daily extremes, and drift
With the concepts in hand, the numbers start to tell a story. Take them one metric at a time.
Midday volatility and 0.5% moves
The biggest rise in volatility against the pre-COVID baseline sits in the middle of the day. The sharpest change lands at 11:30-12:30 Central, the window once known as the lunchtime lull, when desks used to step away.
The midday shift The hour once considered the quietest of the session has seen the largest increase in volatility relative to 2012-2019.
Large moves tell a similar tale. The study defines one as a first-to-last change of at least 0.5% within an hour. These are more frequent than in 2012-2019 in virtually every hour, though still less common than in 2020-2023, and the increase stands out most in the morning.
Daily highs and lows
Midday used to rarely set the day’s extreme. Its share of daily highs and lows has risen by about 3% in recent years, making it more likely to produce the turning point than it once was.
The first hour still dominates, slipping only from about 33% to about 32%. So the change is real, but it is a redistribution at the edges.
Hourly drift
Drift measures direction, not size. It is the average first-to-last return in each hourly window, so it tells you whether an hour tends to finish up or down rather than how much it swings.
This is where the least expected shift appears. Midday drift has turned more positive against pre-COVID benchmarks, with upside tilt strongest in those historically quiet hours, while some morning and late-afternoon windows have weakened slightly.
| Metric | 2012-2019 | 2020-2023 | Last two years |
|---|---|---|---|
| One-minute volatility | Lowest | Peak | In between, above baseline in nearly every hour |
| Hourly moves of 0.5% or more | Least frequent | Most frequent | In between, biggest rise in the morning |
| First-hour share of daily extremes | About 33% | Dominant | About 32% |
| Midday share of daily extremes | Rarely set extremes | Not separately reported | Up about 3% |
| Midday drift | Weaker | Not separately reported | More positive |
These are aggregate hourly statistics over multi-year windows, not single-day case studies. If you assume nothing happens at lunch, you may be mispricing entries, but a three-point share change is a nudge, not a new regime you can bank on.
Is zero-DTE the cause, and what does it mean for your trades?
The neat story writes itself: same-day options exploded, and midday got busier. It is tempting. It is also not settled.
Amplify or dampen?
The amplification camp points to sheer size. Cboe’s market-impact note recorded more than 1.23 million SPX zero-DTE contracts a day in 2023, and many observers read that volume as raising the potential for gamma-driven swings, especially around macro events.
The dampening camp has evidence too. Cboe research notes that realised S&P 500 volatility has not risen in proportion to volume, suggesting much of the flow is hedges, spreads and market-making. A 2025 academic study found zero-DTE options can dampen realised volatility through dealer hedging.
Academic work on 0DTE index options and market volatility estimates how much options market makers’ gamma can move the index, and finds the effect can either calm or amplify swings depending on whether dealers hold positive or negative gamma.
The original analysis did not attribute the midday changes to zero-DTE at all. No Federal Reserve or BIS paper testing the link directly was found, so causation remains an interpretation. The most defensible reading is a structural shift in product mix that plays out cyclically: big on event days, muted in quiet regimes.
Event days show the range. The August 2024 volatility spike and the April 2025 tariff shock, when E-mini futures hit 33.9% annualised realised volatility, behaved nothing like a calm afternoon. Meanwhile, the S&P 500 Dynamic Intraday TCA Index returned 14% in 2024 with 15.38% volatility, evidence of meaningful but not destabilised intraday movement.
What it means for entry timing and trade structure
If you trade short-dated options, a few considerations follow:
- Do not assume the midday lull means low risk; that window now sets more extremes than it once did.
- Revisit how you structure trades. Defined-risk positions cap your loss, while naked short options do not.
- Separate event days from quiet days, because the same hour can behave very differently.
- Remember Cboe’s warning that zero-DTE options carry high leverage and rapid time decay, and premium can vanish within minutes.
The regime caveat Timing edges such as stronger midday drift are regime-specific and may fade or even invert when positioning or macro conditions change.
The honest takeaway is that midday risk has probably risen against the pre-COVID years, but any edge built on a few years of data can disappear, so size and structure your trades accordingly. This section is educational, not trading advice. Past performance does not guarantee future results.
What the data settles, and what it leaves open
Some things are settled. The U-shape endures, the first hour still sets the most extremes, and midday is measurably livelier than before COVID. Volatility overall sits above the 2010s but below the 2020-2023 peak.
What remains open is the why. Zero-DTE flow is a plausible driver, not a proven one.
Before you lean on any intraday pattern, watch three signals: the midday share of daily highs and lows, zero-DTE’s share of SPX volume, and the VIX regime. If those shift, the patterns may shift with them.
Treat every timing idea as regime-dependent, and test it with small size before committing real capital.
This article is for informational purposes only and should not be considered financial advice. Investors should conduct their own research and consult with financial professionals before making investment decisions. These statements are speculative and subject to change based on market developments.