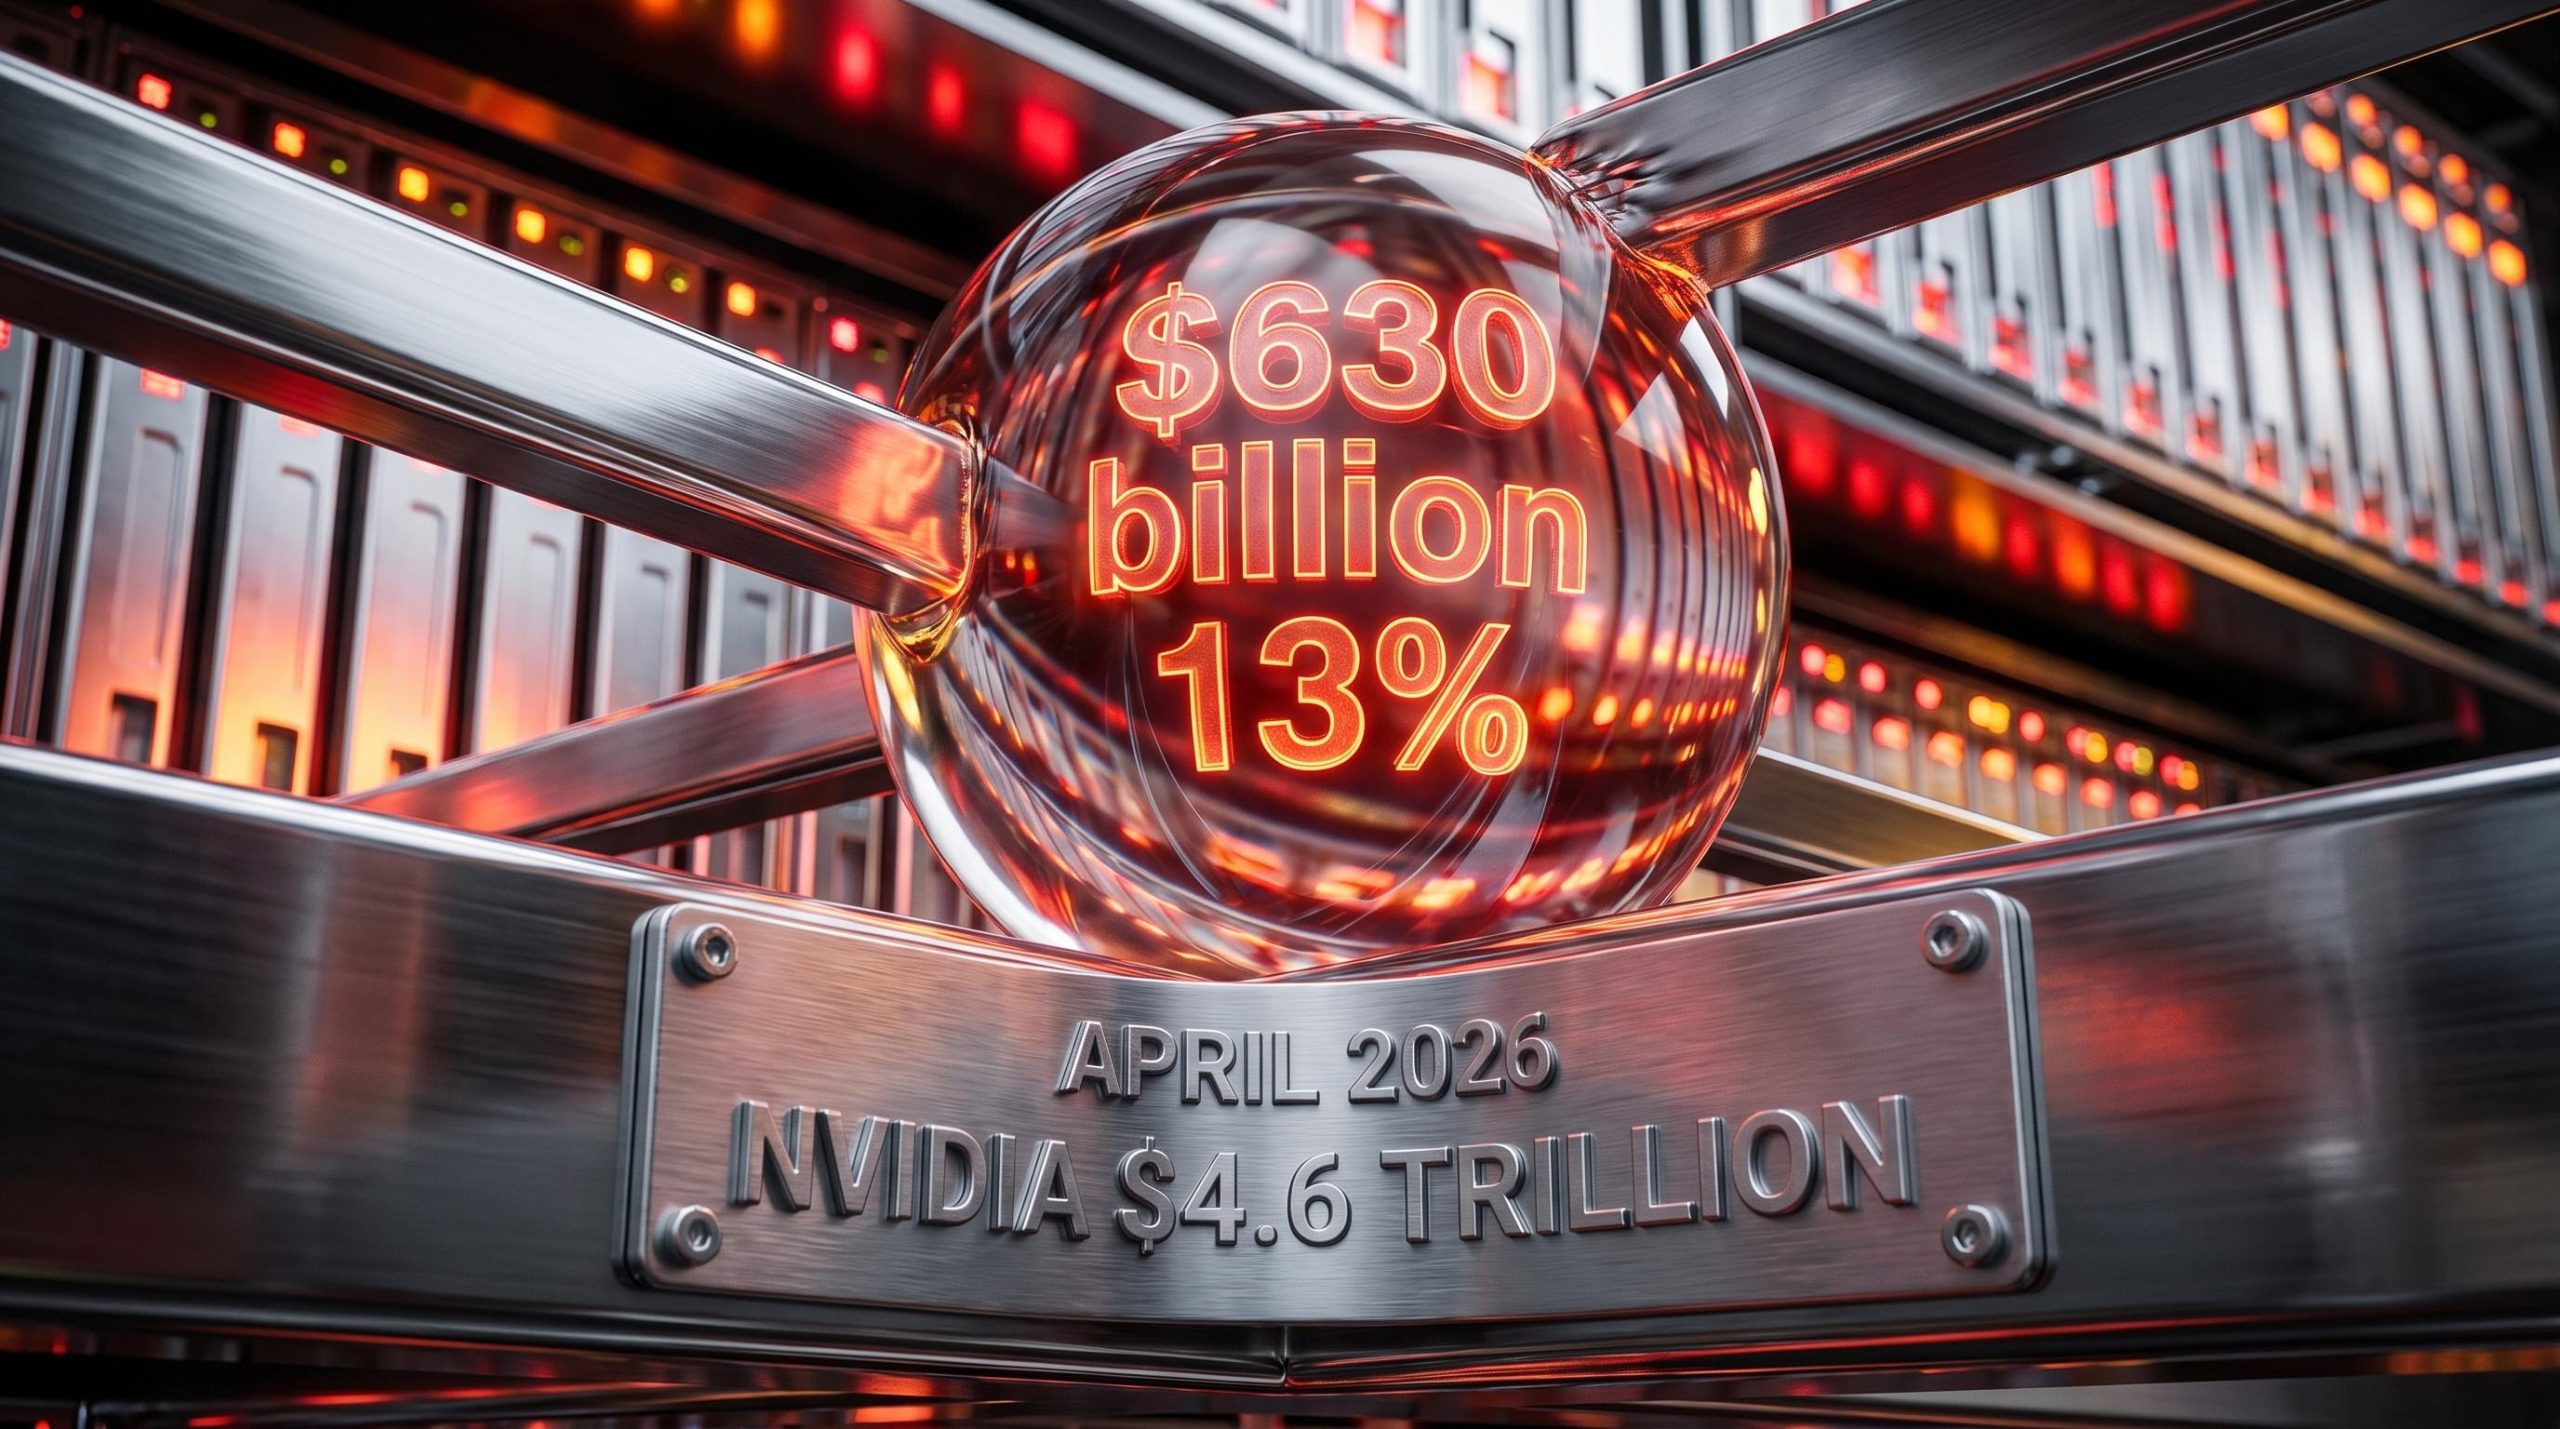
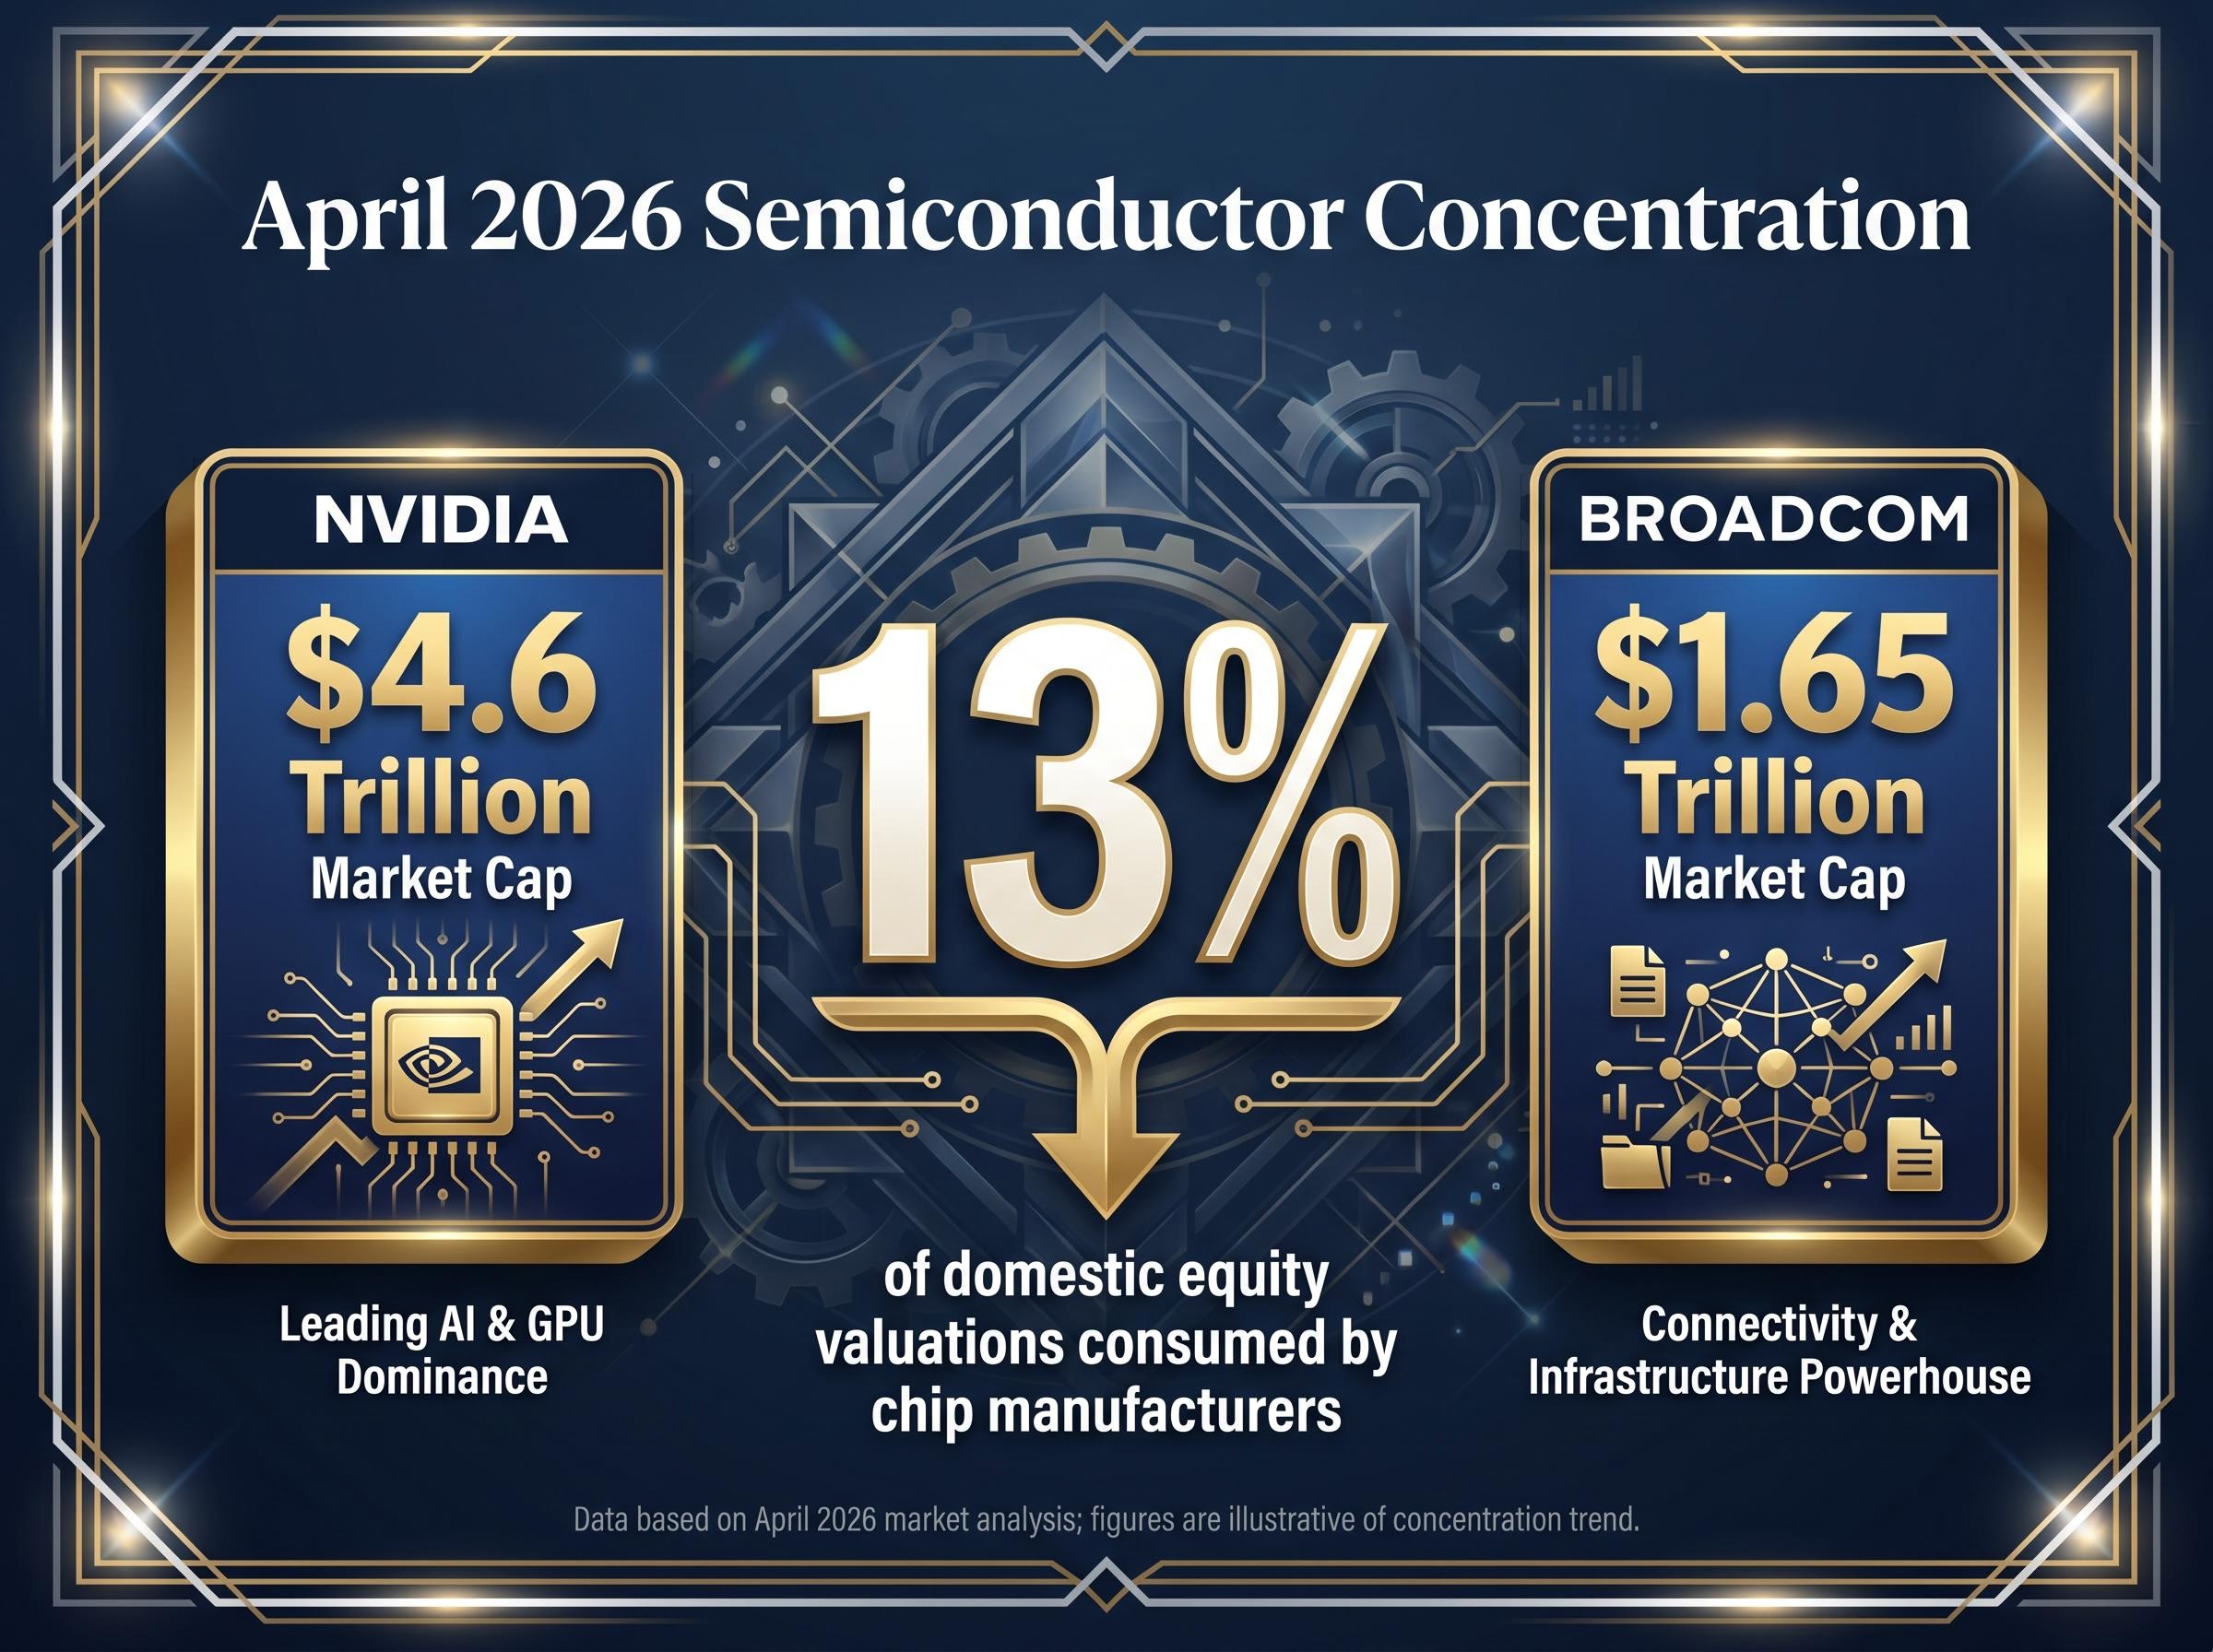
Chip manufacturers now consume up to 13% of all domestic equity valuations, a figure that doubles the market concentration witnessed at the absolute peak of the internet boom. This extraordinary weighting arrives during the late April 2026 earnings season, where technology giants are revealing massive infrastructure costs that are beginning to spook Wall Street.
The tension between historical market euphoria and current capital expenditure creates a distinct tech bubble risk profile for institutional and retail portfolios. A rigorous examination of the systemic vulnerabilities inherent in artificial intelligence hardware valuations separates sustainable commercial growth from speculative momentum. Commercial investors require a structured framework to evaluate their market exposure as early financial indicators begin to show strain under the weight of unprecedented capital demands.
The gap between the severity of these infrastructure costs and the timeline for actual financial returns reveals how markets are pricing this expansion. Investors face a highly complex environment where capital allocation must distinguish between verified cash flow and theoretical future earnings.
Semiconductor Dominance and the Echoes of 2000
The current statistical reality of the United States equity market presents an unprecedented structural concentration. Semiconductor companies represent a record 13% of total market capitalisation as of April 2026, driven entirely by surging demand for artificial intelligence hardware. Leading this sector are NVIDIA, which recently reached a $4.6 trillion market capitalisation, and Broadcom, valued at $1.65 trillion.
This specific weighting creates a fragile upward momentum that financial strategists continue to monitor. The rapid accumulation of capital within this single hardware layer has triggered warnings across major financial institutions regarding the sustainability of these multiples.
The scale of AI capital expenditure by major hyperscalers directly influences semiconductor stock valuations, establishing a multi-year investment cycle that complicates short-term earnings projections.
The Historical Comparison Point
The volume of capital concentrated in these hardware providers invites direct comparisons to historical market peaks. Market analysts during March 2026 observed that the recent pullback sparked uncomfortable comparisons to the final months of the 2000 technology peak. The data validates investor unease by quantifying exactly how concentrated the market has become.
Analyst Warning “Semiconductor stocks haven’t been this hot since the dot-com bubble, and it could end badly,” reported Yahoo Finance on 20 April 2026.
This historical comparison moves the conversation from abstract anxiety to measurable fact. The current sector weighting skews broader market health metrics, masking weakness in other segments of the economy under the extraordinary returns of a few hardware manufacturers.
When a handful of hardware stocks dictate overall index performance, the mechanics of market vulnerability shift entirely. An isolated correction in semiconductor multiples possesses the mathematical weight to drag down broad index valuations regardless of fundamental strength in other sectors.
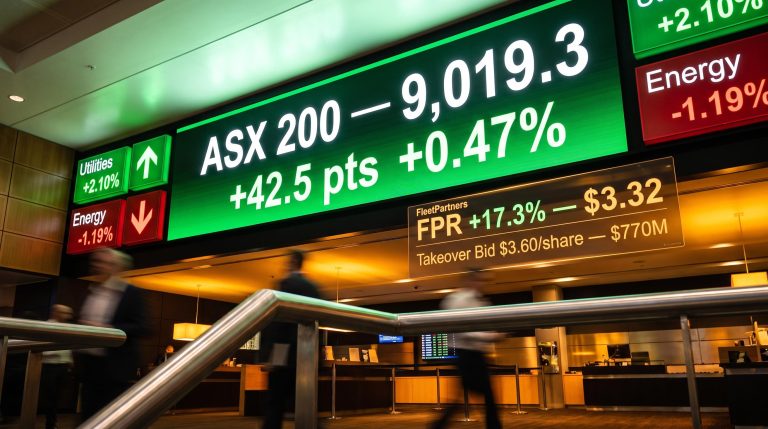
When big ASX news breaks, our subscribers know first
Understanding Market Concentration Risk
Market concentration risk occurs when a small group of companies accounts for an outsized percentage of an index’s total value. For passive index funds and active commercial portfolios, this means standard diversification strategies provide less protection than historical models suggest. Investors often assume a broad index fund spreads their risk evenly across hundreds of companies.
The reality of extreme index concentration completely alters these traditional diversification benefits, transforming broad market index funds into highly leveraged bets on global digital infrastructure.
In a cap-weighted index, a company’s influence grows alongside its market valuation. An equal-weight index assigns the same percentage to every company regardless of size, distributing risk evenly across the board. The current market structure relies heavily on cap-weighted vulnerabilities, meaning a correction in the largest technology holdings forces broad market liquidation.
An impending valuation shift approaching for Alphabet, Amazon, Meta, and Microsoft combined exemplifies this concentrated volatility. This massive capital movement illustrates the cascading effect that occurs when a single hyper-valued sector experiences a correction. Investors must shift their evaluation away from individual stock success and toward structural market health.
The mechanisms of contagion in a highly concentrated market operate through specific pathways:
Capital allocation algorithms automatically sell off correlated assets when top index constituents drop. Margin calls on leveraged hardware positions force investors to liquidate holdings in unrelated sectors to cover losses. * Passive funds must rebalance their entire portfolios in response to rapid market capitalisation changes among the largest technology stocks.
The 630 Billion Infrastructure Disconnect
The focus of financial markets shifted rapidly from theoretical share prices to corporate balance sheets during the Q1 2026 earnings cycle. Major technology players reported massive capital expenditures required to sustain the artificial intelligence arms race. The combined artificial intelligence capital expenditure for Alphabet, Amazon, Meta, and Microsoft is projected to hit $630 billion for the year 2026.
This staggering cost highlights a growing disconnect between astronomical infrastructure investments and the uncertain timelines for generating an actual return on investment. The market response to these April 2026 earnings reports reveals growing impatience among commercial investors. Companies beating their revenue estimates are still being punished for outsized spending commitments that threaten near-term profitability.
Meta reported its own capital expenditure figures reaching between $115 billion and $135 billion. Microsoft reported a 5% increase in operating expenses directly attributed to artificial intelligence and cloud investments. Alphabet posted a sales increase alongside a cloud revenue jump, but this growth was immediately contrasted against the massive spending required to maintain it.
By exposing the raw cost of maintaining this technological growth, the financial data explains why capital is beginning to rotate away from growth promises. The market is increasingly demanding immediate profitability to justify these infrastructure outlays.
| Company | Projected 2026 Capex | Notable Q1 2026 Revenue Growth | Market Reaction Trend |
|---|---|---|---|
| Alphabet | Part of $630B combined total | Sales increase, cloud jump | Negative pressure on margin concerns |
| Amazon | Part of $630B combined total | Annual cloud growth | Cautious amid infrastructure costs |
| Meta | $115B to $135B | Revenue estimates beaten | Negative due to spending surge |
| Microsoft | Part of $630B combined total | Stable software performance | Pressured by 5% AI operating cost increase |
Downstream Contagion from OpenAI Performance Metrics
The internal commercial realities facing OpenAI serve as a precise proxy for the entire artificial intelligence industry’s monetisation timeline. Early revenue and user projections for the software layer are colliding with sober performance metrics in early 2026. These software-layer struggles connect directly to the hardware layer, explaining why missed platform targets trigger immediate sell-offs in semiconductor stocks.
OpenAI missed its ambitious target of reaching 1 billion weekly active users by the end of 2025. Earlier verifiable metrics indicate the platform was sitting near 200 million weekly active users during late 2025. The company faces an expected cash burn of $122 billion over the next three years to support its operations.
This user acquisition shortfall mirrors broader monetization hurdles, as Wall Street Journal financial reporting reveals growing tension between the software developer’s massive data centre contracts and its ongoing struggles to meet internal revenue targets.
The financial commitments are staggering when compared against actual user acquisition metrics:
The company has $600 billion committed to data centre spending to support future capacity. An expected $122 billion cash burn depends entirely on meeting heavily revised revenue targets. * Long-term projections of reaching $125 billion in total revenue by 2029 are facing significant market doubt.
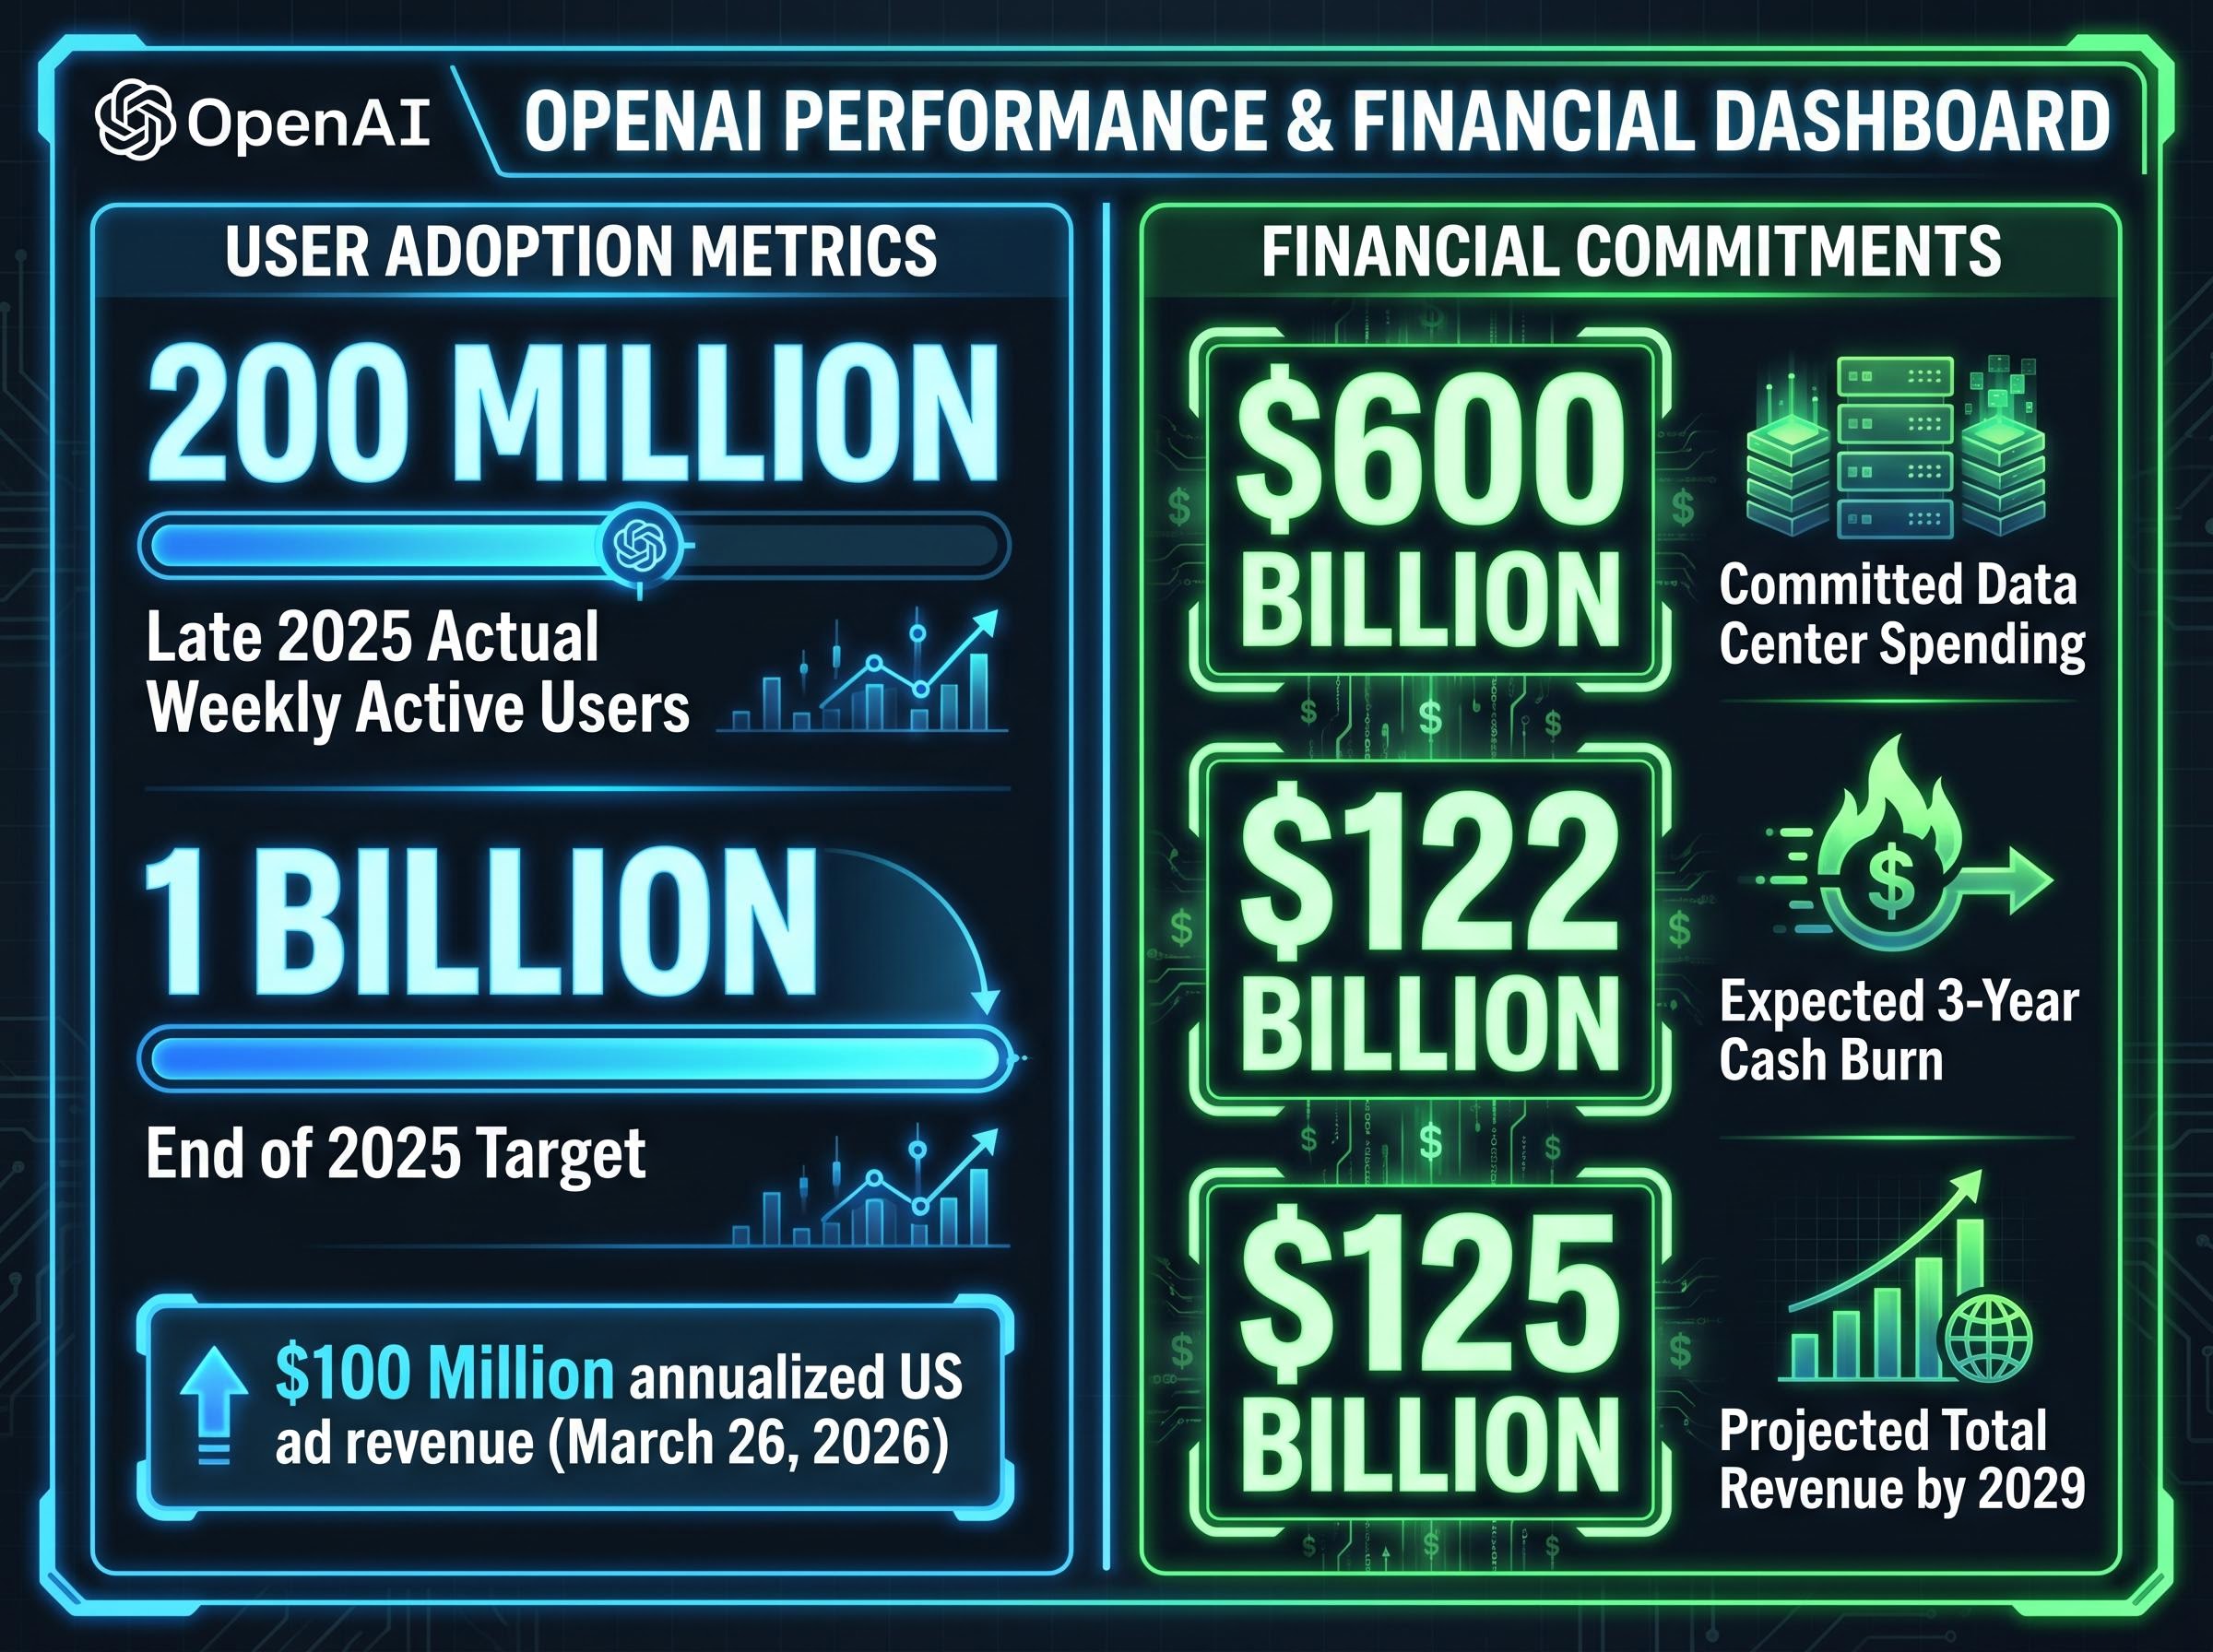
A recent ads pilot update released on 26 March 2026 successfully crossed $100 million in annualised United States ad revenue. This represents a verifiable commercial win, but the market views it as a small victory overshadowed by massive infrastructure debts. These consumer adoption metrics act as a leading indicator for semiconductor health, providing the fundamental reason behind sudden hardware stock drops.
Commercial Strategies for Heavy Technology Allocations
This macroeconomic tension requires commercial and institutional investors to stress-test their portfolios against an artificial intelligence hardware correction. The current environment demands a clear differentiation between companies utilising technology to drive efficiency and those selling highly volatile infrastructure. Sustainable monetisation must take precedence over speculative growth promises.
Amazon’s annual cloud growth serves as an example of realistic cloud computing expansion generating verifiable cash flow. This contrasts sharply with speculative infrastructure hoarding, where capital is deployed without a defined commercial application. Investors must focus on proven cash flow and realistic return on investment horizons.
The following portfolio evaluation framework gives commercial allocators specific criteria to audit their market exposure:
- Evaluate cap-weight index exposure by calculating the precise percentage of the portfolio tied directly to the largest five semiconductor manufacturers.
- Audit the underlying return on investment for technology holdings by comparing their stated capital expenditures against actual quarterly revenue growth.
- Identify secondary infrastructure reliance by assessing how a 20% correction in hardware valuations would impact the funding capabilities of software-layer holdings.
These parameters transform abstract concentration risks into an actionable commercial blueprint. Market participants can use these metrics to determine which technology holdings possess the balance sheet strength to survive an infrastructure spending cycle.
For allocators needing to model the worst-case scenarios of this capital cycle, our full explainer on the AI hardware bubble details how escalating inference costs and unproven software monetization could trigger a severe pullback in hyperscaler data center budgets by 2027.
The Thin Line Between Innovation and Irrational Exuberance
The late April 2026 market environment presents a profound tension between genuine technological advancement and valuations that have detached from fundamental reality. The computational capabilities arriving in the commercial sector represent an undeniable paradigm shift for global productivity. However, the staggering capital expenditures required to build this infrastructure closely mirror the dangerous market dynamics observed in previous technology cycles.
Commercial investors must approach an overheated hardware market with extreme caution. The mathematical reality of index concentration means that isolated failures in technology monetisation will inevitably impact broader equity portfolios. Capital allocation should prioritise companies demonstrating immediate profitability and realistic infrastructure deployment over those promising distant growth.
The systemic nature of these vulnerabilities has already triggered official regulatory scrutiny, with Federal Reserve financial stability guidance explicitly identifying artificial intelligence market concentration as a potential disruption vector for broad equity markets.
This article is for informational purposes only and should not be considered financial advice. Investors should conduct their own research and consult with financial professionals before making investment decisions. Past performance does not guarantee future results. Financial projections are subject to market conditions and various risk factors.