The S&P 500 fell less than 10% from its February peak. That was the headline. Beneath it, roughly half of all Russell 3000 stocks dropped 20% or more during the same stretch, a correction twice as deep as the index suggested.
Q1 2026 earnings season has now largely concluded, with 95% of S&P 500 companies reporting. The results arrived against the backdrop of the March 2026 drawdown, which spooked investors but which strategists have since characterised as constructive consolidation. Understanding what the earnings data actually shows, and how it interacts with that correction, is now the central question for investors assessing whether current S&P 500 price targets are justified.
This piece parses the Q1 earnings results, the correction’s true magnitude at the stock level, and Morgan Stanley’s revised price target to give investors a cleaner picture of whether the selloff was a signal to exit or an entry point.
The March selloff looked orderly at the index level and brutal beneath it
At the surface, the correction was unremarkable. The S&P 500 declined less than 10% peak-to-trough from its February highs, a drawdown that barely qualifies as a correction by textbook definition.
The individual stock data told a different story.
Approximately 50% of Russell 3000 constituents declined 20% or more peak-to-trough during the same period, a far deeper repricing than the index headline captured.
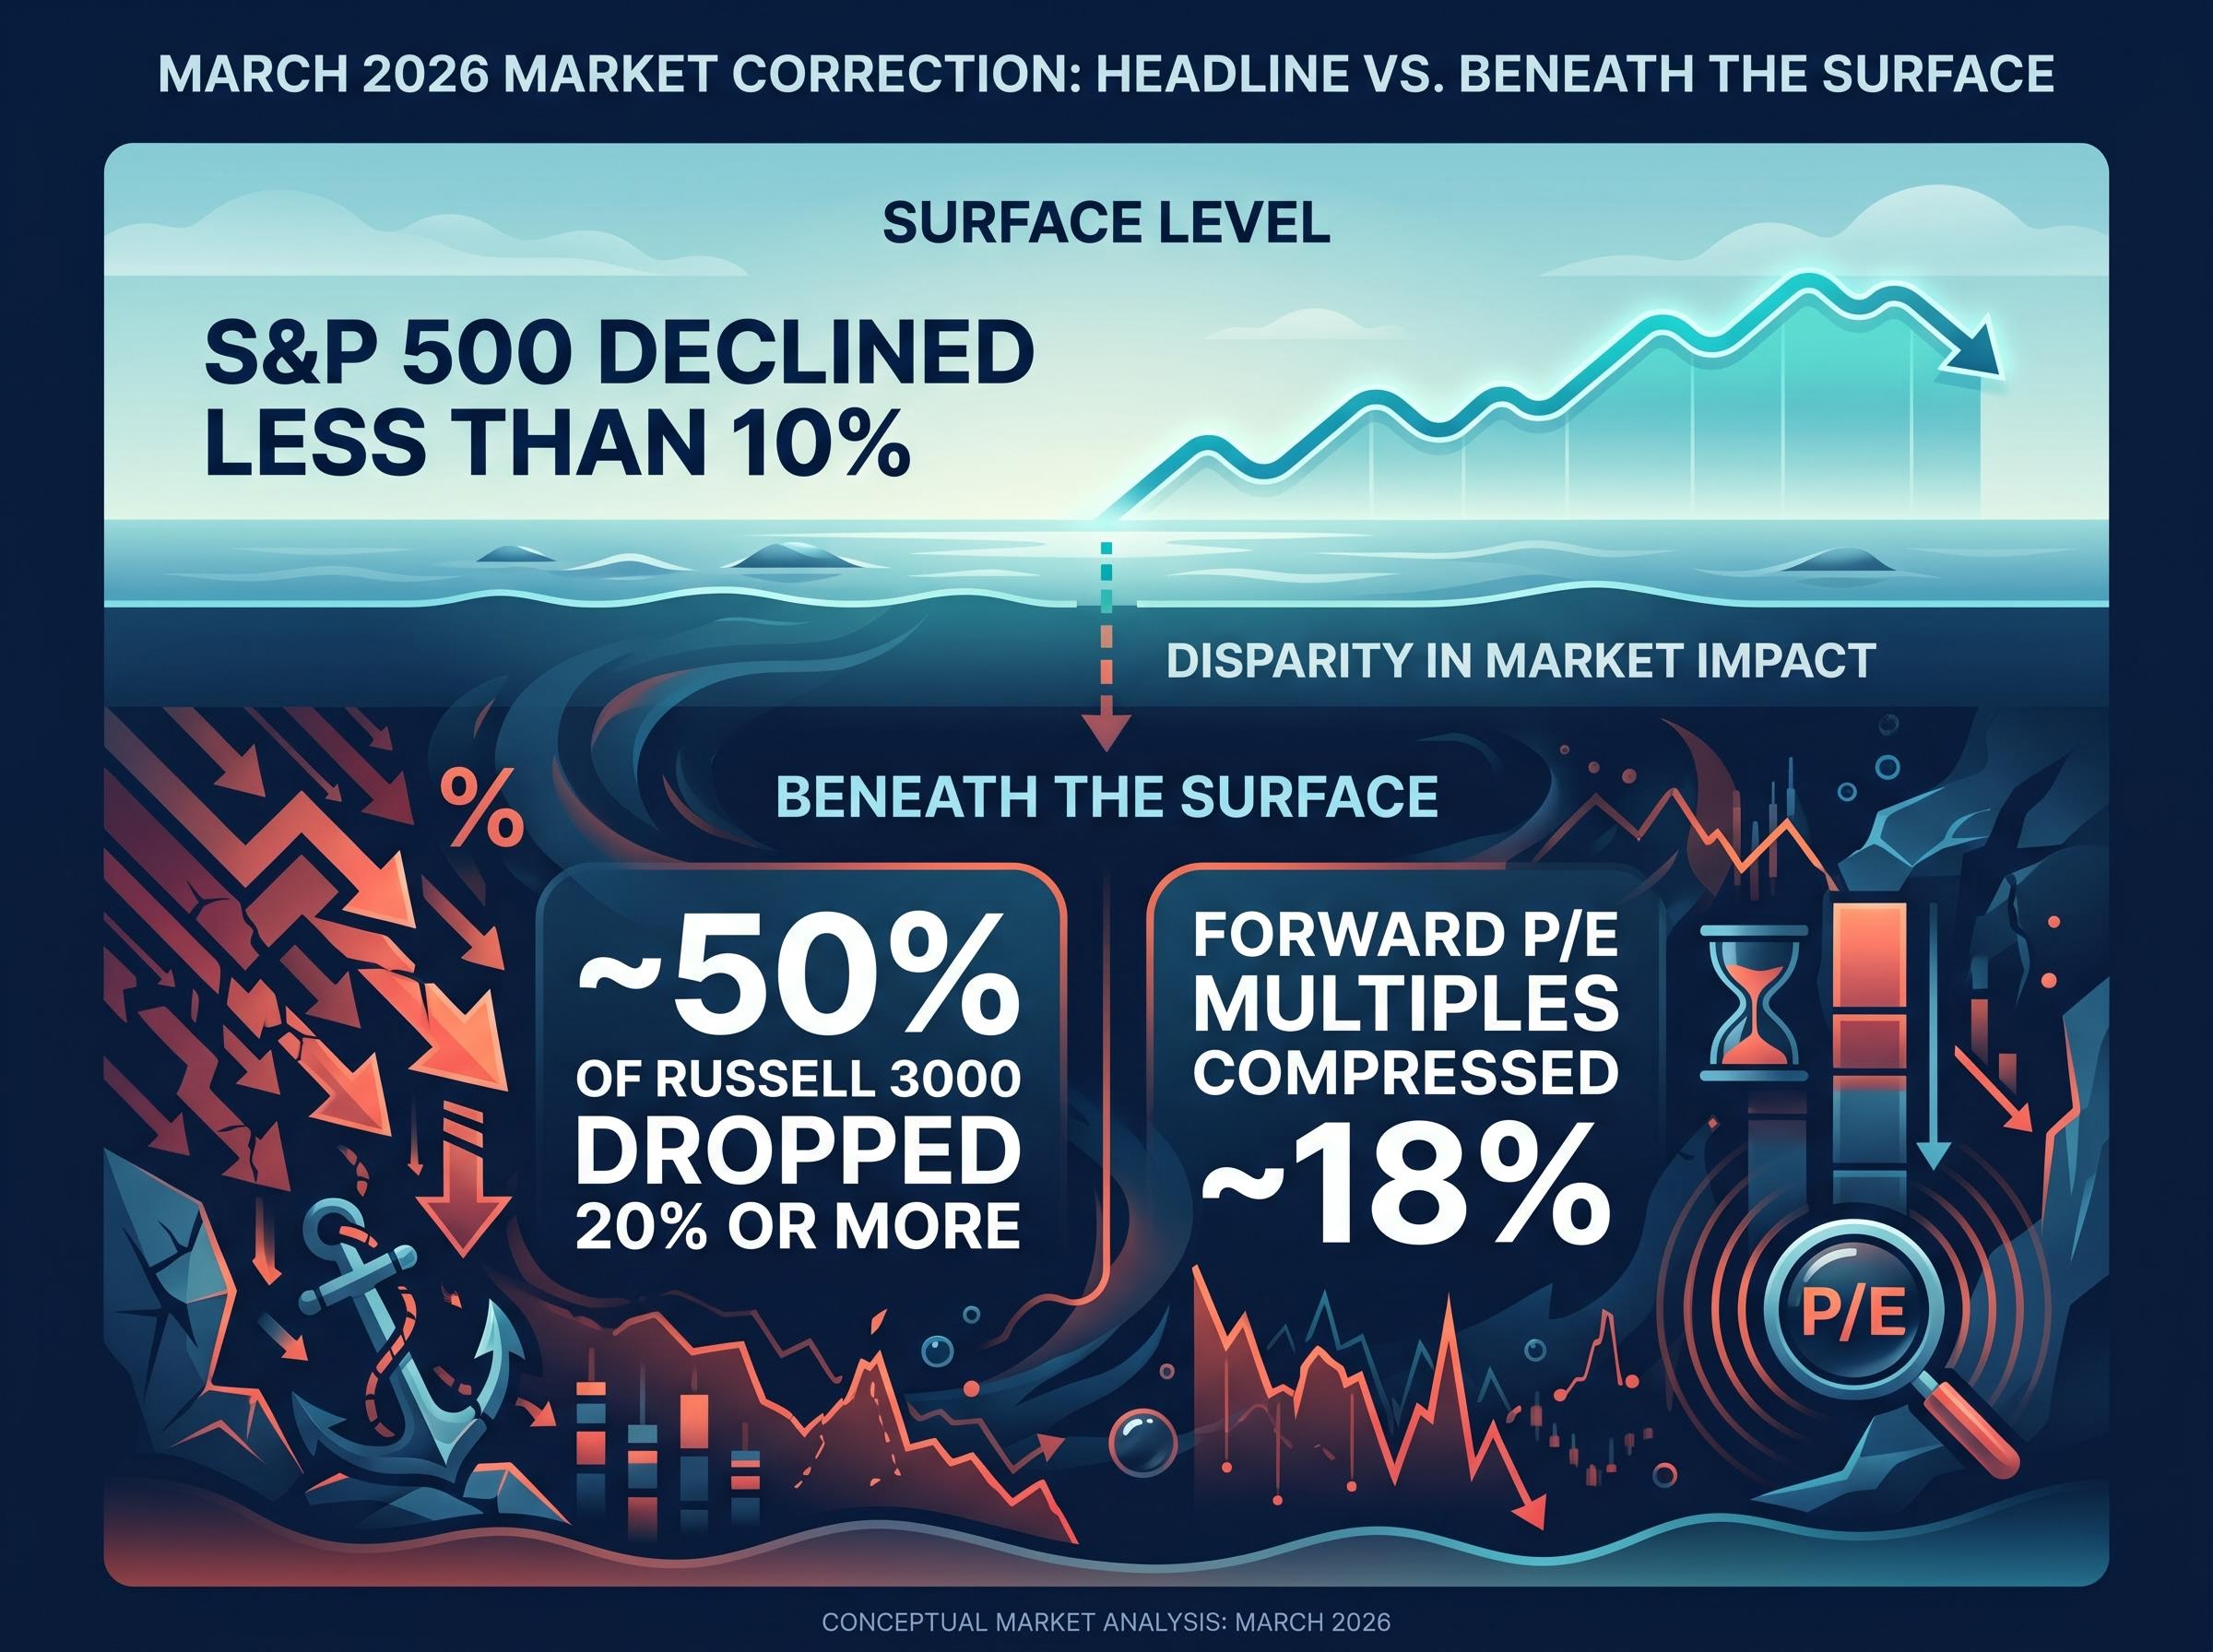
Forward price-to-earnings multiples compressed by approximately 18% from their peak, even as forward earnings-per-share estimates continued to climb. That combination, falling valuations alongside rising earnings forecasts, is the kind of divergence that has historically preceded strong forward returns. Wells Fargo characterised the episode as “constructive consolidation,” drawing analogies to the 2018 and 2022 corrections in an April 30, 2026 note.
Three specific risk factors drove the selling:
- Iran conflict escalation and the associated oil price spike
- AI disruption fears, amplified by an NVIDIA guidance cut
- Private credit stress concentrated in real estate lending
Each has since resolved or been re-priced. That sequence matters.
When big ASX news breaks, our subscribers know first
What the three risk factors that drove the correction actually turned out to be
The Iran conflict was the most visible catalyst. Military strikes between January and March 2026 pushed oil prices up approximately 15% and accounted for roughly 20% of the broader market decline. By May, Goldman Sachs assessed the geopolitical risk premium as “priced in” (as of 11 May 2026), with de-escalation reducing the direct threat to energy supply chains.
AI disruption fears proved more reflexive than fundamental. An NVIDIA guidance cut during the correction amplified concerns about a capex slowdown across the technology sector, which fell approximately 12%. Yet large-cap tech reported Q1 EPS growth of +45%, and Bank of America described “AI winter fears” as “overblown” on 7 May 2026. The guidance cut triggered sentiment damage; the earnings data repaired it.
Private credit stress was the most structurally concerning of the three. Defaults of approximately 5% concentrated in real estate affected part of the $1.2 trillion private credit market, creating a liquidity squeeze that hit regional banks. Federal Reserve facilities contained the pressure. Both Morgan Stanley and JPMorgan characterised the episode as “contained, not systemic” in May 2026 assessments.
| Risk Factor | Peak Market Impact | Resolution Status | Key Analyst View |
|---|---|---|---|
| Iran conflict escalation | Oil +15%; ~20% of market decline | De-escalated; risk premium priced in | Goldman Sachs: “priced in” (11 May 2026) |
| AI disruption fears | Tech sector -12% | Q1 tech EPS +45%; fears dispelled | Bank of America: “AI winter fears overblown” (7 May 2026) |
| Private credit stress | ~5% defaults in real estate segment | Contained by Fed facilities | Morgan Stanley/JPMorgan: “contained, not systemic” (May 2026) |
Investors who sold during the correction were effectively selling the resolution of temporary fear, not deteriorating corporate fundamentals.
How to read an earnings beat rate and what Q1 2026’s number actually means
An EPS beat rate measures the percentage of companies that report earnings per share above analysts’ consensus estimates for a given quarter. The number sounds straightforward, but two features make it less intuitive than it appears.
First, analyst estimates tend to be revised downward in the weeks before reporting season begins, which means the bar companies are “beating” is often lower than the initial forecast. A high beat rate does not automatically signal corporate outperformance; it may partly reflect estimate management. Second, the headline beat rate treats every company equally. A more informative signal is the median EPS surprise, which captures the typical magnitude of the beat across individual stocks, and earnings revision breadth, which tracks whether analysts are raising or lowering their forward estimates after results.
The earnings expectations gap explains why the headline beat rate alone is insufficient as a signal: companies clear a bar that analysts have already moved downward in the weeks before reporting season, meaning an 84% beat rate reflects both genuine outperformance and the systematic sandbagging of pre-season estimates.
These two measures, median surprise and revision breadth, tell investors whether the beats are translating into genuinely higher expectations for the next twelve months, or simply clearing a sandbagged bar.
What Q1 2026’s results look like against prior seasons
The Q1 2026 data was strong on both counts. According to FactSet (as of 8 May 2026), 84% of S&P 500 companies beat EPS estimates, with a median beat of +6.2%, the highest in four years. Blended EPS growth came in at +27.7% year-on-year, up sharply from the 12.6% initial consensus, marking the sixth consecutive quarter of double-digit earnings growth.
The FactSet Earnings Insight for the week of 8 May 2026 confirms an 84% EPS beat rate alongside blended earnings growth of 27.7% year-on-year, the primary dataset underpinning the Q1 2026 earnings analysis presented here.
Revenue growth of +10.2% beat estimates by +1.1%, the strongest top-line result since Q3 2022.
Earnings revision breadth accelerated sharply post-correction: 22% of estimates were revised upward versus just 5% downgraded.
The forward EPS growth forecast for the median S&P 1500 stock moved from 8% to 12%, evidence that the beat rate translated into genuine upward revisions rather than short-term relief. This is the foundational data layer for understanding why Morgan Stanley raised its price target.
Where the earnings growth came from, and whether it is concentrated or broad
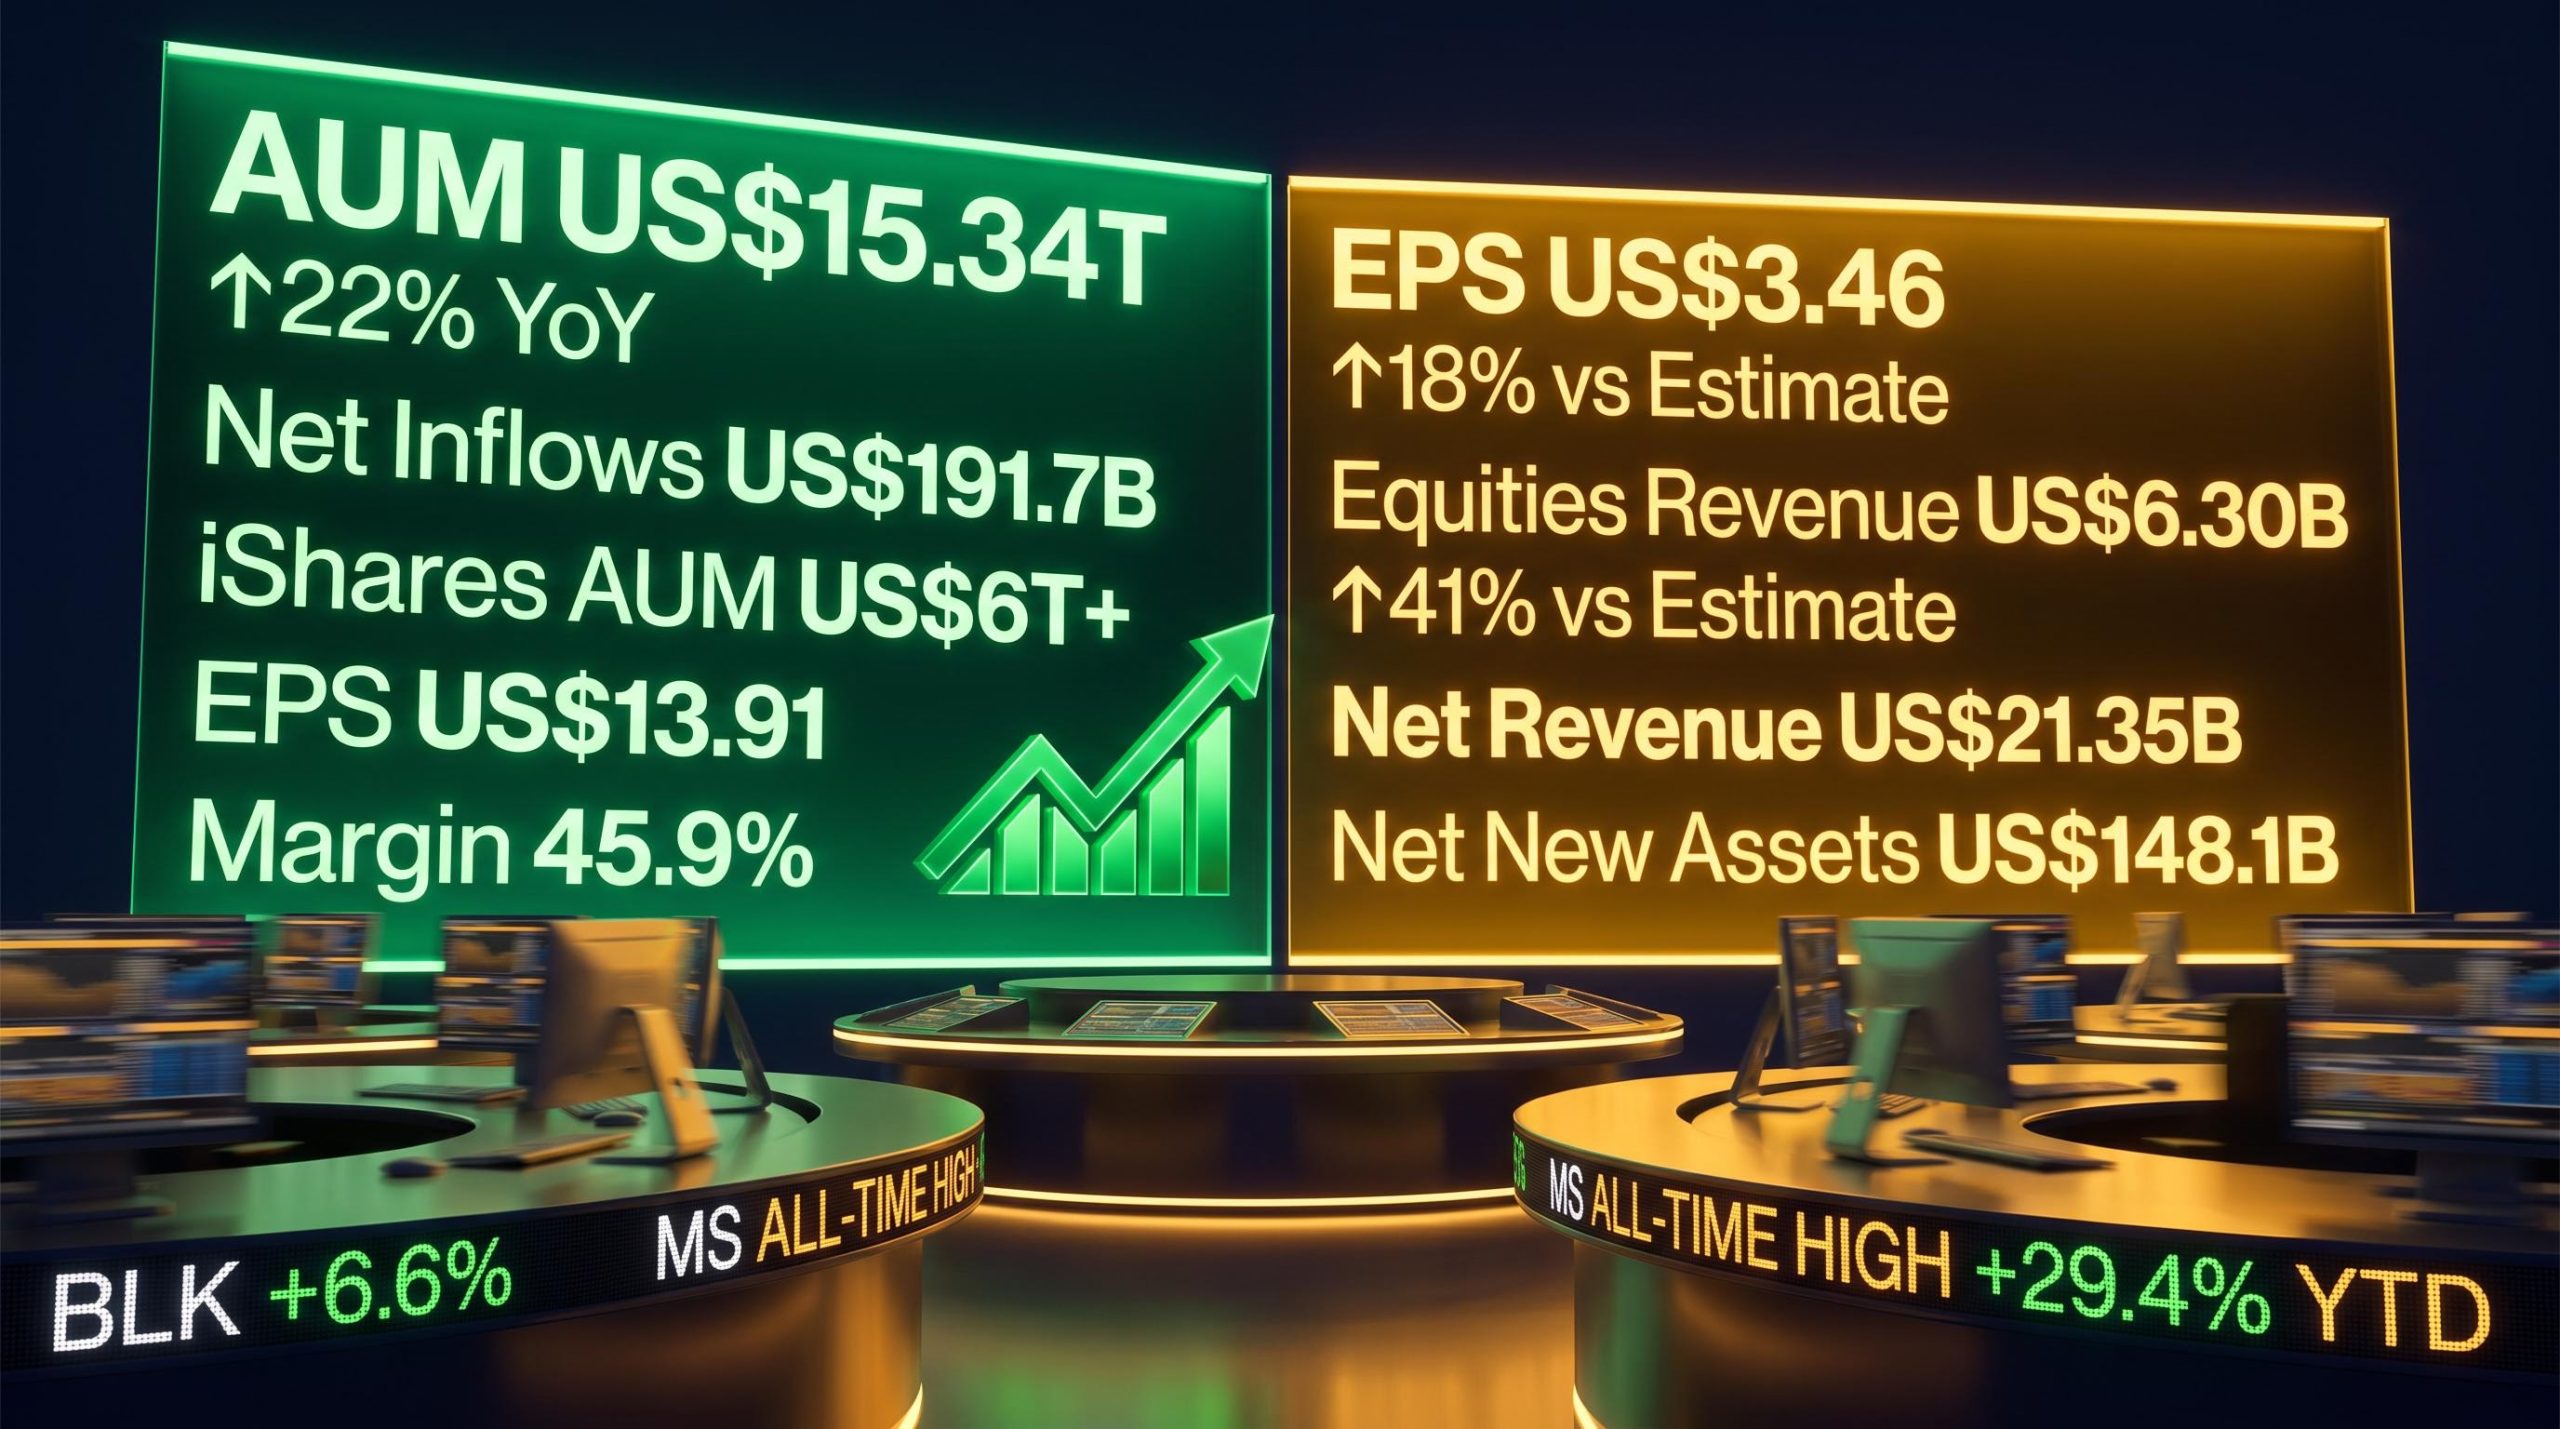
Large-cap tech delivered the strongest absolute results. The sector reported Q1 EPS growth of +45%, with a beat rate of 89% and year-to-date returns of +14.1%. The Magnificent 7 drove approximately 70% of S&P 500 gains, according to FactSet and Reuters data.
The AI monetisation debate sits at the centre of whether large-cap tech’s +45% EPS growth is a durable structural shift or a one-cycle anomaly: combined 2026 capex guidance from the four largest hyperscalers has now surpassed $700 billion, and whether those investments generate returns or represent capital misallocation is the variable that most directly determines whether the earnings thesis holds through Q2 and beyond.
That concentration is real, but the more interesting signal sits in the cyclicals. JPMorgan described industrials as the “new cycle leader” in a 9 May 2026 note, citing Q1 EPS growth of +19.2%, an 86% beat rate, and ongoing reshoring tailwinds supplemented by aerospace and defence spending tied to the Iran tensions.
Financials posted +15.1% EPS growth with a year-to-date return of +12.4%. Net interest margin expansion and a revival in mergers and acquisitions activity drove the results, and Bank of America flagged the sector as having the “best setup for H2 cuts” on 7 May 2026.
Consumer discretionary’s +13.8% EPS growth served as a direct counterpoint to the credit-stress narrative. Goldman Sachs noted on 11 May 2026 that the “consumer not broken” thesis was holding, supported by resilient auto and luxury spending.
| Sector | Q1 EPS Growth | YTD Return | Beat Rate | Key Analyst View |
|---|---|---|---|---|
| Large-Cap Tech | +45.0% | +14.1% | 89% | Magnificent 7 drove ~70% of S&P 500 gains (FactSet, Reuters) |
| Industrials | +19.2% | +8.2% | 86% | JPMorgan: “new cycle leader” (9 May 2026) |
| Financials | +15.1% | +12.4% | 82% | Bank of America: “best setup for H2 cuts” (7 May 2026) |
| Consumer Discretionary | +13.8% | +6.9% | 79% | Goldman Sachs: “consumer not broken” (11 May 2026) |
Broad-based earnings growth across cyclicals and technology simultaneously is the structural argument beneath Morgan Stanley’s revised target. The firm’s current sector preferences reflect this:
- Industrials, financials, and consumer discretionary as overweights
- Large-cap hyperscalers positioned as relative value
- Healthcare at neutral
Forecasting the S&P 500: How the revised price target was constructed and what it assumes
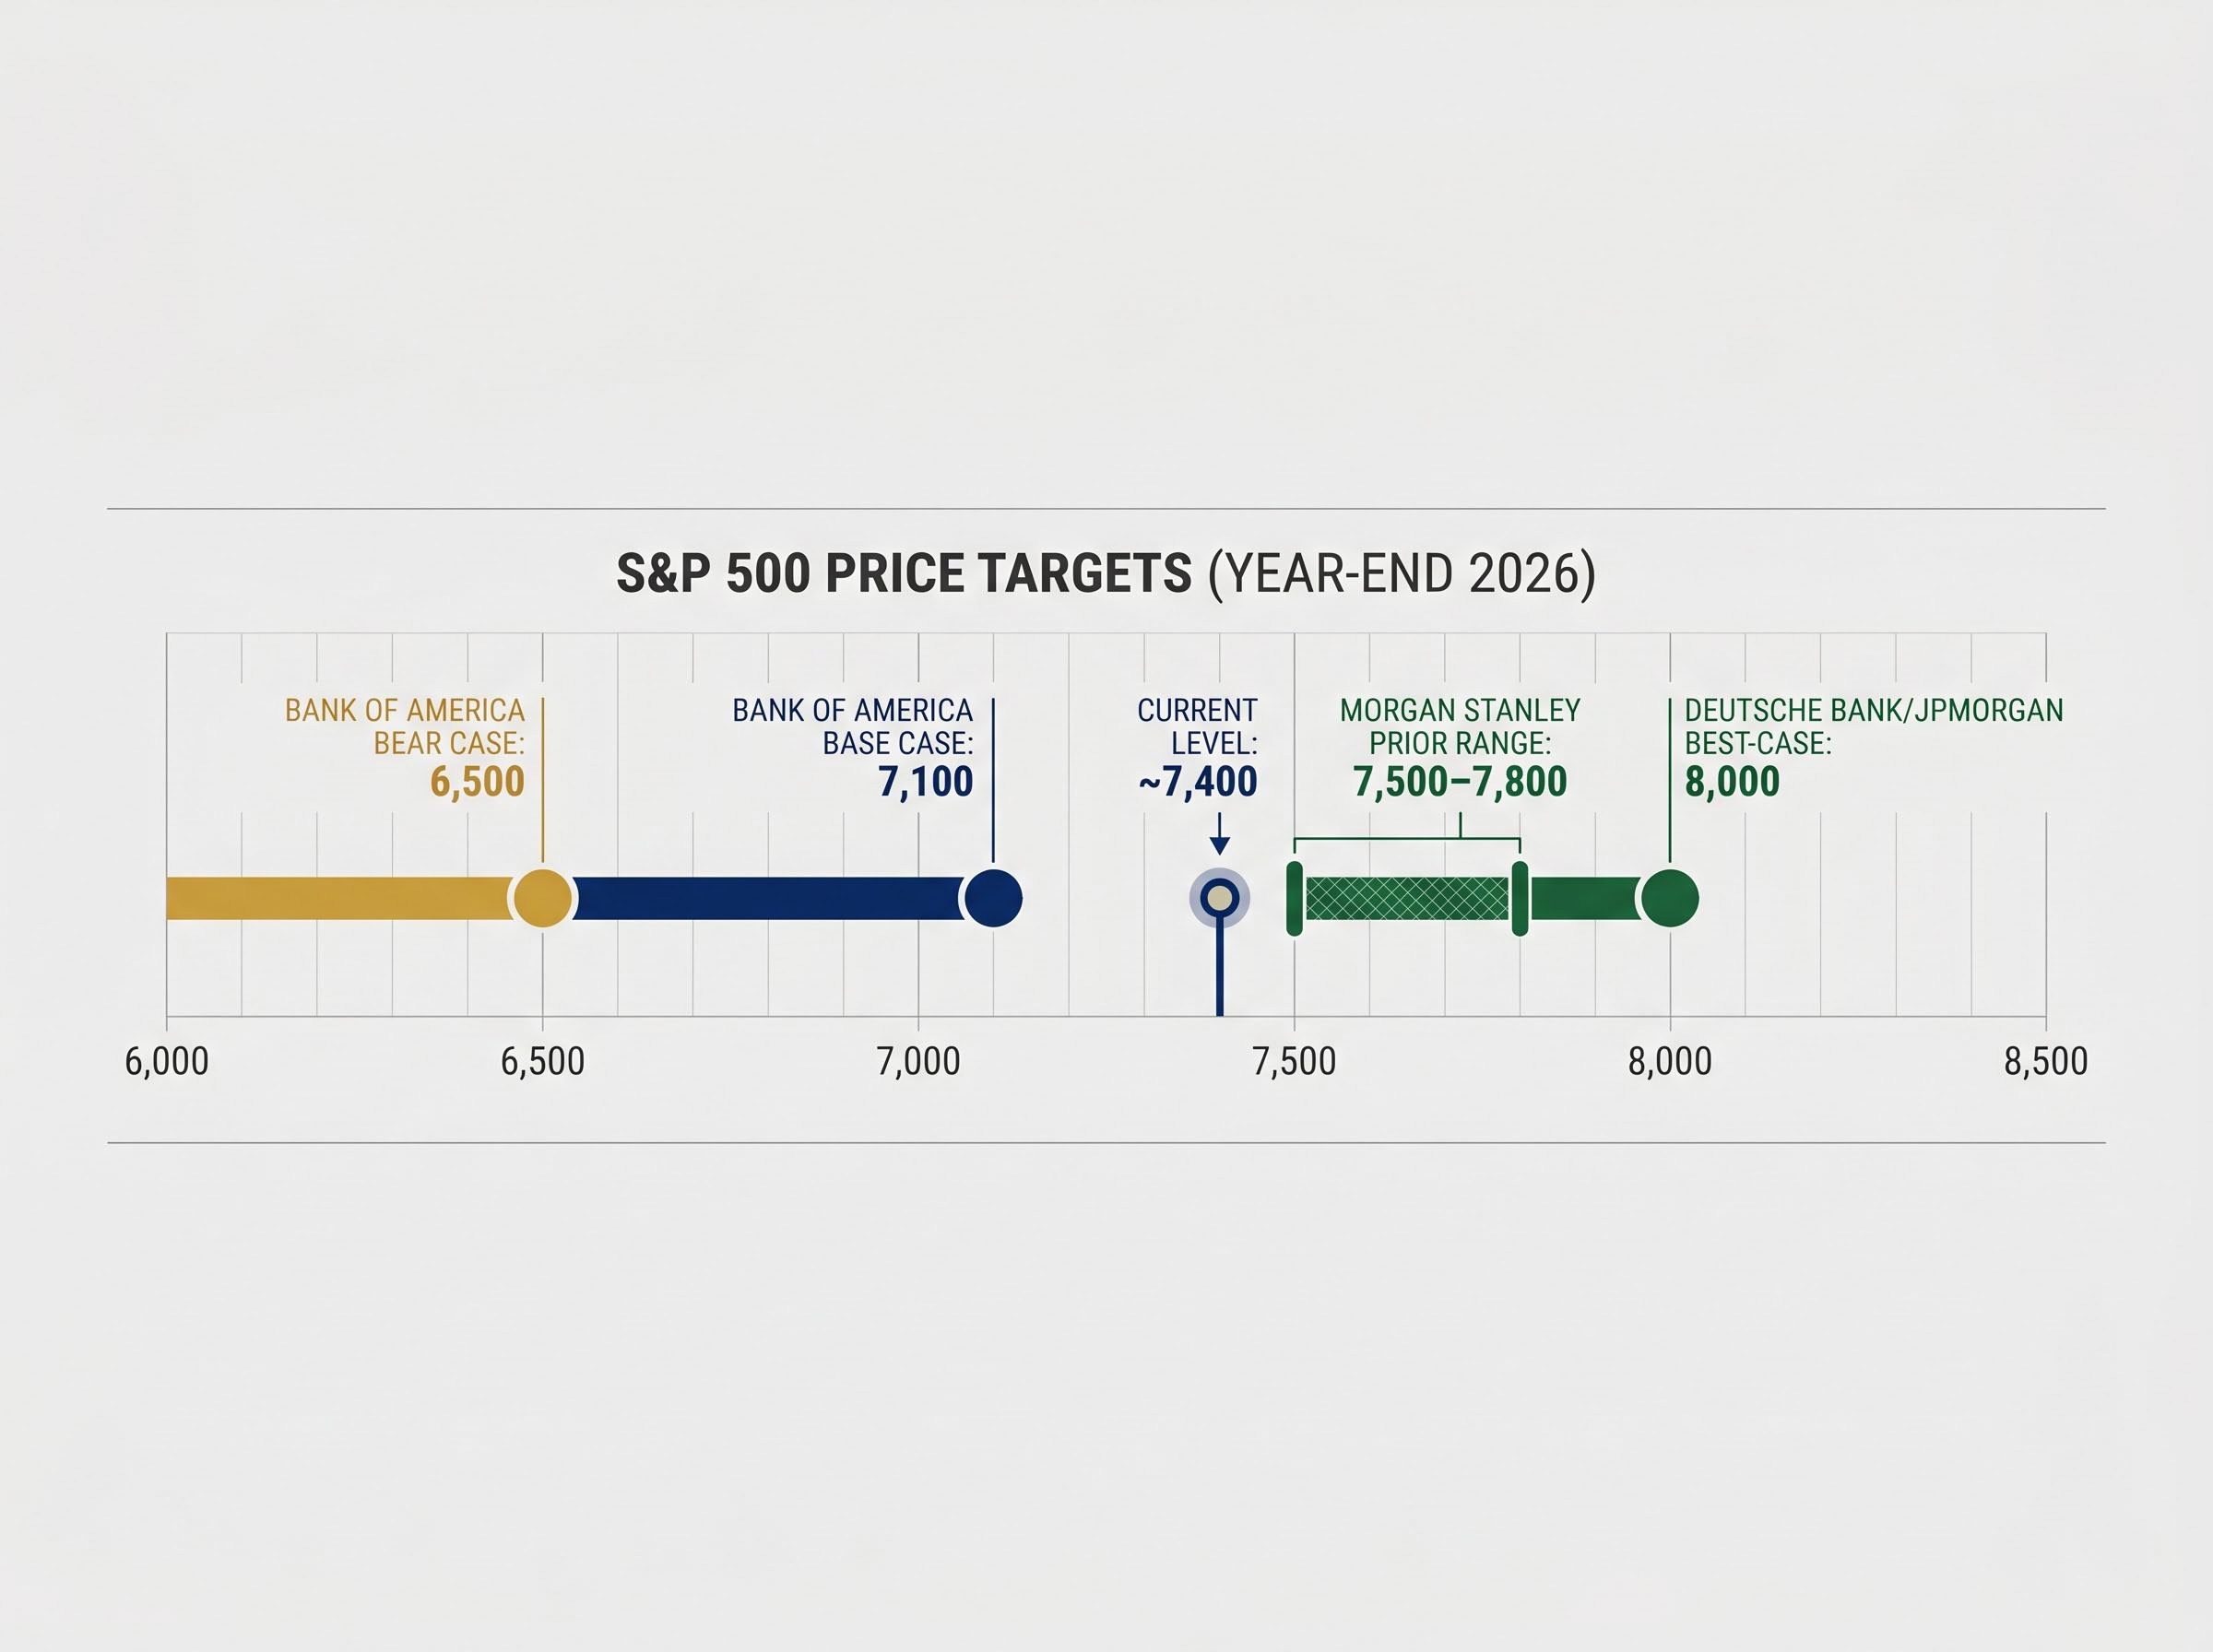
Michael Wilson at Morgan Stanley published a revised S&P 500 price target in May 2026. The year-end 2026 target was raised, from a prior range of approximately 7,500–7,800.
With the S&P 500 trading at approximately 7,400, the current Wall Street consensus range for year-end 2026 runs from Bank of America’s base case of 7,100 to the upper end at 8,000 (held by both Deutsche Bank and JPMorgan’s best-case scenario).
The EPS forecast progression embedded in the target is aggressive but consistent with the Q1 data: $339 for 2026 (approximately 23% year-on-year growth), $380 for 2027, and $429 for 2028. This is an earnings-per-share expansion thesis, not a multiple-expansion bet. The distinction matters because it identifies which macro scenarios would invalidate the target: anything that compresses earnings, not anything that compresses sentiment alone.
Morgan Stanley cites a historical backtest showing a median equity return of 14% during environments characterised by a Fed hold and strong earnings growth.
The Fed policy backdrop Morgan Stanley is not relying on
The target does not require rate cuts. The current federal funds rate sits at 3.50-3.75%, and the FOMC’s median 2026 year-end projection is 4.00%, implying two 25bp cuts in September and December. CME FedWatch data as of 13 May 2026 shows a 97.7% probability of a hold at the June meeting, with year-end pricing aligned with approximately 100bps of cuts.
Kevin Warsh’s confirmation as Federal Reserve chair on 12 May 2026 introduces near-term policy uncertainty. Investors waiting for rate cuts before adding equity exposure may find the earnings data has already done the work that monetary easing was supposed to do.
Investors wanting to understand the specific conditions under which the upper end of the consensus range becomes achievable will find our deep-dive into the S&P 500 path to 8,000, which maps out HSBC’s AI capex delivery threshold, the 4.5% Treasury yield ceiling, and the breadth recovery metrics that would need to materialise for the index to reach that level by year-end.
The next major ASX story will hit our subscribers first
The earnings case is solid, but these are the assumptions that could break it
Full-year 2026 EPS growth is now projected at +17.6%, revised upward from 15.8% before earnings season began, with full-year revenue growth at +9.0%. The post-earnings rally of approximately 9% confirmed the buying-opportunity thesis, according to FactSet and a Reuters strategist poll.
The bear case remains on record. Bank of America holds a 6,500 target under two conditions: an AI capex reversal and geopolitical risk re-escalation. Three named scenarios could break the earnings thesis:
Recession probability estimates from Goldman Sachs, JPMorgan, and Moody’s Analytics sat at 30-48% during the same period, a macro backdrop that the Q1 earnings data has since partially addressed but not fully resolved, and which remains the dominant risk variable beneath the consensus price target range.
- An AI capital expenditure reversal, where hyperscaler spending declines rather than plateaus, compressing tech earnings growth from +45% toward single digits
- Geopolitical re-escalation, particularly a resumption of Iran-related supply disruptions that re-introduces the oil risk premium
- A recession-driven EPS contraction that pulls full-year growth below the +17.6% consensus
Investors can monitor the thesis through three upcoming macro catalysts:
- Q2 2026 GDP releases, which will show whether growth held through the correction period
- July 2026 employment data, the first major labour market reading of H2
- The first FOMC meetings under Chair Warsh, which will establish the new policy communication framework
Past performance does not guarantee future results. Financial projections are subject to market conditions and various risk factors.
The earnings data and the selloff are telling the same story
The March correction compressed valuations by approximately 18% while corporate earnings delivered the strongest quarter in four years. That combination, falling multiples and rising fundamentals, is historically the setup that precedes strong forward returns.
Morgan Stanley’s revised target is built on earnings growth, not on the market re-rating to a higher multiple. Investors who waited for the correction to fully resolve before re-entering likely paid a premium for that certainty; the post-earnings rally of approximately 9% was the market pricing the resolution.
The Q1 data supports the view that the selloff was a buying opportunity. The thesis, however, is contingent on EPS estimates holding through Q2 reporting season. If forward earnings revisions remain positive, the gap between current levels and Wall Street’s upper-end targets suggests the market has room to run. If they reverse, the bear case has its trigger.
This article is for informational purposes only and should not be considered financial advice. Investors should conduct their own research and consult with financial professionals before making investment decisions.