Apple’s AI Bet Is a Services Play, Not an iPhone Supercycle
20 mins ago

Three policy announcements between January and May 2026 moved global equity markets more decisively than any economic data release in the same period. A tariff threat tied to a territorial dispute sent the S&P 500 down 2.06%. A ceasefire announcement sent South Korea’s KOSPI up 6.87% in a single session. A bilateral summit produced a 0.8% gain in the United States and a 1.5% decline in China on the same day.
In a period when diplomacy became the primary driver of investor returns, the ability to map policy headlines onto market exposures before events occurred separated portfolios that captured the moves from those that chased residual drift. The January-to-May 2026 sequence offers a structured case study in how that mapping works, and the pattern it reveals is reusable.
What follows reconstructs the three events in analytical sequence, identifies the structural pattern connecting them, and translates that pattern into a practical framework for navigating politically volatile markets going forward.
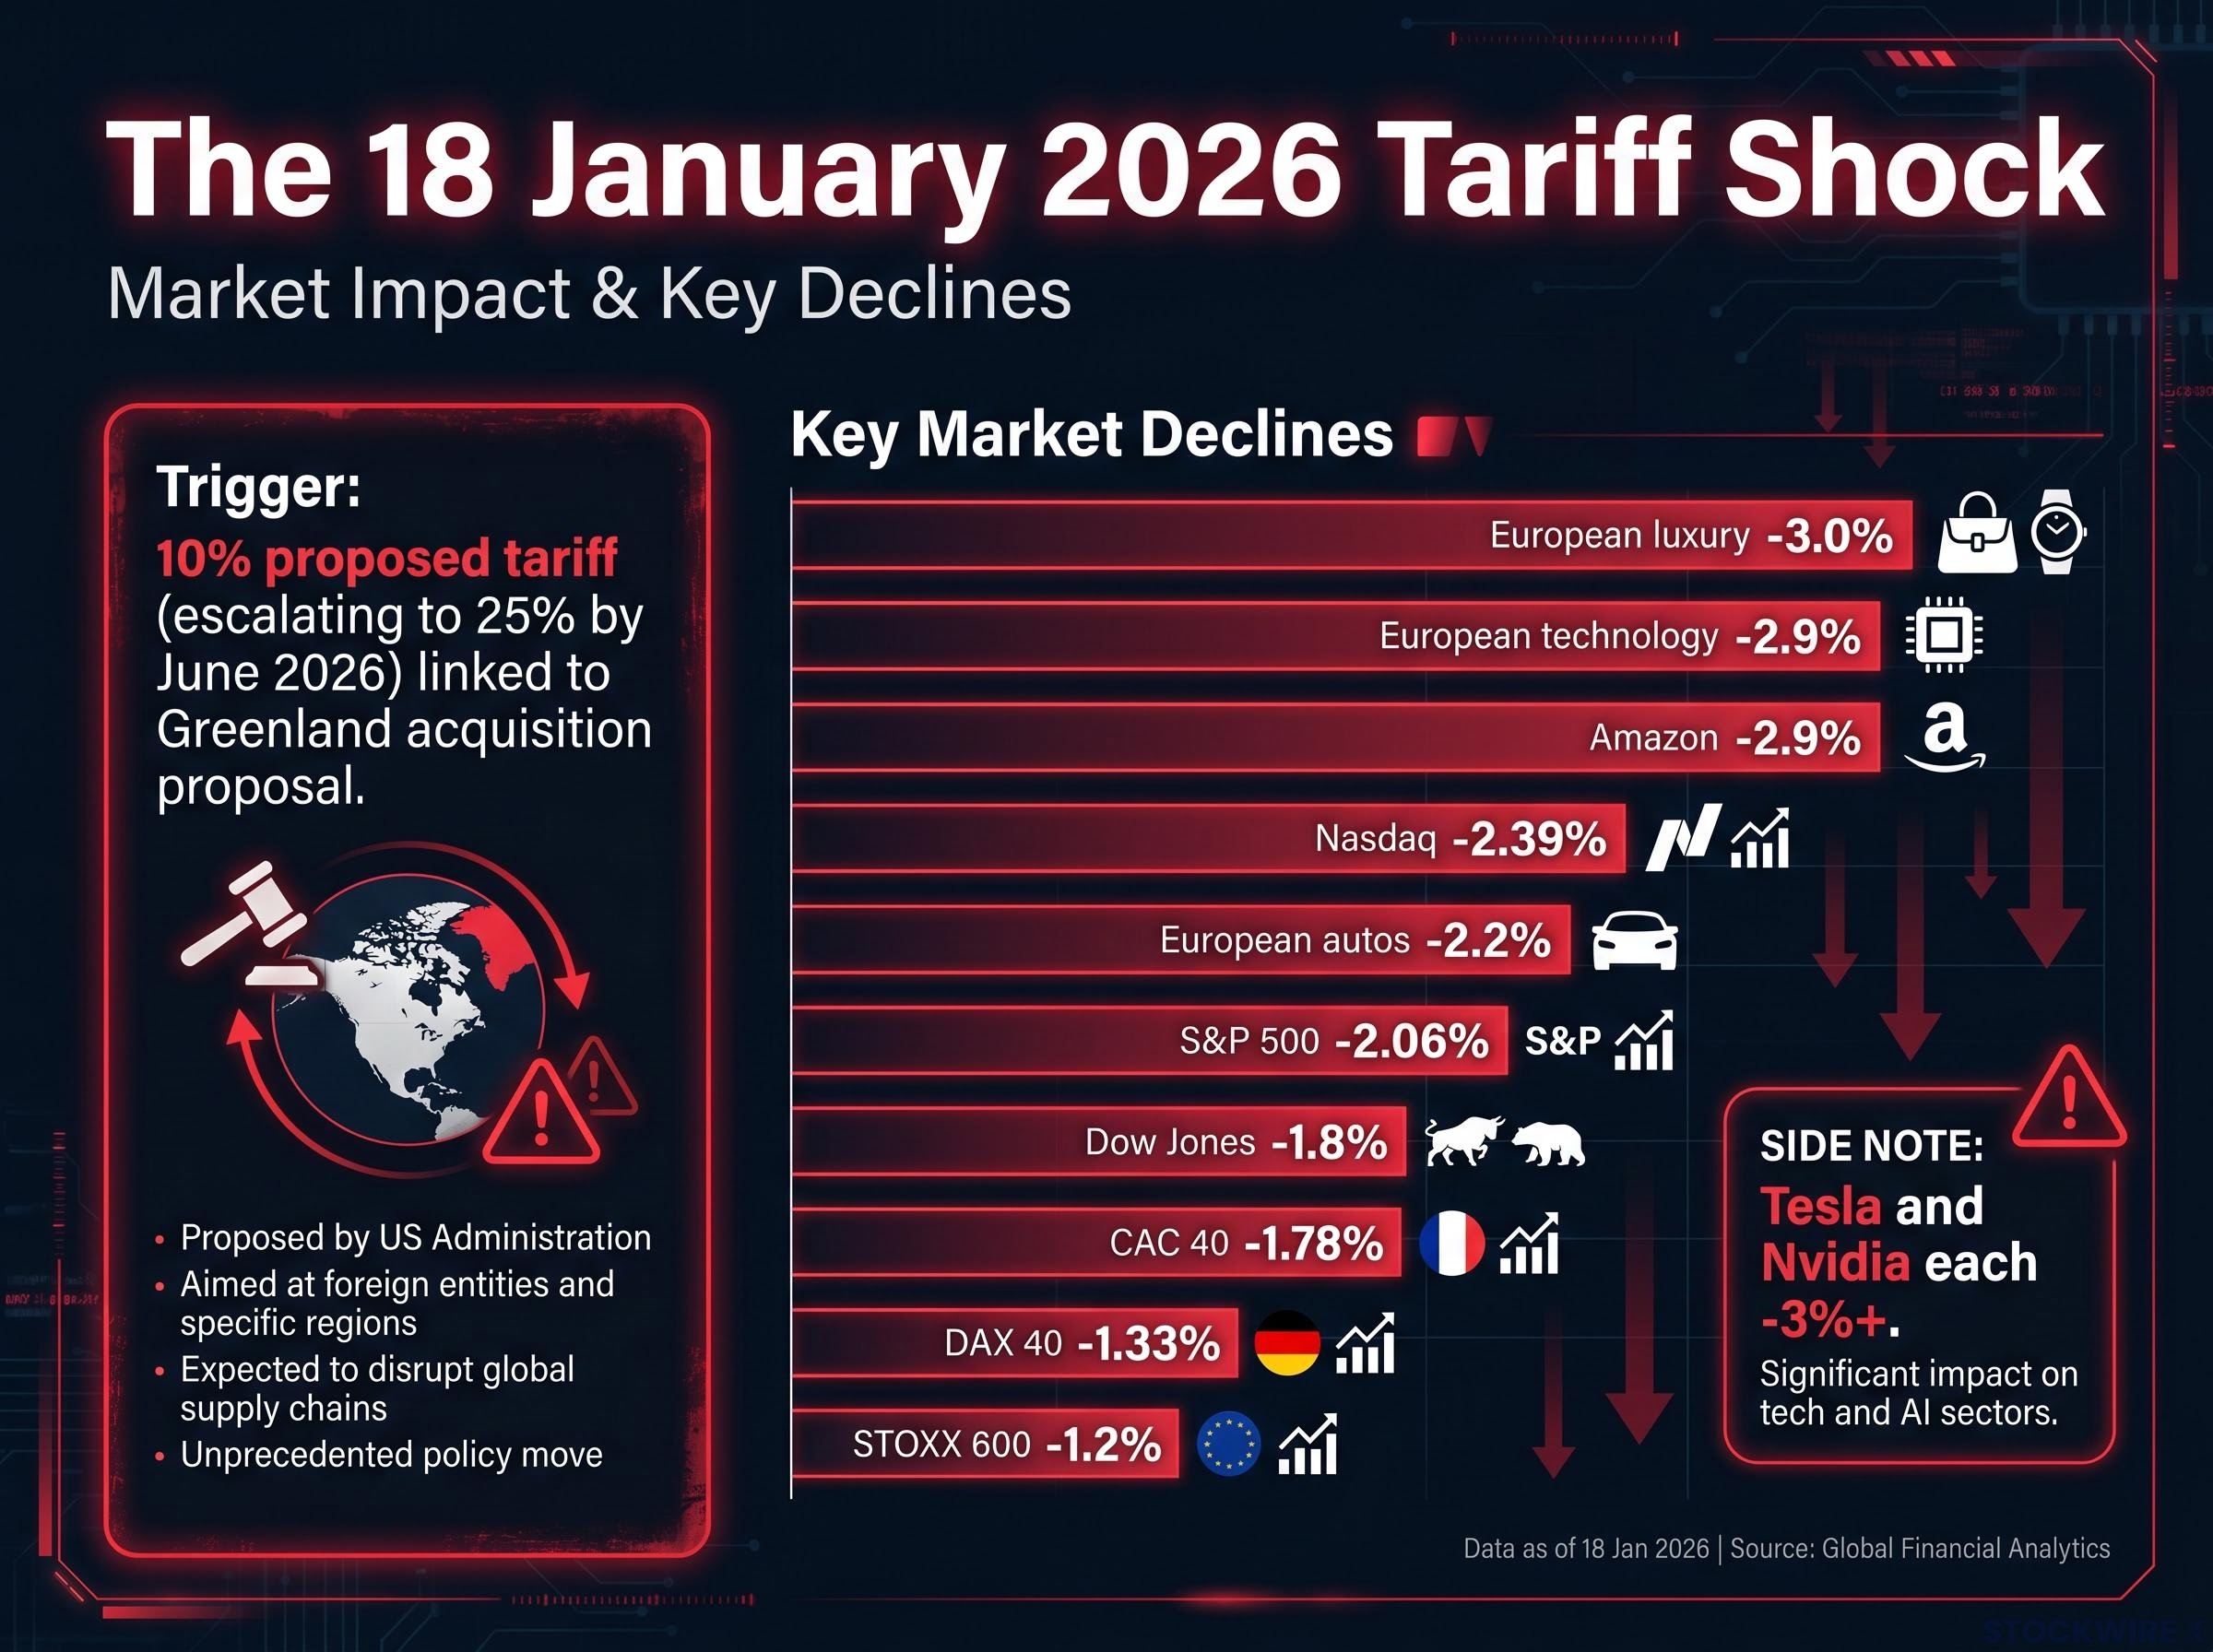
On 18 January 2026, the Trump administration announced potential tariffs targeting European nations that opposed the Greenland acquisition proposal. The proposed structure included an initial additional 10% import levy, with a further escalation to 25% scheduled for June 2026 if no agreement was reached. Markets responded within the session.
The sell-off was not indiscriminate. It followed a precise exposure map.
| Market / Sector | Move | Context |
|---|---|---|
| S&P 500 | -2.06% | Broad US risk-off; Amazon -2.9%, Tesla and Nvidia each -3%+ |
| Nasdaq | -2.39% | Tech-heavy index led US declines |
| Dow Jones | -1.8% | Least exposed of the three major US indices |
| STOXX 600 | -1.2% | Two-month low for pan-European benchmark |
| CAC 40 | -1.78% | France’s luxury sector concentration amplified losses |
| DAX 40 | -1.33% | Auto sector exposure drove German losses |
| European luxury | -3.0% | Highest sectoral decline; direct trade-flow exposure |
| European technology | -2.9% | Supply-chain and export sensitivity |
| European autos | -2.2% | Tariff-rate sensitivity on finished goods |
Luxury, technology, and automobiles fell hardest in Europe because they held the highest first-order trade-policy exposure: direct revenue dependence on cross-border sales that a tariff would immediately compress. The escalation timeline to 25% in June created a compounding layer of uncertainty on top of the initial levy, forcing investors to price not just the tariff itself but the probability distribution of its future escalation.
The precision of the sectoral response suggests that sophisticated market participants were already running exposure maps, not simply reacting to headline fear.
Policy-driven market risk originates in diplomatic and legislative decisions rather than in economic data cycles, and it arrives without the lead-time signals that macroeconomic releases typically provide. Several characteristics distinguish it from standard volatility:
The January-to-May sequence illustrates a counterintuitive dynamic. Every investor saw each headline at the same moment. What differed was whether they had pre-mapped the exposure chain needed to act on it quickly and accurately.
The gap between geopolitical risk and stock market behaviour is not a recent anomaly: markets consistently process diplomatic and military events as probability-adjusted inputs to future earnings rather than proportional headline shocks, which is why consensus forecasts have repeatedly overestimated equity damage from events that looked severe in real time.
Federal Reserve research on geopolitical risk establishes that elevated geopolitical risk indices consistently foreshadow lower investment, higher disaster probability, and larger downside variance in asset prices, the same dynamics visible in the January-to-May sequence where policy headlines compressed risk premiums faster than trailing volatility models could track.
Synchronous information, asynchronous interpretation: the headline is simultaneous; the exposure map is not. That asymmetry is the entire game.
Reactive positioning after sharp policy-driven moves captures residual drift at best, given the speed of initial repricing across all three events. The advantage belonged to participants who had identified which sectors and geographies held first-order exposure before the announcement arrived.
On 8 April 2026, a Pakistan-mediated ceasefire between the United States and Iran was announced, suspending hostilities and reopening the Strait of Hormuz. The relief rally that followed was immediate, broad, and geographically uneven.
| Region | Index | Move | Note |
|---|---|---|---|
| Asia-Pacific | KOSPI | +6.87% | Semiconductor and construction stocks led |
| Asia-Pacific | KOSDAQ | +5.12% | Broader Korean tech rally |
| Asia-Pacific | Nikkei 225 | +5.39% | Japanese equities tracked Korean strength |
| Europe | STOXX 600 | +3.7% | Travel and industrial sectors led |
| Europe | DAX 40 | +4.7% | German industrials outperformed |
| United States | S&P 500 | +2.5% | Energy equities declined on the same session |
| United States | Dow Jones | +2.7% | Broad-based gains |
South Korea’s KOSPI gained roughly 2.75 times the S&P 500’s move. Northeast Asian markets amplified the relief rally because of their concentrated supply-chain centrality and commodity-import sensitivity: South Korean semiconductor manufacturers and Japanese industrial exporters were disproportionately exposed to the Hormuz disruption through energy input costs and shipping route dependencies.
The Iran conflict stock market repricing that preceded the April ceasefire involved a historically rare five-week consecutive S&P 500 decline driven by the Hormuz closure and a 43% Brent crude surge, context that clarifies why the relief rally magnitude on 8 April was as large as it was and why the re-entry timing problem for mechanically de-risked portfolios was so acute.
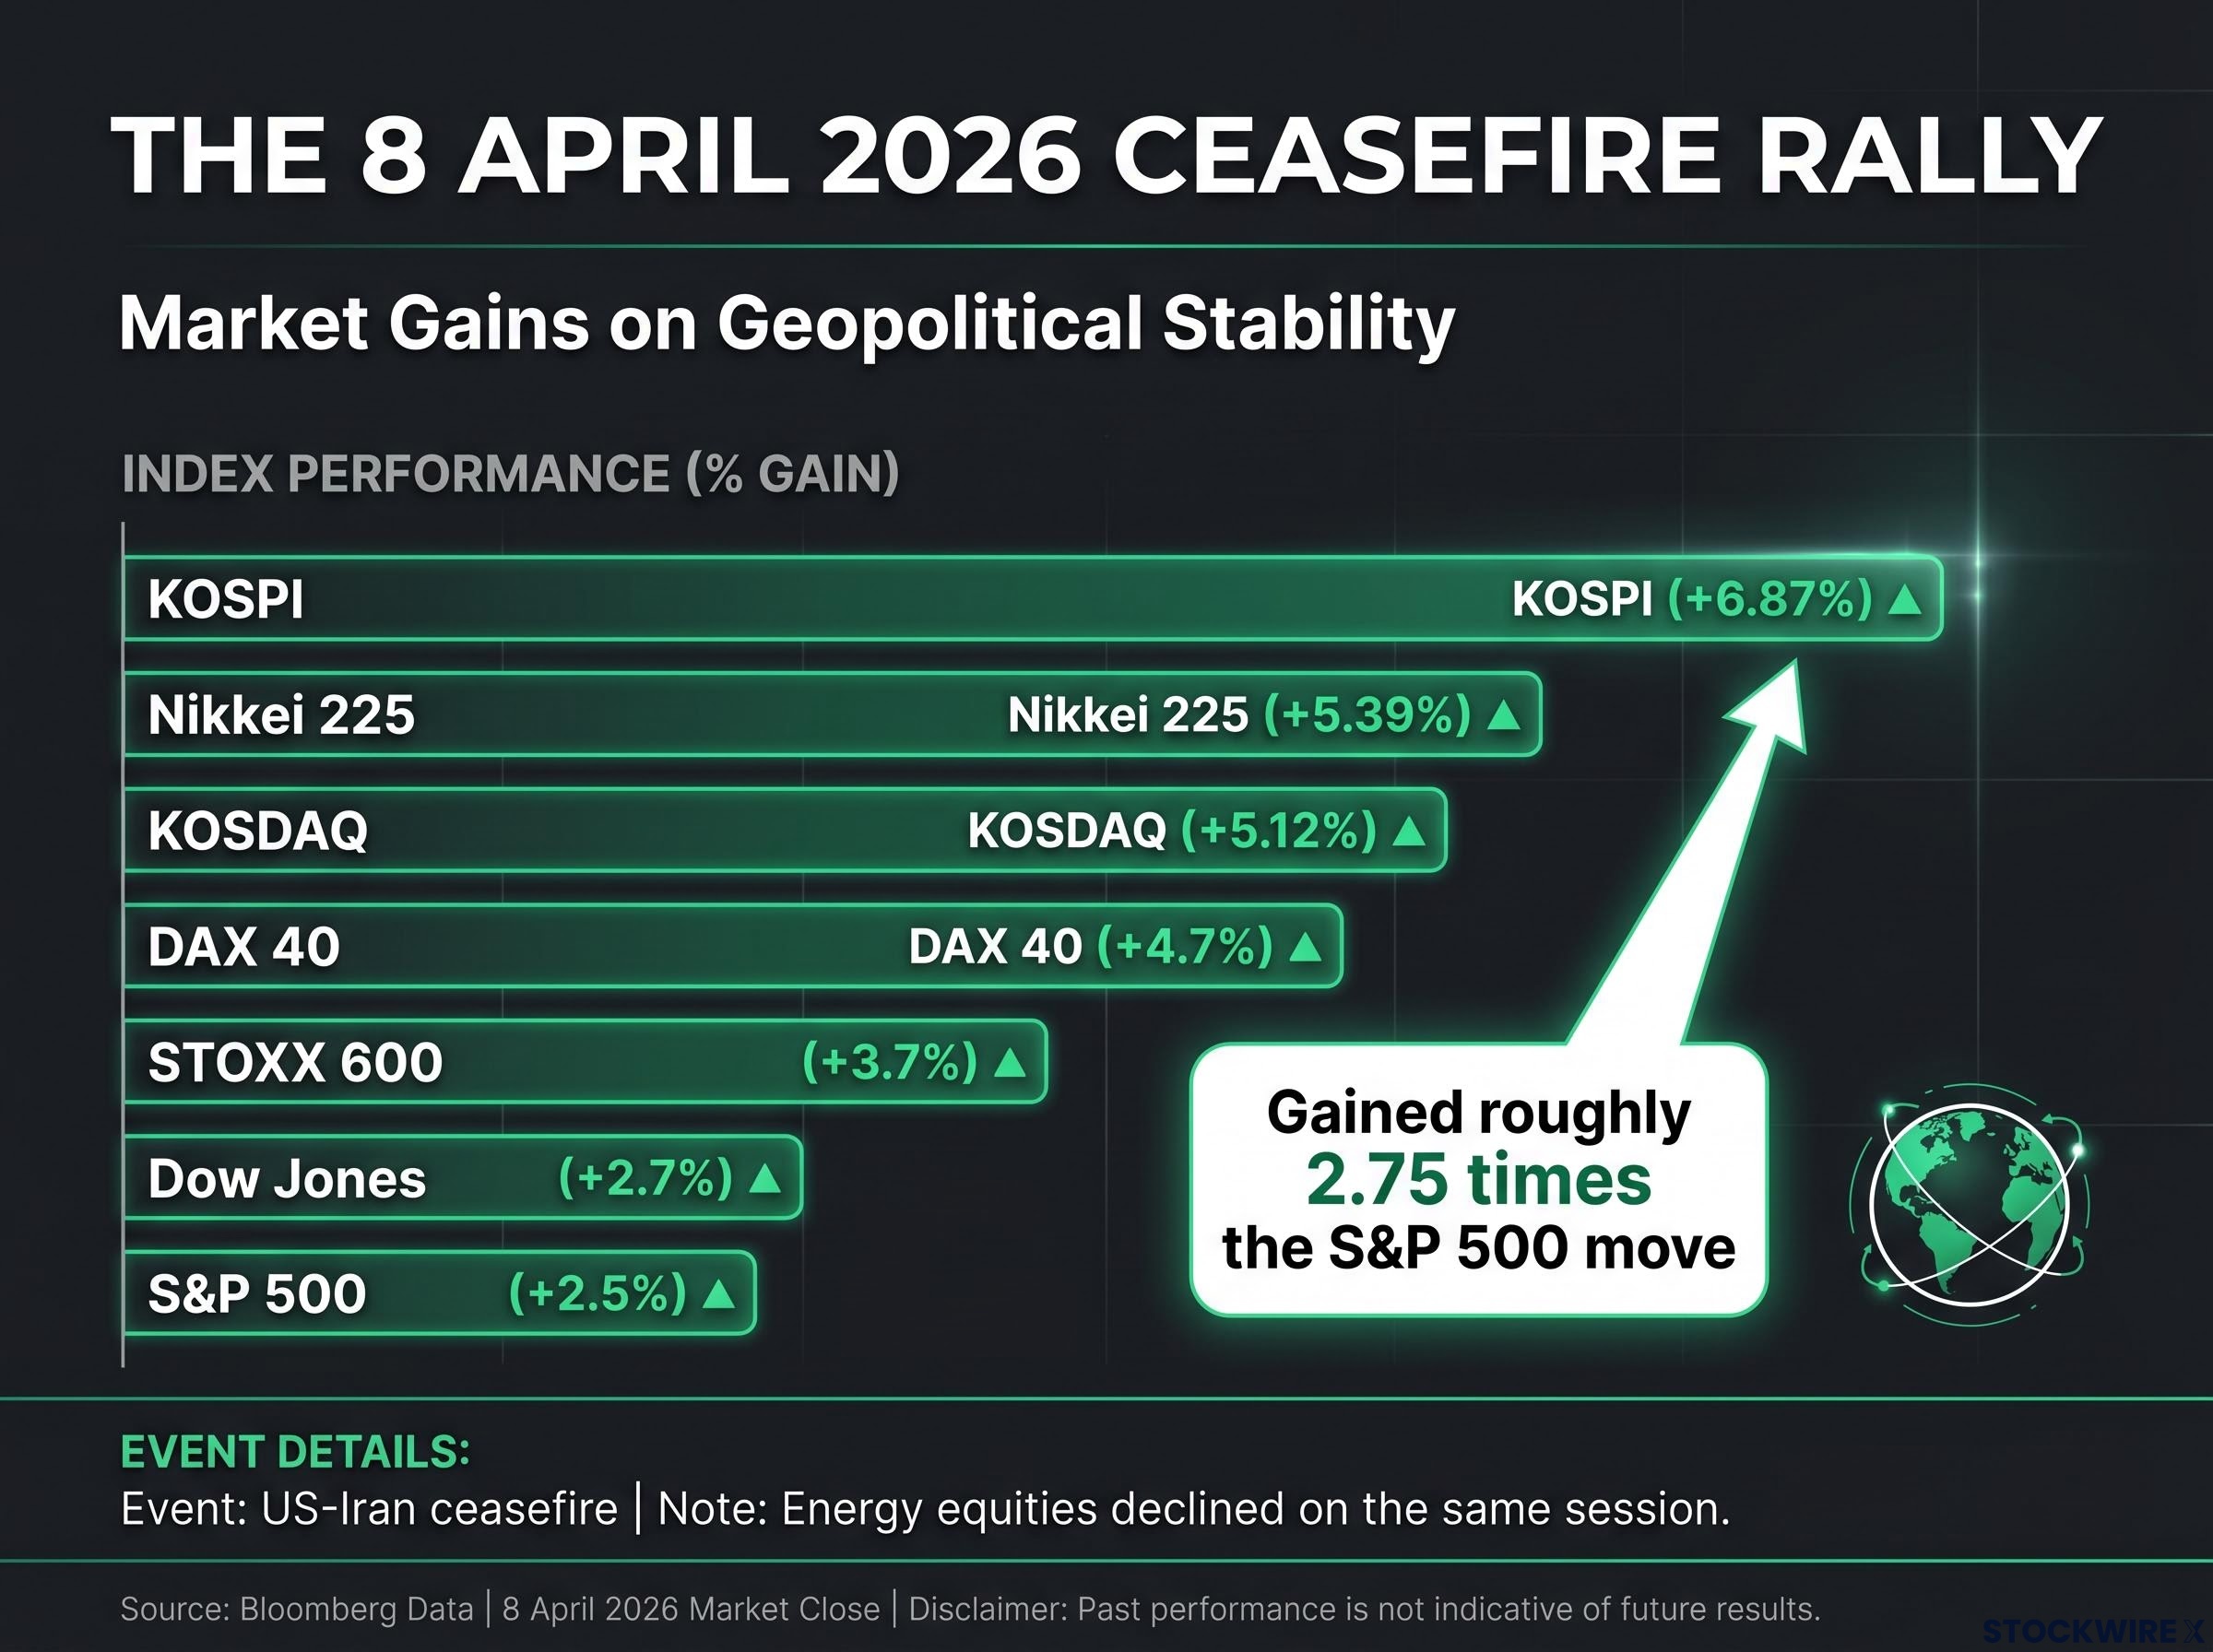
Energy equities declined on the same session as the broad rally. The Hormuz reopening released the geopolitical commodity premium that had been embedded in oil prices, compressing energy equity valuations at the same moment that industrial and travel stocks advanced on lower input-cost expectations.
This is a structurally important observation: relief rallies are not uniform. They rotate through sectors and geographies in patterns that mirror how the original risk was distributed. Investors who held undifferentiated long exposure captured less of the move than those who had mapped the exposure chain in advance.
The ceasefire was explicitly temporary, a two-week suspension of hostilities. The US-China summit on 14-15 May 2026 produced no binding trade commitments. Both events eased near-term uncertainty. Neither removed the underlying constraint.
This pattern produces a distinction that carries predictive weight:
Stabilisation caps downside; resolution removes it. The distinction determines whether the rally persists.
The summit data confirms how markets have learned to calibrate between the two. The S&P 500 gained 0.8% and the Nasdaq added 0.9% on 15 May, while the Shanghai Composite fell 1.5% and the CSI 300 declined 1.7%. The Dow Jones crossed 50,000 for the first time since the Iran conflict began, though this milestone reflected an AI-driven underlying bid (led by Nvidia and Cisco) that provided a floor independent of the geopolitical narrative.
The contrast in magnitude tells the story: the summit’s 0.8-0.9% US gain against the ceasefire’s 2.5-6.87% range reflects a market that had already learned to discount stabilisation events accordingly. Investors who conflate the two risk re-entering or holding at levels that assume a constraint has been removed when it has merely been suspended.
The 15 May summit produced the most analytically striking geographic divergence: US equities gained while Chinese equities fell on the same day in response to the same diplomatic event. The interpretive asymmetry reflected differing assessments of which side held negotiating leverage and which side would bear the near-term adjustment costs.
This was not an anomaly. Asymmetric geographic responses were the rule across all three events:
The geography of market sensitivity tracks the geography of trade-flow exposure and negotiating leverage. Identifying which regions hold the highest first-order exposure to a specific policy constraint, whether tariff, conflict, or bilateral negotiation, before the event allows investors to rotate between regions rather than holding undifferentiated global equity exposure through a policy-driven regime.
International equity outperformance in 2026 has been the structural consequence of exactly the geographic exposure asymmetries the three-event sequence illustrates: South Korea and Taiwan posted year-to-date gains of approximately 87% and 52% respectively by late May 2026, driven by the same AI semiconductor demand that amplified the ceasefire rally, while Europe’s energy-import sensitivity created a distinct rotation opportunity tied to oil price normalisation.
The three-event pattern converts into four diagnostic questions that structure the exposure assessment when the next policy headline arrives:
Pre-positioning around identifiable policy risk nodes extracts more value than reactive repositioning after the announcement. The sharp moves across all three events were largely complete within the trading session. Pre-positioning carries its own risk when an event does not materialise or produces an unexpected outcome; the use of options to maintain upside participation without directional commitment is one structural response to that constraint.
Sector and regional considerations distilled from the three case studies:
VaR models calibrated to trailing realised volatility will systematically understate risk heading into policy events. Options-implied volatility provides a better real-time calibration of the embedded risk premium. The STOXX 600 went from a two-month low in January to a 3.7% single-session gain in April, illustrating the re-entry timing problem for investors who reduced risk mechanically into the sell-off.
The January-to-May sequence is not an anomaly. It is a signal of a structural shift in the primary driver of market variance. In a period of elevated geopolitical tension and active trade negotiation, diplomatic developments are doing the work that economic data releases once did.
Standard risk models built for data-driven regimes will continue to underestimate policy-driven variance until they are recalibrated. That gap between model output and actual risk is itself a source of portfolio vulnerability. MUFG Research assessed the US-China summit as a tension-management exercise rather than a resolution, corroborating the conclusion that markets were right to calibrate their response accordingly.
Diplomacy has become the new economic data: the structurally significant driver of market variance in the current regime, not a periodic disruption to an otherwise data-driven market.
The stabilisation-versus-resolution distinction and the synchronous information, asynchronous interpretation concept are durable tools, applicable to any future policy-driven market event, not only those in the 2026 sequence. Investors who hold these frameworks approach the next headline with a structured assessment process rather than a reactive one. That structural advantage compounds.
For investors wanting to extend the exposure-mapping logic into a systematic portfolio construction framework, our deep-dive into geopolitical fragmentation as a portfolio risk examines how the structural divergence of regional blocs, each with distinct industrial policies, tariff regimes, and supply-chain affiliations, requires monitoring revenue geography and jurisdictional risk rather than relying on country and sector labels alone.
This article is for informational purposes only and should not be considered financial advice. Investors should conduct their own research and consult with financial professionals before making investment decisions. Past performance does not guarantee future results, and forward-looking assessments of policy-driven market events are inherently subject to change based on diplomatic developments and market conditions.
Policy-driven market risk originates in government or diplomatic decisions rather than economic data cycles, and it arrives without the lead-time signals that macroeconomic releases typically provide. Initial repricing is largely complete within a single trading session, and VaR models calibrated to trailing realised volatility systematically underestimate this type of variance.
South Korean semiconductor manufacturers and Japanese industrial exporters held concentrated exposure to the Strait of Hormuz disruption through energy input costs and shipping route dependencies, so the relief rally amplified their gains disproportionately. The KOSPI gained 6.87% against the S&P 500's 2.5%, a factor of roughly 2.75 times, reflecting that geographic sensitivity tracks the geography of trade-flow exposure.
A stabilisation event caps downside and reduces immediate uncertainty but leaves the underlying constraint in place, producing sharp but potentially short-lived market repricing. A resolution event materially removes the constraint and produces durable directional moves; the clearest marker separating the two is the absence of binding agreements.
The framework asks whether the event is binary or a process, whether the outcome is temporary or structural, which sectors and regions hold first-order exposure, and what the market's current positioning is. Answering these questions before acting on a headline allows investors to rotate into the highest-exposure areas rather than chasing residual drift after the initial repricing is complete.
The Hormuz reopening released the geopolitical commodity premium embedded in oil prices, compressing energy equity valuations at the same moment that industrial and travel stocks advanced on lower input-cost expectations. This confirms that relief rallies rotate through sectors in patterns that mirror how the original risk was distributed, not uniformly across the market.