

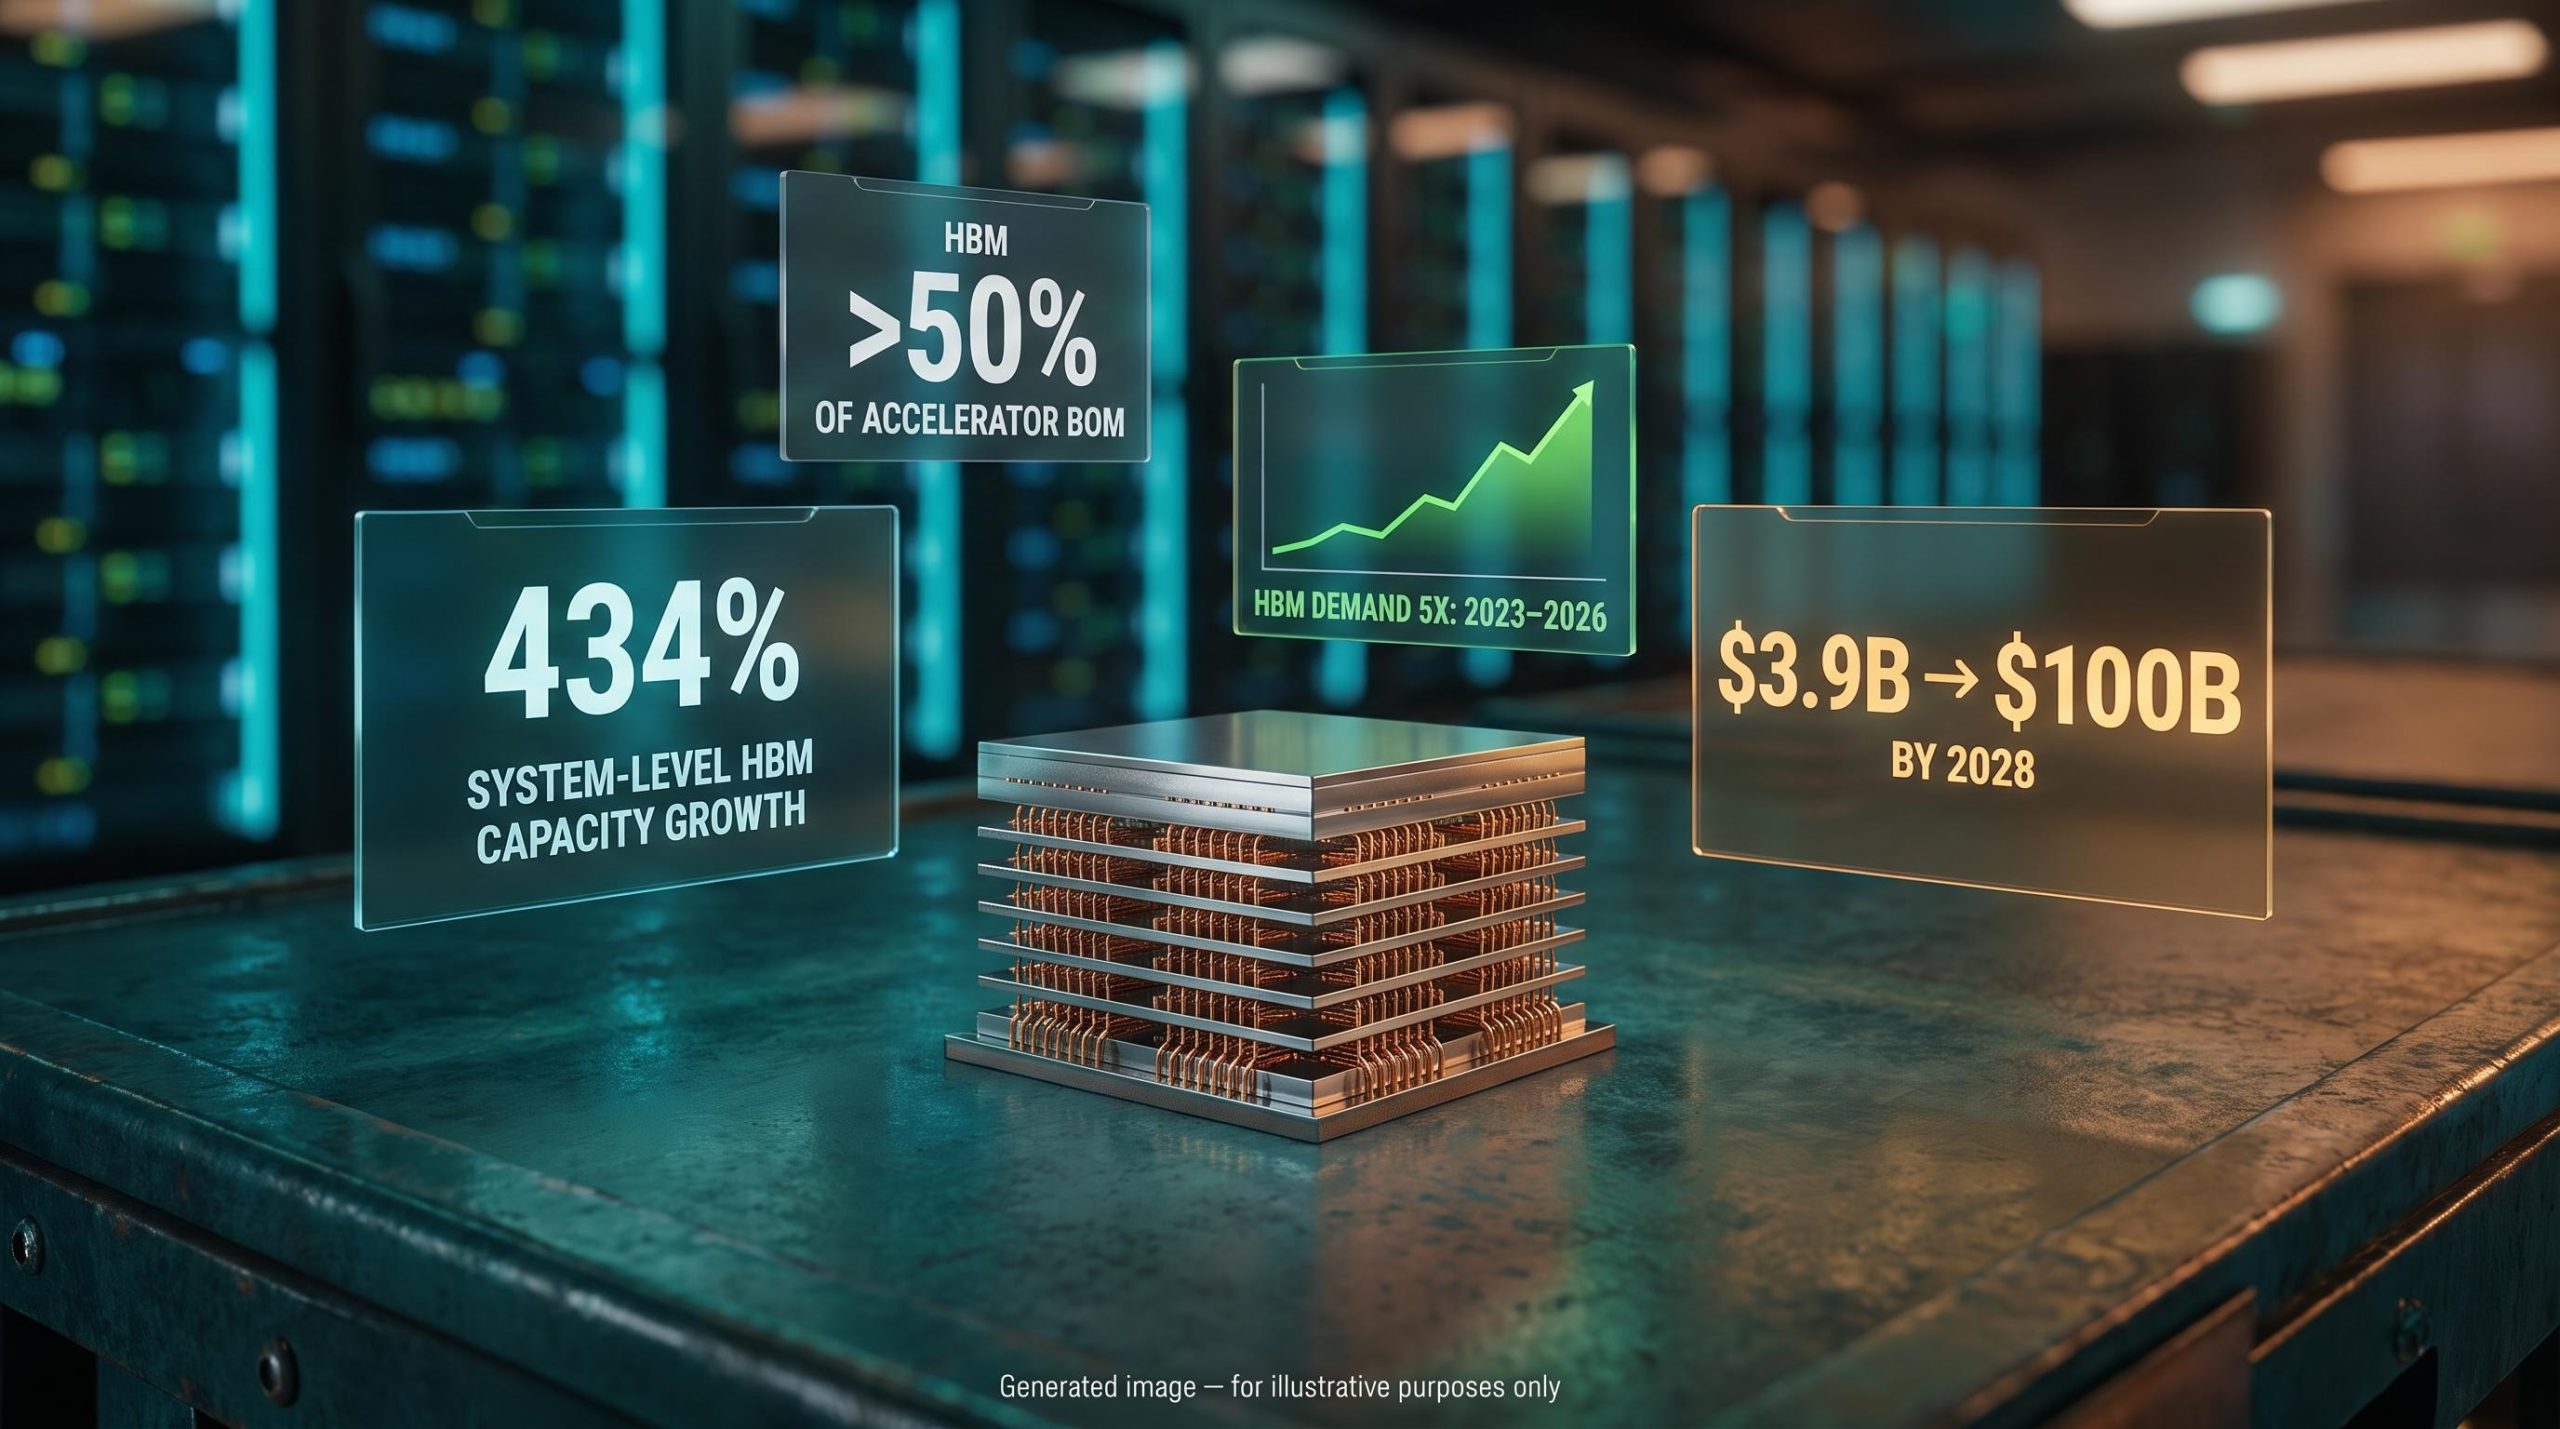
Citi projects that total system-level High Bandwidth Memory (HBM) capacity will grow by 434% across the next generation of AI infrastructure, even as individual chips may carry less memory per unit. That number sounds like it contradicts itself. It does not, and the resolution of that apparent paradox is where the investment signal sits.
AI infrastructure is at an architectural inflection point. The direction of the shift, whether hyperscalers concentrate capability in fewer powerful chips or distribute it across hundreds of smaller ones, has direct, quantifiable consequences for HBM demand. Both paths lead to dramatically more memory. The question for investors is how much more, and who captures the value.
Here is what the data tells you about where HBM demand is heading, what the GPU roadmap confirms that Citi’s model understates, and why SK Hynix‘s anticipated capital return announcement could serve as the near-term catalyst that closes the gap between the structural thesis and the current share price.
The scale-up versus scale-out divide, and why it matters now
Two competing deployment philosophies are shaping AI infrastructure, and each one carries different memory implications at the chip level but converges at the system level.
Scale-up architecture concentrates AI capability in fewer, more powerful GPUs, each carrying large amounts of HBM. Scale-out architecture distributes workloads across a larger number of GPUs, each with lower HBM per unit but far more chips per system. The distinction matters because the unit of measurement you focus on, per-chip or per-system, determines whether HBM demand looks flat or explosive.
- Scale-up: Fewer GPUs per system, high HBM per GPU, optimised for single-model performance
- Scale-out: More GPUs per system, lower HBM per GPU, optimised for parallel workload distribution
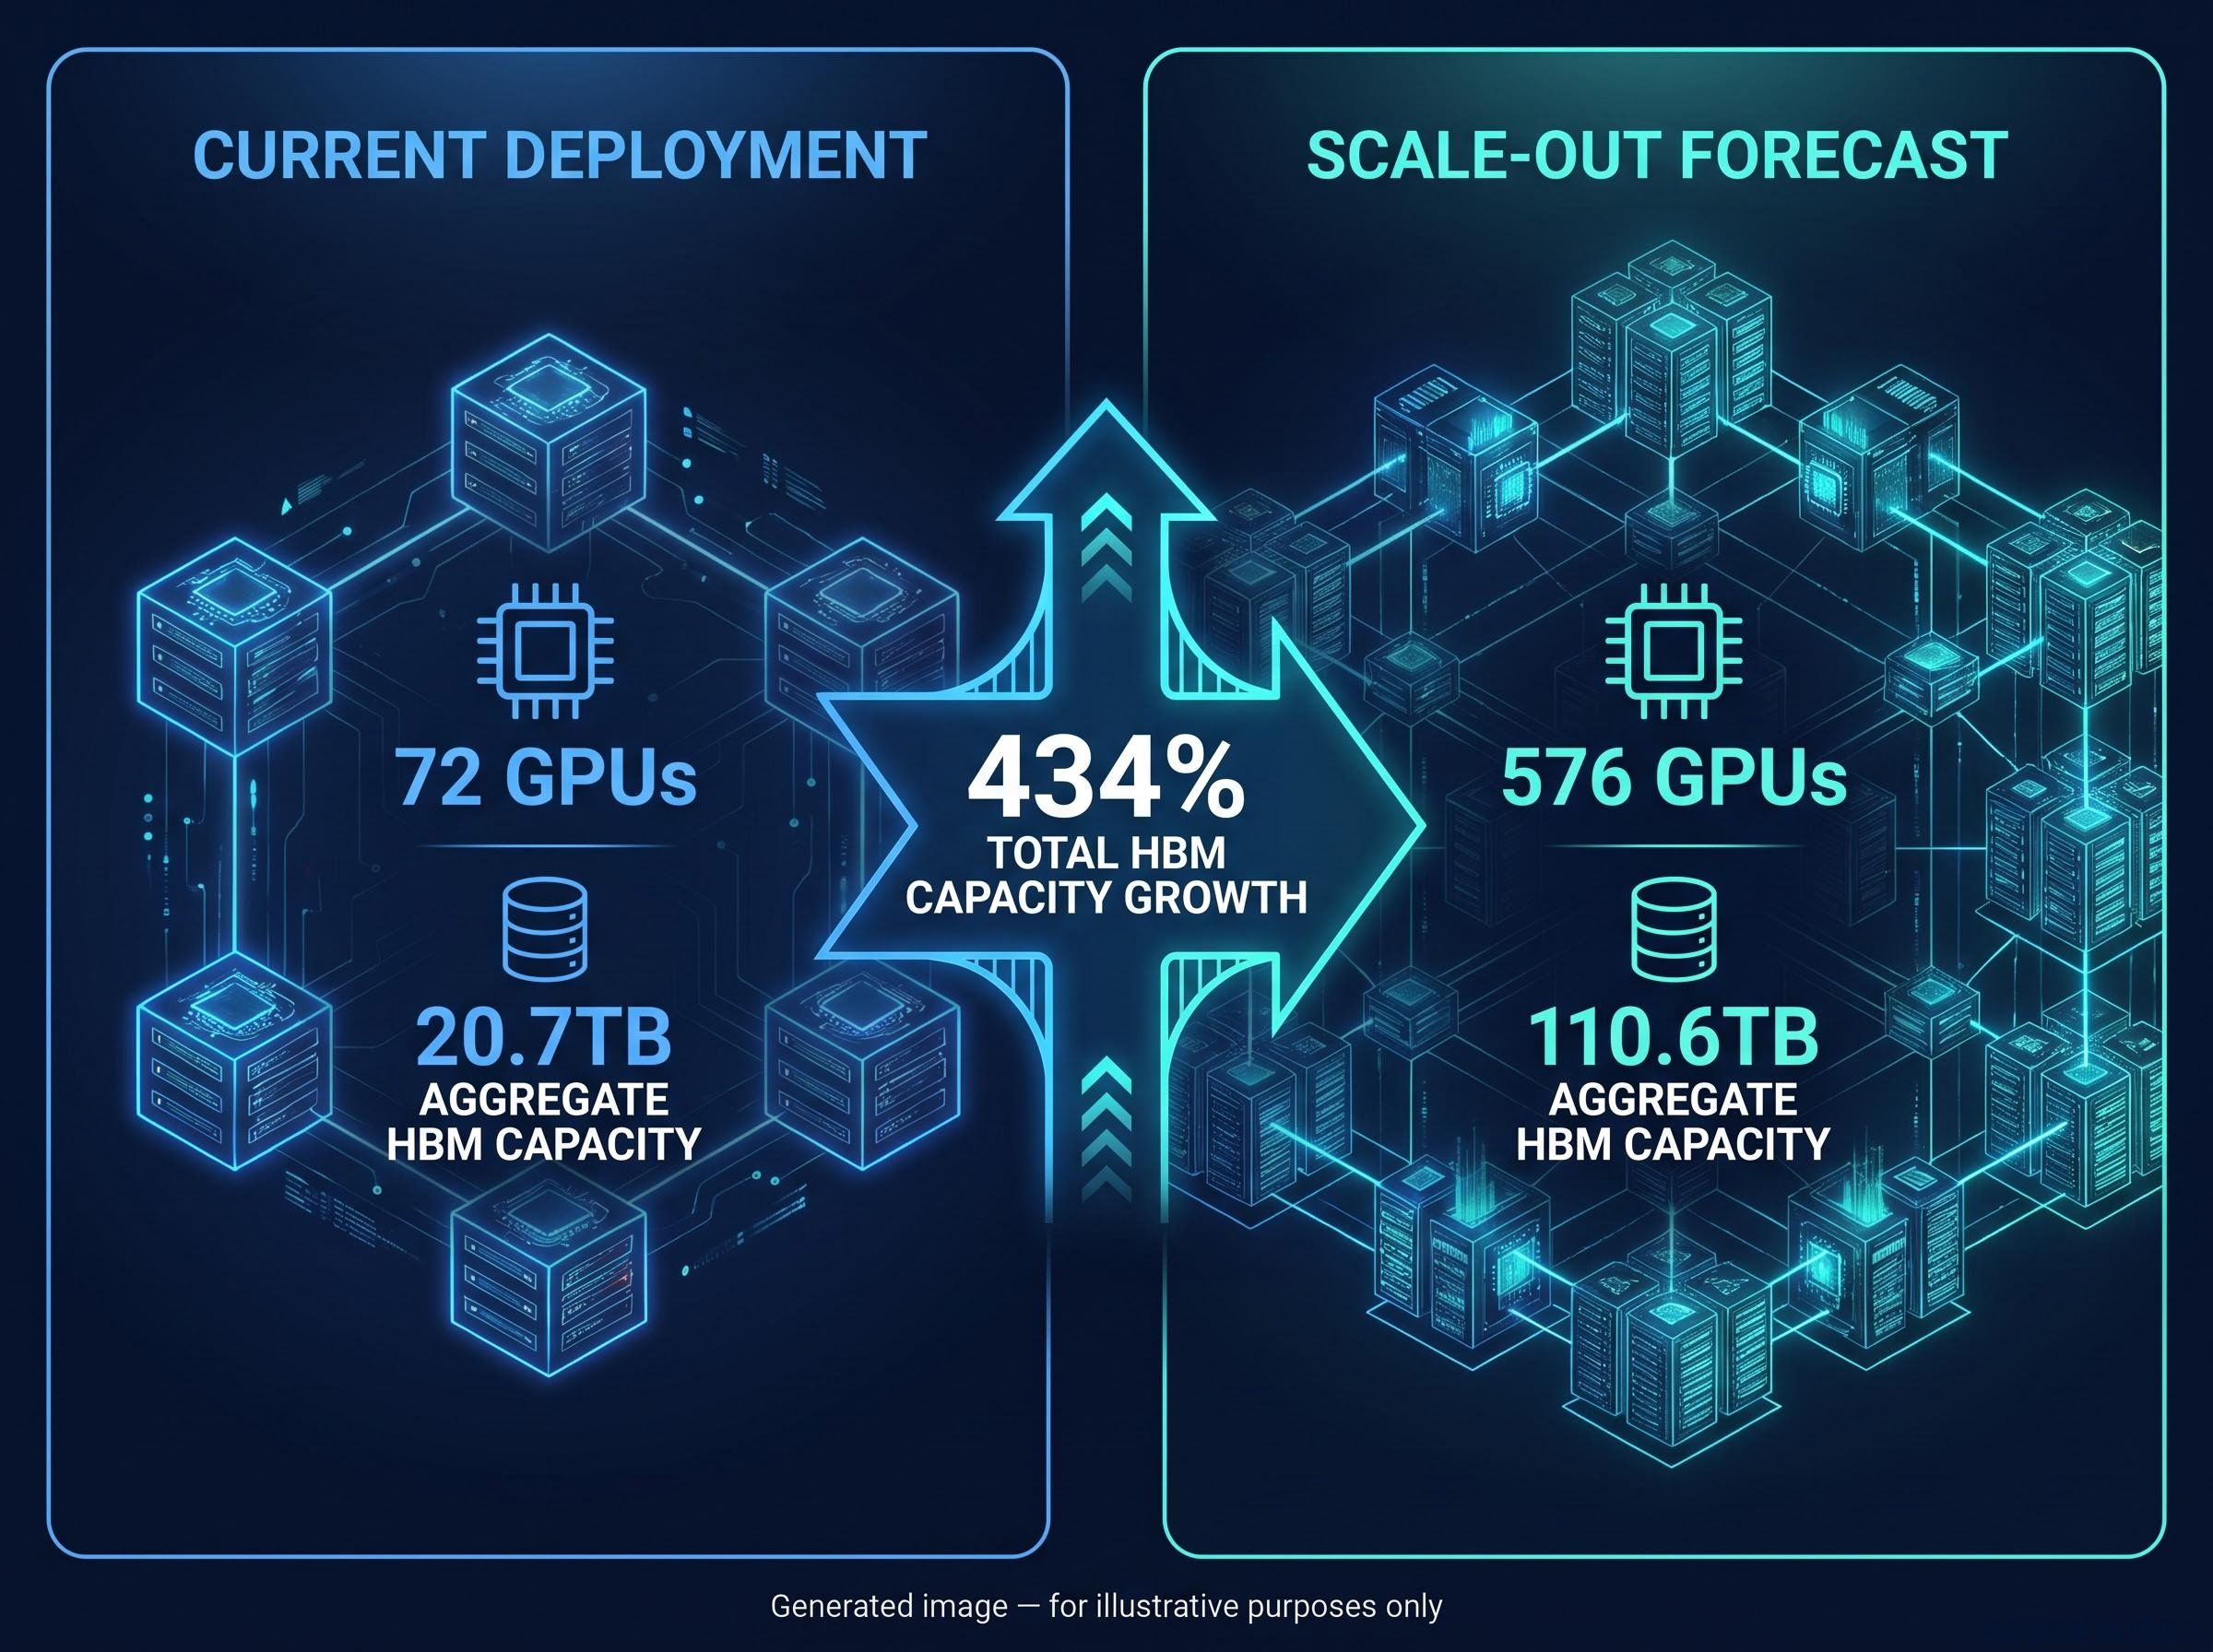
Citi’s strategists modelled the scale-out scenario. Under their framework, the number of GPUs deployed per AI system rises from 72 to 576, driving aggregate system-level HBM capacity from 20.7TB up to 110.6TB.
The aggregate result: a 434% rise in total HBM capacity per system, with that growth materialising at the system level even as individual GPU memory content falls under the scale-out deployment model.
This is a theoretical framework proposed by Citi, not a confirmed industry outcome. But the directional conclusion is what matters for capital allocation. Whether architects choose scale-up or scale-out, the total memory requirement per system expands dramatically. The 434% figure tells you that the demand growth story is not contingent on any single GPU generation winning the architectural debate. Total system memory requirements expand under either path, and that structural signal is the one worth holding.
When big ASX news breaks, our subscribers know first
What GPU roadmaps actually show about HBM per chip
The Citi thesis assumes per-GPU HBM content declines as systems scale out. The observed hardware progression tells a different story.
| GPU Generation | HBM Type | HBM Capacity |
|---|---|---|
| NVIDIA H100 | HBM3 | 80GB |
| NVIDIA Blackwell B200 | HBM3e | 192GB |
| NVIDIA Rubin (upcoming) | HBM4 | 288GB |
From H100 to Rubin, per-GPU HBM capacity increases 3.6x. That is growth of more than 40% annually, a consistent upward trajectory across every generation released or announced to date.
The pattern is unambiguous. Each GPU generation carries substantially more HBM, not less. And the underlying driver is a structural one: memory bandwidth grows approximately 2x per generation while compute power grows 5-10x, forcing architects to compensate with more memory at every level of the stack.
Reconciling the Citi forecast with hardware reality
The divergence between Citi’s mechanism and observed GPU specifications is not a reason to dismiss the demand thesis. It is a reason to be more constructive.
Citi’s 434% system-level projection and the observed per-GPU HBM increases are additive demand drivers, not competing claims. Per-chip HBM is rising. GPU counts per system are also rising. Both vectors push total HBM demand higher simultaneously, meaning forecasts built on only one dimension are likely conservative. For investors, this reconciliation point is the most analytically useful takeaway: aggregate HBM demand is expanding from both directions at once, and the Citi model, which only captured one, may understate the destination.
The memory wall that no GPU generation has solved
The memory wall is the structural constraint that makes HBM demand durable rather than cyclical.
Every GPU generation delivers a step-change in raw compute. But memory bandwidth, the rate at which data moves between the processor and its memory, scales far more slowly. Compute grows 5-10x per generation. Bandwidth grows approximately 2x. That widening gap is the memory wall, and it forces system architects into a costly workaround: deploying more GPUs, each carrying more memory, to keep the processing pipeline fed with data.
The relationship between memory and AI performance is direct. Token throughput, the speed at which an AI model processes language, equals HBM size multiplied by HBM bandwidth. Both dimensions must scale together. Neither can be substituted away by software optimisation or alternative memory types in the near to medium term.
Three compounding forces drive HBM demand from this constraint:
- The compute-bandwidth gap widens with every GPU generation, requiring more memory per chip and per system
- Token throughput depends on both HBM capacity and bandwidth scaling in parallel
- HBM now accounts for more than 50% of the AI accelerator bill of materials (BOM), the component cost breakdown for building each chip package
HBM exceeds 50% of the accelerator bill of materials. It is the single most capital-intensive chokepoint in the AI server stack.
The memory wall is the reason HBM demand is a structural growth story rather than a cycle tied to any single product launch. Persistent bandwidth scarcity acts as a durable pricing and volume tailwind for producers who can deliver capacity.
Supply is expanding, but the deficit is structural
HBM demand has grown 5x between 2023 and 2026. Supply expands at 50-60% annually. Manufacturers have described this as the most prolonged shortage in the industry’s history, and the production economics explain why the gap persists despite strong price signals and clear producer incentive to expand.
The constraint sits in the wafer. Each gigabyte of HBM requires 3-4x the wafer capacity of standard DRAM. Micron has confirmed a 3-to-1 conversion ratio between HBM and DDR5 production. That wafer intensity means no producer can flood the market with HBM without simultaneously cutting standard DRAM revenue, creating a natural ceiling on how fast the supply gap closes.
DRAM supply constraints extend well beyond the current GPU generation cycle, with SK Hynix projecting tightness through 2030 and HBM inventory sitting at just 3-4 weeks industry-wide, a structural scarcity that capital expenditure alone cannot resolve on any near-term timeline.
| Metric | HBM | Standard DRAM |
|---|---|---|
| Wafer capacity per GB | 3-4x standard DRAM | 1x (baseline) |
| Annual demand growth | 5x (2023-2026) | Moderate single-digit |
| Supply-demand balance | Structural deficit | Broadly balanced |
| Primary application | AI accelerators (55%+ of demand) | Consumer, enterprise, mobile |
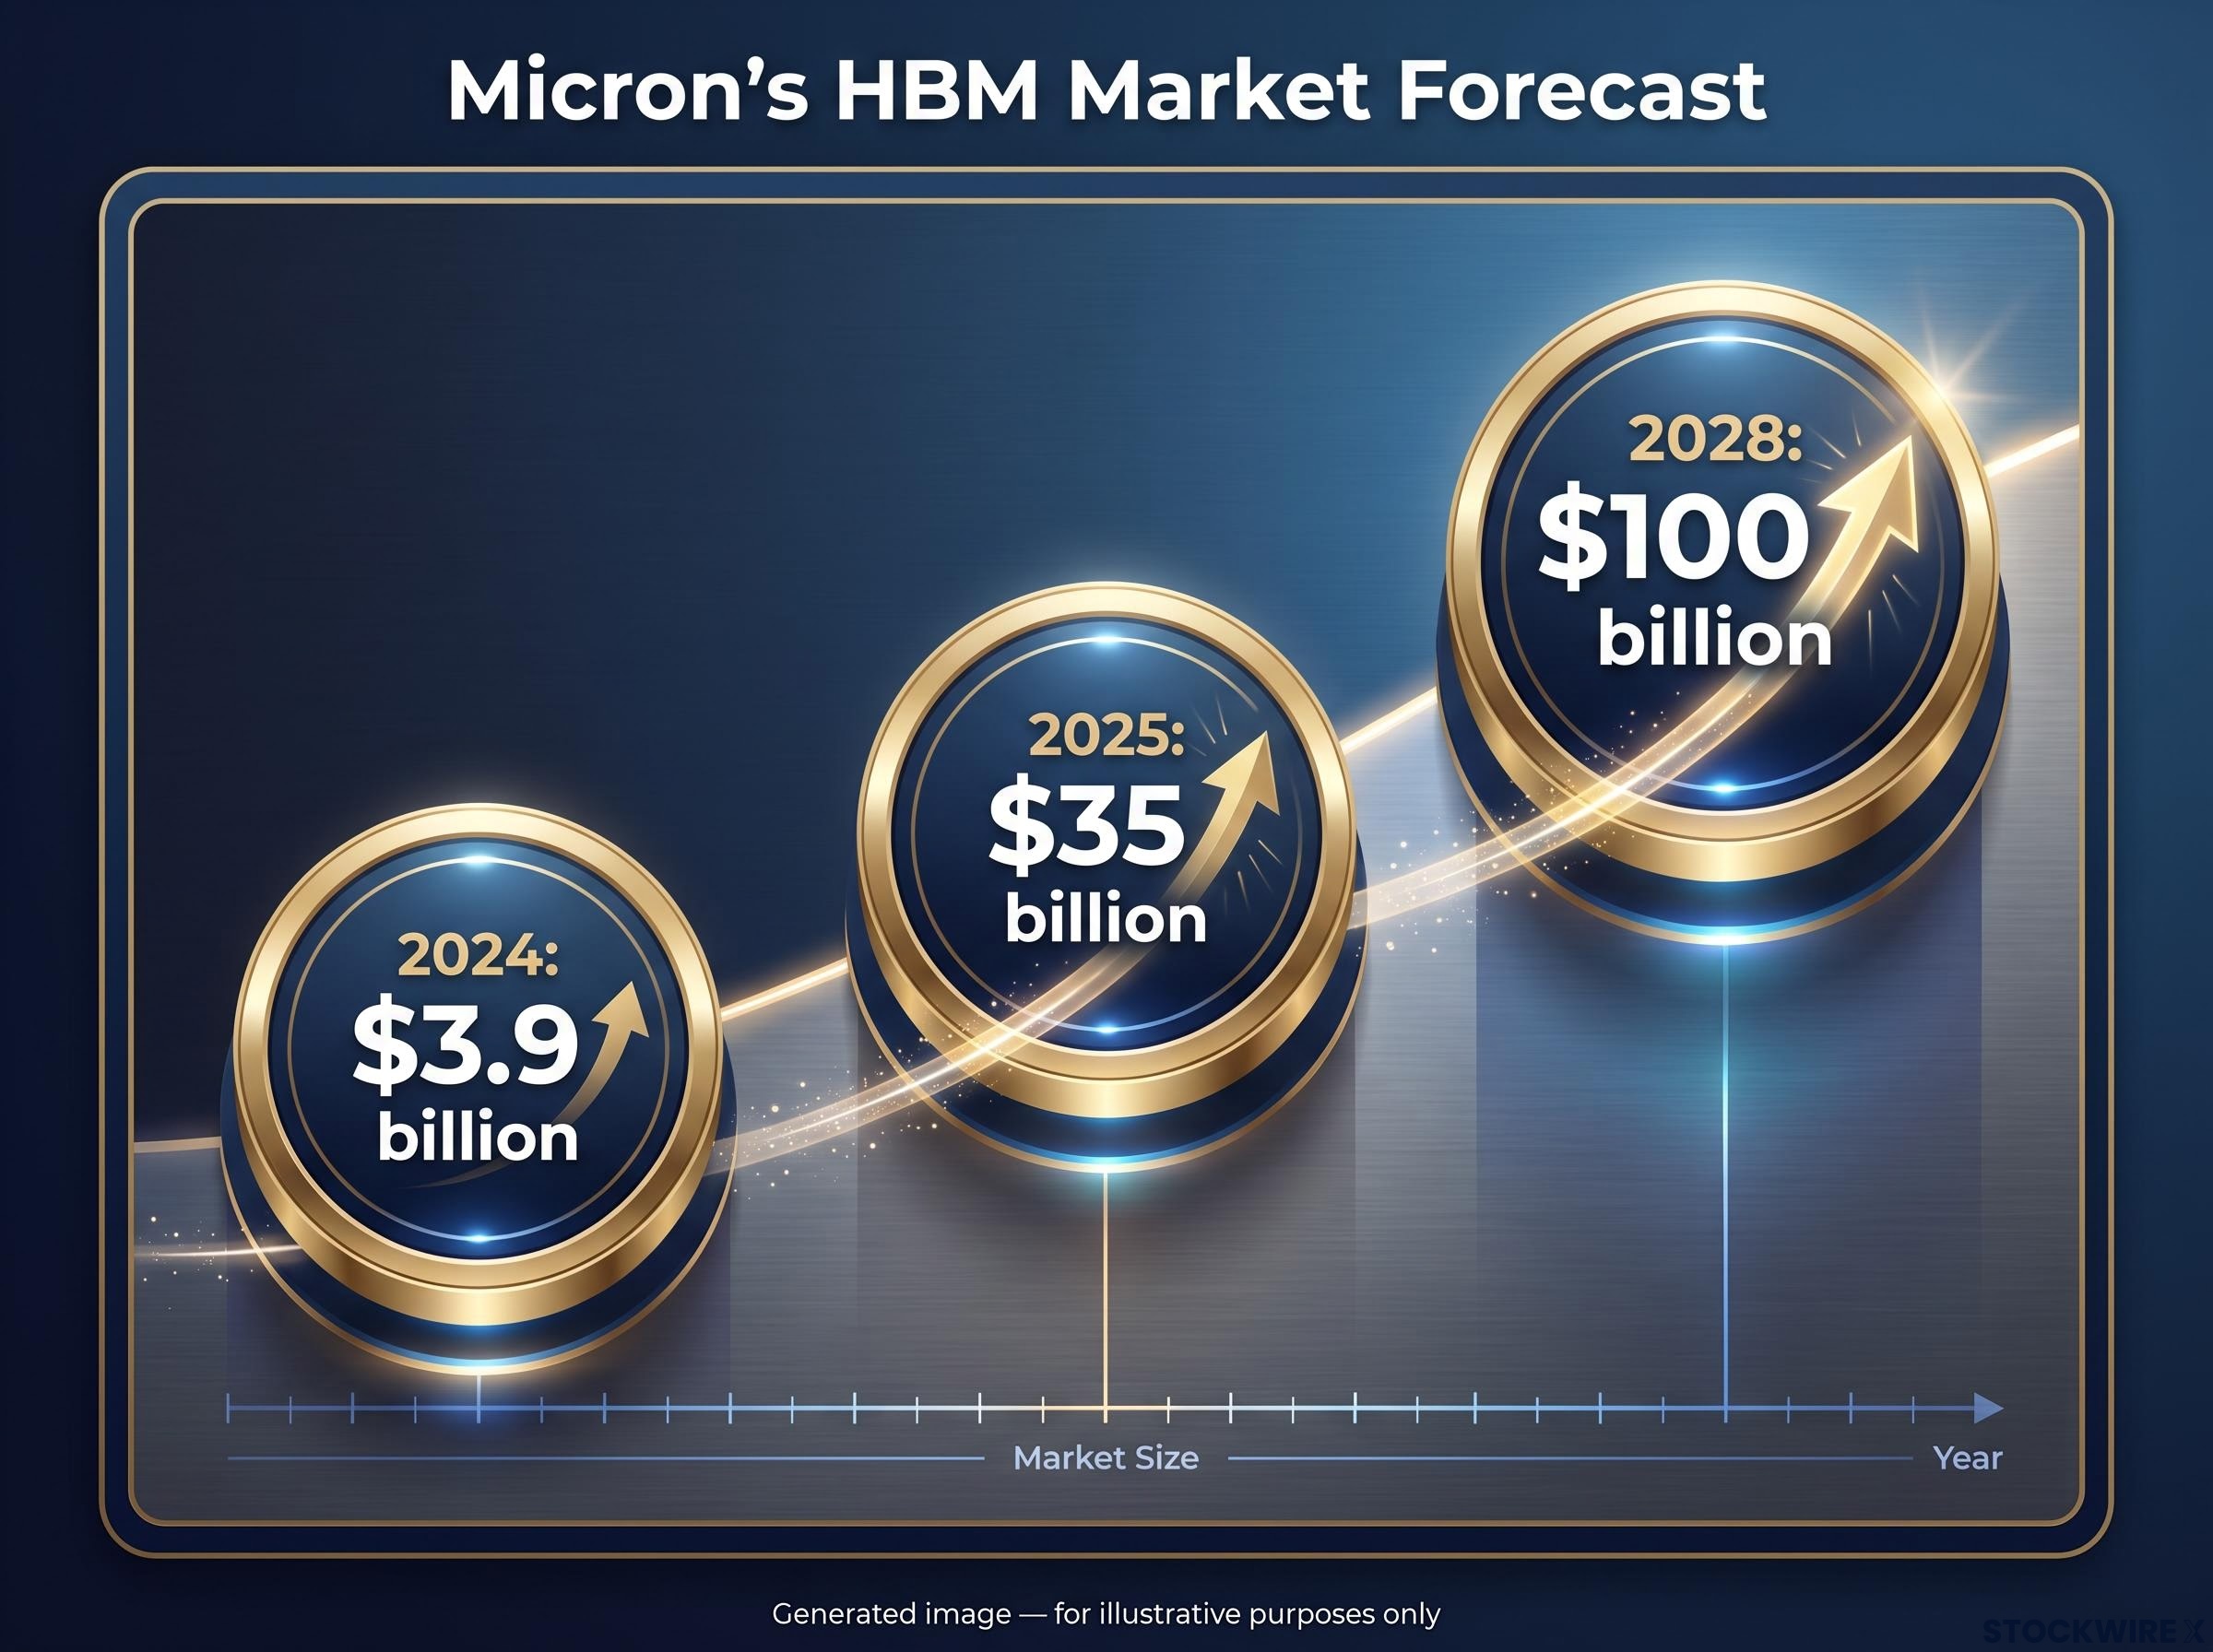
The market scale quantifies the opportunity. HBM was a $3.9 billion market in 2024. Micron forecasts the total addressable market reaching $35 billion in 2025 and $100 billion by 2028, two years ahead of its prior estimates.
Three structural reasons the deficit persists:
- Wafer substitution economics: Expanding HBM production directly displaces standard DRAM revenue, limiting the speed of capacity reallocation
- 3-4x wafer intensity: Each unit of HBM capacity consumes disproportionately more manufacturing resource than the DRAM it displaces
- Bandwidth growth lag: Because bandwidth scales slower than compute, architects must compensate with more memory, compounding demand faster than supply can respond
The wafer substitution math tells you that HBM capacity expansion is self-limiting in a way that demand is not. No producer can resolve the shortage without accepting a meaningful revenue trade-off on its existing DRAM business. That dynamic makes the supply deficit a more durable investment variable than a typical commodity shortage.
SK Hynix and the near-term catalyst investors should watch
The macro demand architecture points in one direction. The company-level question is who captures the value, and when the market recognises it.
SK Hynix is the market’s leading HBM supplier and the most directly exposed listed equity to the demand dynamics described above. The structural thesis supports a positive long-term view. But the near-term catalyst is more specific.
The SK Hynix partnership with Nvidia now spans four product lines including Vera Rubin AI systems and Jetson Thor robotics platforms under a formal multiyear co-development agreement, embedding the company in multiple GPU procurement cycles and reinforcing its ability to maintain share even as Samsung and Micron seek qualification wins at major hyperscalers.
- Leadership position: SK Hynix maintains its leading share in HBM supply, positioned at the centre of the structural shortage
- Q2 2026 capital return signal: At its Q2 2026 earnings call, SK Hynix management disclosed that the company had begun assessing potential routes for distributing capital to shareholders
- Citi’s Q3 2026 expectation: Citi expects SK Hynix to unveil a formal shareholder return programme in the period leading up to its Q3 2026 earnings release
Citi’s view is that SK Hynix will couple a positive forward-looking market assessment with a substantive commitment to shareholder returns, as the longer-term earnings outlook comes into sharper focus.
The anticipated announcement arrives against the backdrop of recent price weakness in the stock. For investors already convinced by the structural HBM demand thesis, the capital return programme represents the kind of near-term catalyst that can close the gap between fair value and current price. The combination of a yield catalyst with a forward-looking market outlook statement could serve as a rerating event, making timing as relevant as conviction here.
What the thesis gets right, where the risks sit, and what to watch
Not all risks carry equal weight. The distinction that matters is between risks that could break the investment case and risks that represent timing uncertainty.
| Risk Factor | Category | What to Watch |
|---|---|---|
| Collective over-investment in HBM capacity | Thesis-breaking | Combined capacity announcements from SK Hynix, Samsung, and Micron relative to demand trajectory |
| Sustained shift to inference-dominant workloads | Thesis-breaking | Hyperscaler earnings commentary on training vs. inference workload mix |
| Pace of architectural transition (scale-up to scale-out) | Timing risk | Data centre deployment cadence reported by cloud providers |
| Samsung and Micron competitive pressure on SK Hynix share | Timing risk | Quarterly market share shifts and qualification wins at major hyperscalers |
The wafer substitution trade-off provides a natural limiting mechanism on the over-investment risk. Because every gigabyte of new HBM capacity displaces standard DRAM revenue, no individual producer has an unconstrained incentive to over-build. The risk becomes material only if all three producers expand simultaneously beyond what the economics justify, a coordination scenario that the wafer trade-off structurally discourages.
The conditions that would make the demand case wrong
Two conditions would materially undermine the 434% aggregate HBM demand projection.
The first is a coordinated over-capacity build by all three major producers that exceeds the natural brake imposed by wafer substitution economics. If SK Hynix, Samsung, and Micron all convert wafer capacity at a pace that overwhelms demand growth, the structural deficit reverses. The signal to watch: combined capacity announcements that imply HBM supply growth consistently exceeding 5x demand expansion rates.
The second is a sustained hyperscaler pivot toward inference-dominant workloads. Training workloads are memory-intensive; inference workloads are more compute-tolerant and require less HBM per system. If the workload mix shifts materially toward inference, per-system HBM requirements soften. The signal to watch: hyperscaler capital expenditure commentary that explicitly de-prioritises training infrastructure in favour of inference-optimised deployments over multiple consecutive quarters.
The significance of training versus inference workloads for HBM demand runs deeper than a single risk flag: training requires tight full-cluster memory synchronisation while inference routes requests independently, meaning a sustained shift in the hyperscaler workload mix would not merely slow HBM volume growth but change the entire per-system memory architecture that the 434% projection assumes.
These are observable signals, not abstract risks. Tracking them gives you a specific falsifiability test for the thesis: if neither condition materialises, the structural demand case holds.
Where the HBM opportunity stands and what comes next
Three demand drivers converge on the same conclusion. Architectural scale-out pressure multiplies the number of GPUs per system. The per-GPU HBM roadmap shows consistent capacity increases across every generation. And wafer substitution economics create a structural ceiling on how fast supply can respond. Each driver operates independently, and together they compound.
The investor opportunity sits on two time horizons. The long-cycle thesis rests on the memory wall and the production economics that constrain supply. The near-term catalyst is SK Hynix‘s anticipated shareholder return programme ahead of Q3 2026 earnings, a potential entry or accumulation event for those who accept the structural view.
AI memory stocks attracted seven-times-oversubscribed institutional demand at SK Hynix’s US listing and prompted Micron to raise its total US investment target to above $250 billion through 2035, a capital commitment pattern that reflects the market pricing memory production capacity as a generational infrastructure asset rather than a cyclical semiconductor trade.
The appropriate posture is conviction with conditions. The demand trajectory is supported by converging evidence, but the monitoring framework matters: watch capacity announcements from all three producers, watch the training-versus-inference workload mix at hyperscalers, and distinguish between signals that change the conclusion and signals that change the timing. That distinction is what separates a position you hold through volatility from one you should exit.
This article is for informational purposes only and should not be considered financial advice. Investors should conduct their own research and consult with financial professionals before making investment decisions. Financial projections referenced are subject to market conditions and various risk factors. Forward-looking statements regarding demand trajectories, market size, and shareholder return programmes are speculative and subject to change based on market developments and company performance.






