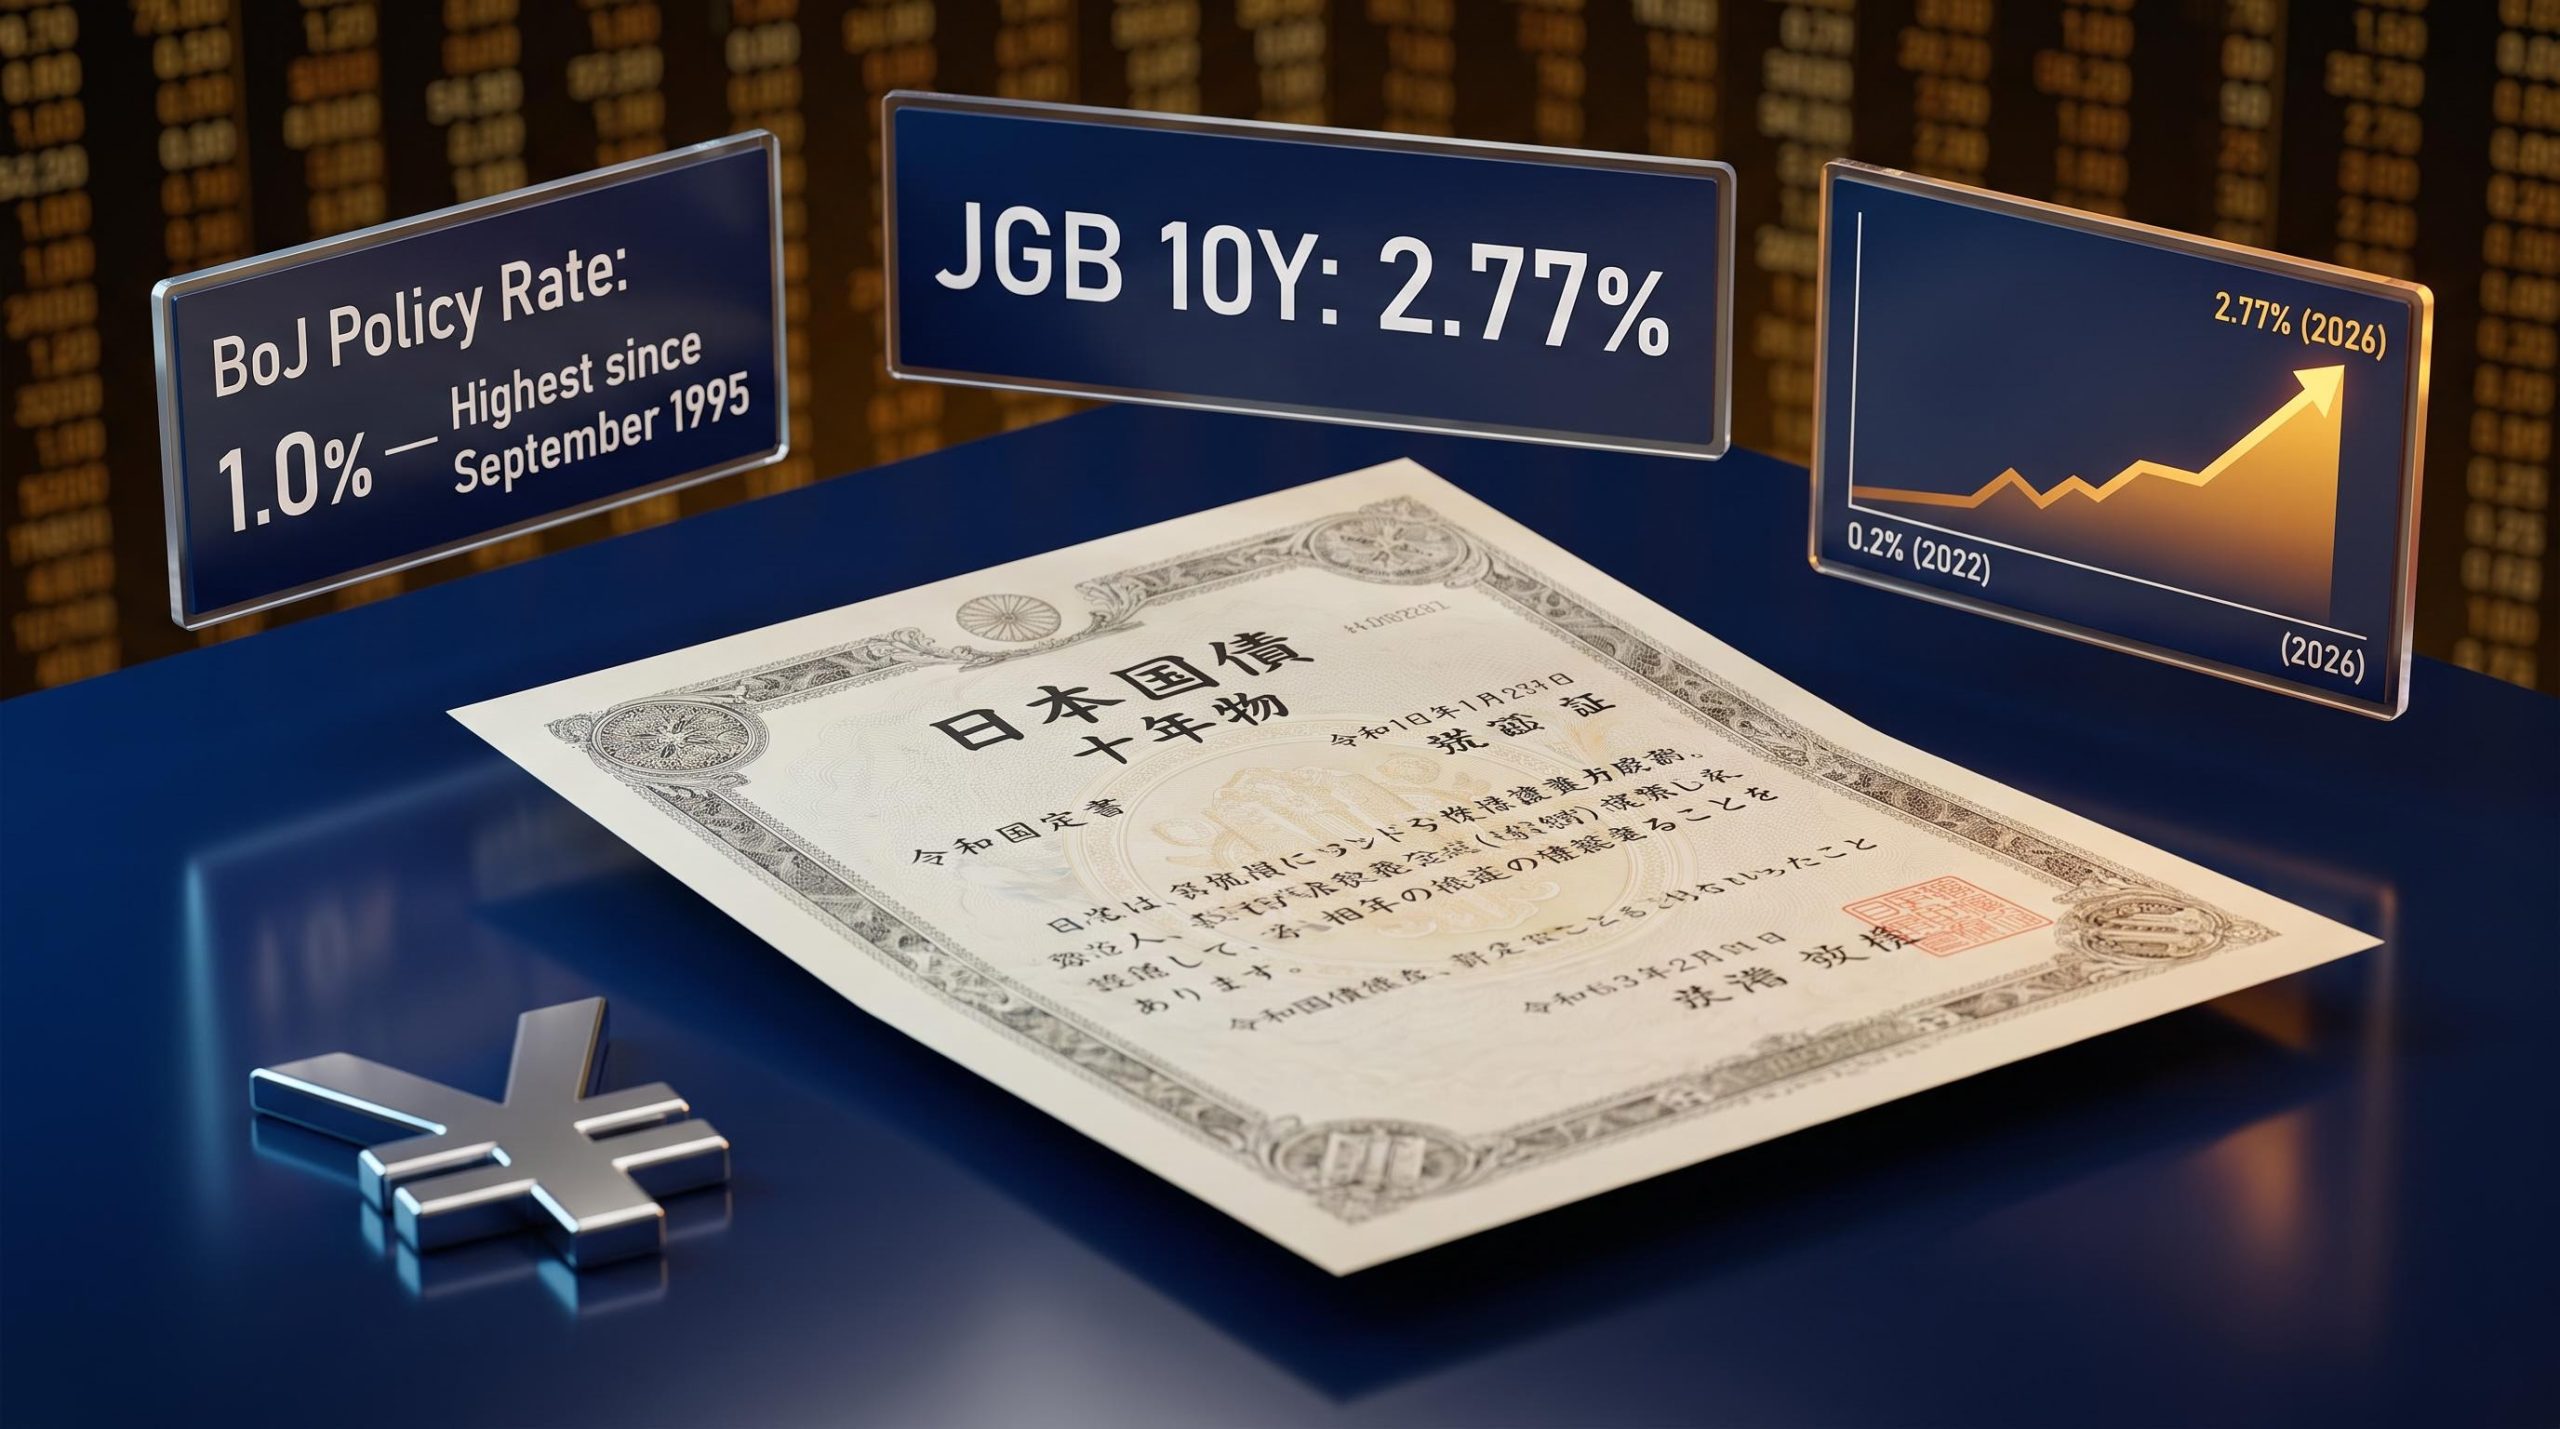
Japan’s 10-year government bond yield has climbed from roughly 0.2% to 2.77% between early 2022 and mid-2026. In most sovereign bond markets, that kind of shift barely registers. In Japan, it represents something closer to a structural revolution: the dismantling of a yield-suppression architecture that global investors had, consciously or not, built entire strategies around.
This is not a credit scare. A Morningstar DBRS sovereign assessment published today interprets the yield rise as a normalisation process rather than evidence of weakening credit fundamentals, a distinction that changes how every downstream implication should be read. The Bank of Japan (BoJ) spent more than a decade suppressing yields through Yield Curve Control (YCC) and negative interest rates. What is happening now is the removal of that suppression, not a loss of market confidence.
Here is the analytical framework for separating what has genuinely changed from what has merely been priced in, and for understanding the three channels through which Japan’s policy shift is transmitting into global capital markets: JGB repricing, the yen carry trade, and institutional repatriation.
From negative rates to 1%: the policy milestones that repriced Japan’s yield curve
The prior regime was extreme by any measure. For most of the 2010s, the BoJ ran negative short-term rates, purchased government bonds at industrial scale (with the central bank’s JGB holdings reaching a peak share of around 52% of the total outstanding stock), and capped the 10-year yield near 0% through explicit Yield Curve Control. The architecture was designed to force yields down and push capital outward. It worked.
The exit began in March 2024 and has proceeded in deliberate sequence:
- March 2024: The BoJ ended the world’s last negative interest rate regime, raising its policy rate from -0.1% to a 0-0.1% range, and formally abandoned Yield Curve Control.
- March 2024 to June 2026: A series of incremental rate increases lifted the policy rate to 1.0%, the highest level since September 1995.
- 31 July 2026: The BoJ held the rate steady at 1.0%, signalling a data-dependent pause rather than a reversal.
The policy rate path: -0.1% to 1.0%, the highest since September 1995. Still low by international standards, but structurally significant for a country that spent a decade at or below zero.
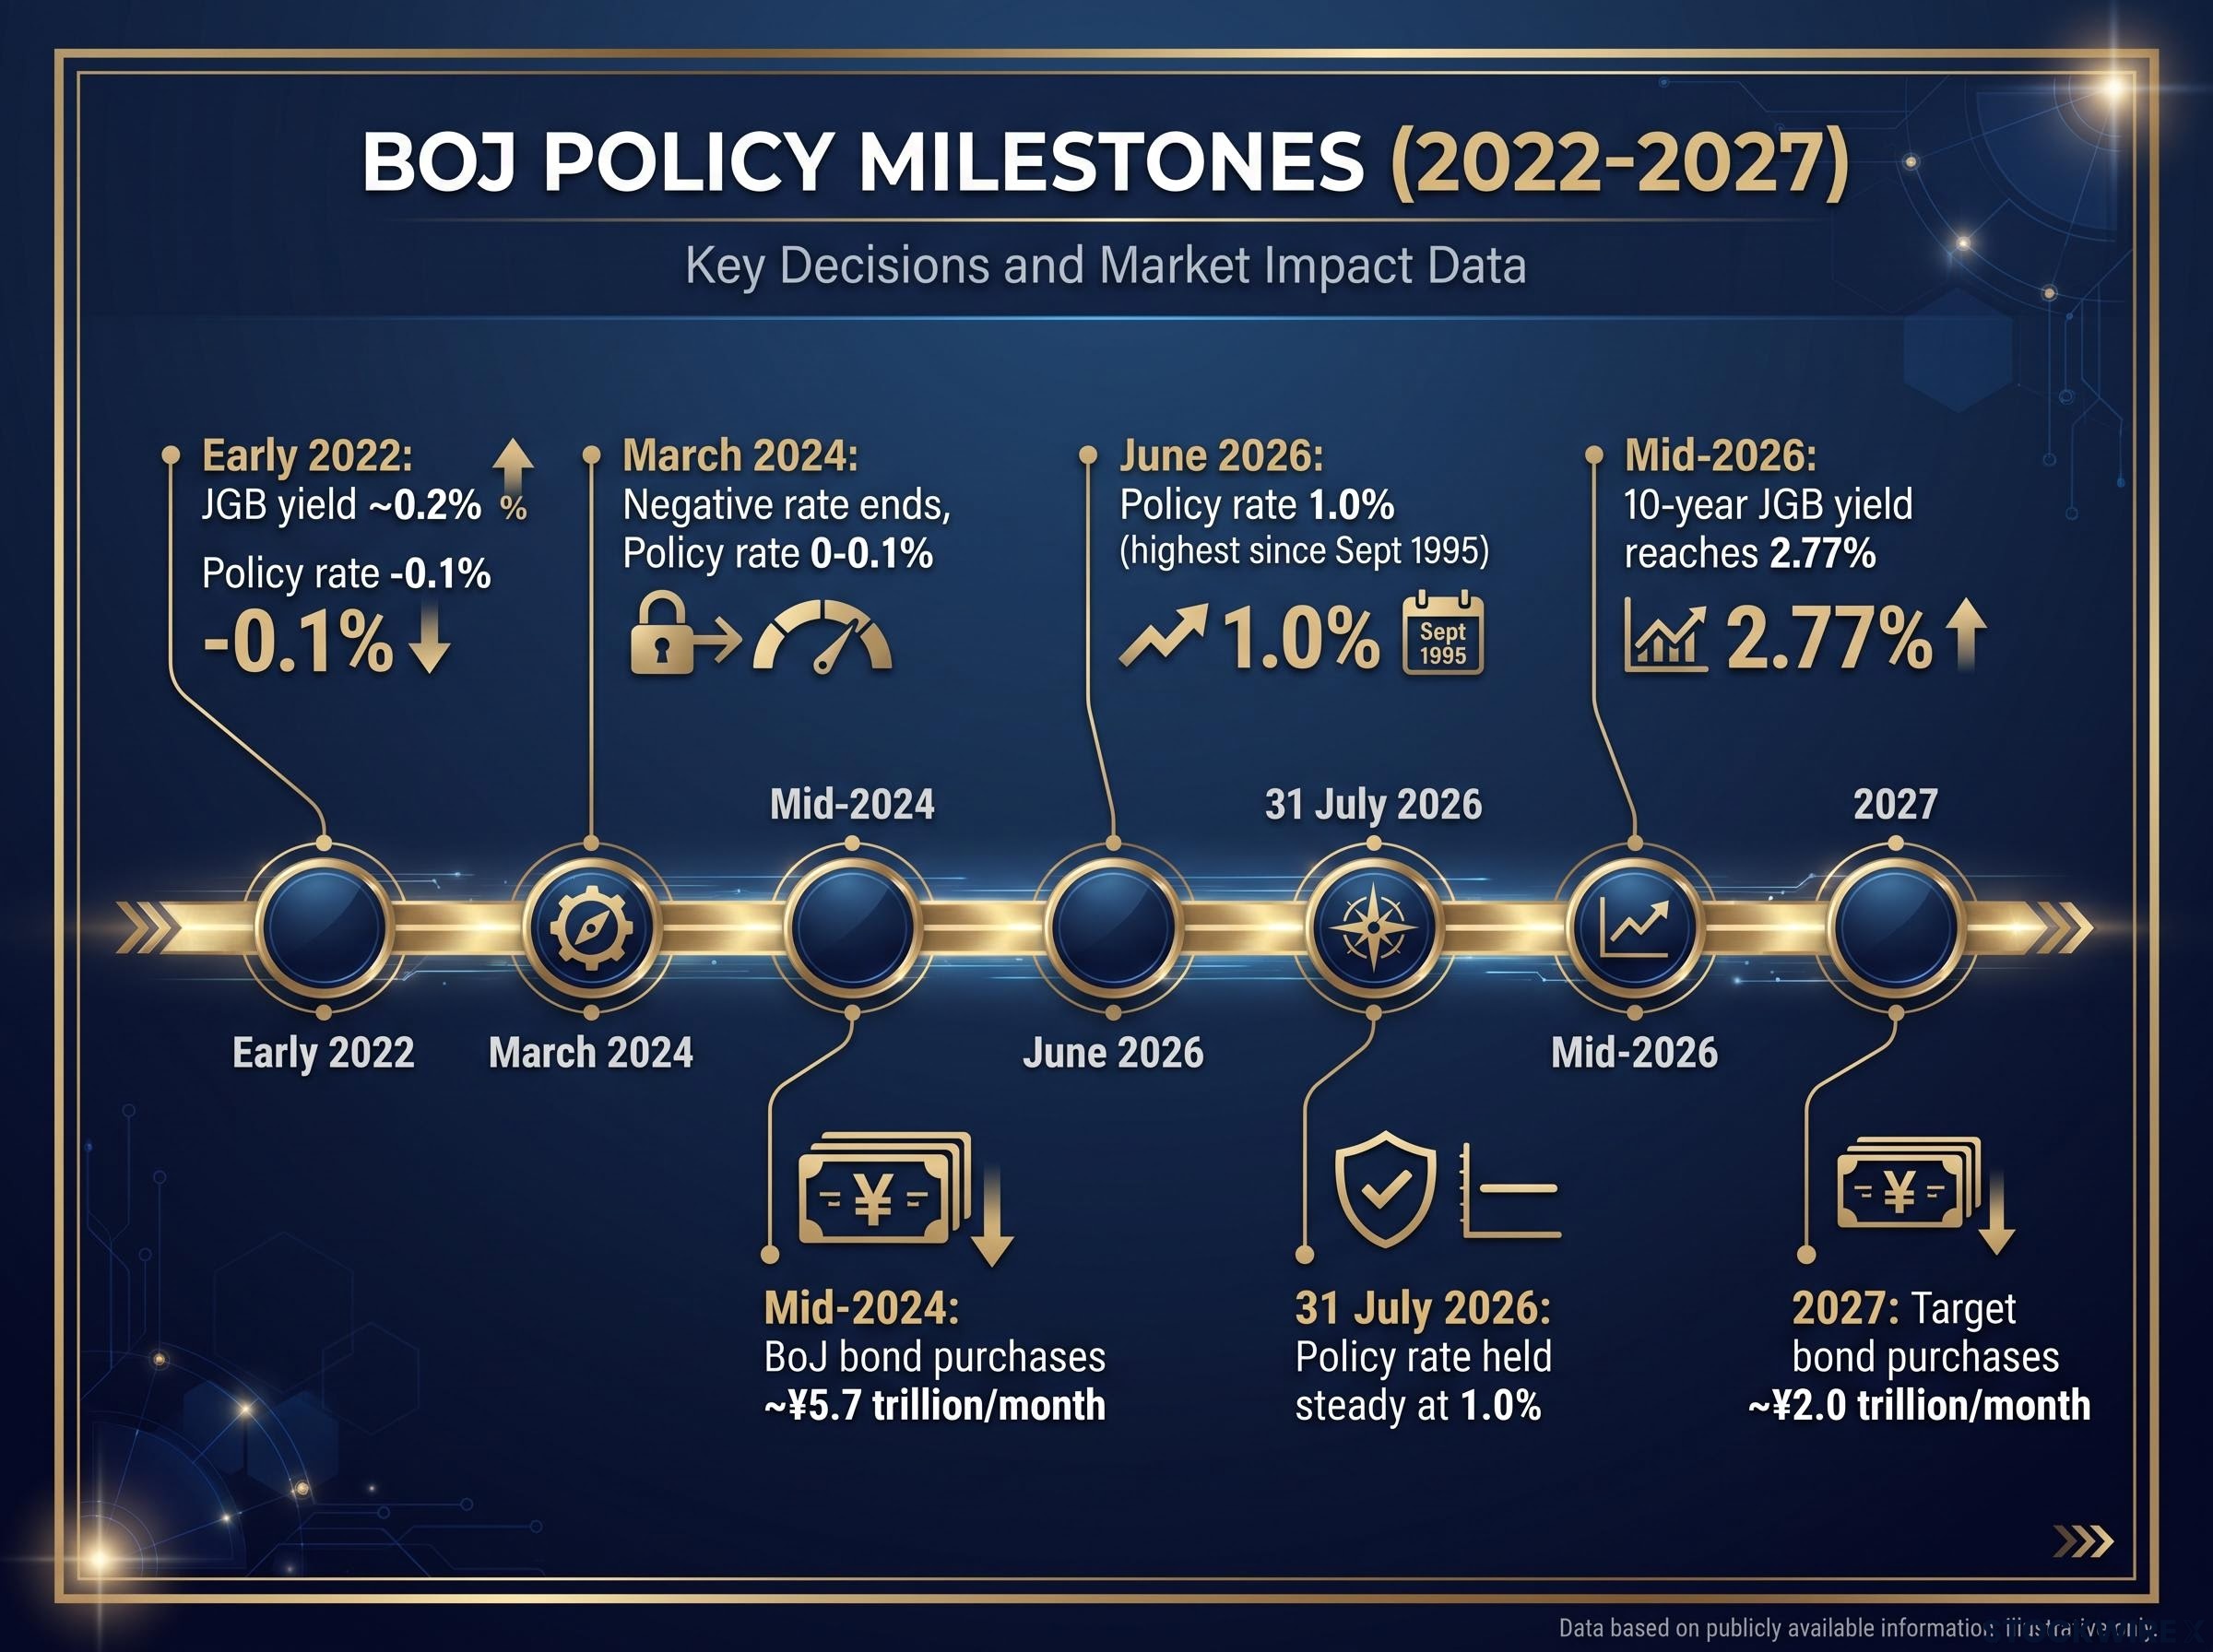
In parallel with rate hikes, the BoJ has been scaling back its monthly bond purchases, reducing them from around ¥5.7 trillion in mid-2024 to a target of roughly ¥2.0 trillion by 2027, with current purchases running at approximately ¥2.0-2.5 trillion per month. Throughout this period, consumer price inflation has held at or above the 2% target, underpinned by annual Shunto wage settlements and broadening price pressures in the services sector, providing the BoJ with the macroeconomic justification to continue tightening.
The June 2026 rate hike to 1.0% was accompanied by a structured tapering schedule reducing monthly JGB purchases by approximately 200 billion yen per quarter through March 2027, a dual-instrument tightening move that compressed the carry trade’s borrowing-cost advantage from both the rate and the supply side simultaneously.
This is not a central bank reacting to a crisis. It is one deliberately dismantling a decade-old architecture, and the pace of dismantling, gradual, well-communicated, data-dependent, is itself a policy choice designed to manage market impact. Understanding that sequence is the foundation for everything that follows. Without it, the 2.77% yield looks sudden. With it, it looks like the only plausible outcome.
When big ASX news breaks, our subscribers know first
What does it actually mean for a JGB yield to be “normal”?
Under YCC, the BoJ was a price-insensitive buyer. It would purchase whatever quantity of JGBs was necessary to keep the 10-year yield pinned near its target. That removed something from the market that most bond investors take for granted: the ability to price duration risk and inflation risk independently. Term premium, which is the additional yield investors demand for holding a longer-dated bond instead of rolling short-term ones, was effectively eliminated by central bank fiat.
With the cap removed and purchases tapering, private investors now set the marginal price. They demand compensation for holding 10-year duration in an economy where inflation is running at or above 2% and the central bank is actively tightening. That compensation is the term premium re-entering the yield.
Morningstar DBRS analysts Rohini Malkani and Thomas R. Torgerson characterise the yield increase as normalisation rather than a sign of weakening creditworthiness, a distinction they frame as the correct analytical lens for the current JGB environment.
The distinction matters because the numbers that would accompany a sovereign credit scare are absent. Domestic ownership sits at approximately 88-90%. There has been no CDS blowout, no disorderly sell-off, no flight from JGB auctions. The IMF views higher long-term rates as part of a needed exit from unconventional easing, not a sign of market stress.
The IMF 2025 Article IV assessment of Japan explicitly frames higher long-term yields as part of a needed exit from unconventional easing, lending multilateral institutional weight to the distinction between normalisation and sovereign stress that underlies the analytical framework in this article.
| Attribute | YCC Era | Post-YCC Normalisation |
|---|---|---|
| Who sets the marginal price | BoJ (price-insensitive buyer) | Private investors (return-sensitive) |
| Term premium present | Suppressed near zero | Re-entering as market-determined |
| Sensitivity to inflation | Muted by BoJ purchases | Directly reflected in yields |
| 10-year yield level | ~0.0-0.2% | ~2.77% (August 2026) |
The 2.77% yield is not a warning signal for Japan’s creditworthiness. It is what a freely priced JGB looks like when a decade of artificial suppression is removed. Recognising that distinction protects you from misreading the signal entirely.
The carry trade unwind: why yen normalisation is a global risk event
For years, the yen was the funding currency of choice. The mechanics were straightforward: borrow in yen at negative or near-zero rates, convert to dollars or other higher-yielding currencies, and deploy the capital into US Treasuries, high-yield credit, or emerging-market assets. The yield differential was the profit.
The trade was supercharged after 2022. From March 2022 through to July 2023, the US Federal Reserve pushed the federal funds rate up from near zero to a peak of 5.25-5.50%, even as the BoJ kept its policy rate at -0.1% and maintained yield curve control over JGBs. That combination produced the widest US-Japan rate differential in a generation, driving the yen down from around ¥110 per USD at the start of 2022 to close to ¥160 by mid-2024.
The assets most exposed to carry unwind selling pressure include:
- US Treasuries
- European sovereigns
- Emerging-market bonds and equities
- High-yield credit
When the unwind accelerates
The reversal mechanism is now active. As Japanese short-term rates rise to 1.0% and US rates peak and begin to ease, the differential narrows. Carry profitability falls. Leveraged short-yen positions begin to unwind, and unwinding means selling whatever assets the borrowed yen financed.
This dynamic can accelerate abruptly. When currency moves reduce the carry trade’s profit margin below its carrying costs, a self-reinforcing loop emerges: yen buying drives further yen strength, which triggers further position liquidation, which forces more asset selling. This is not hypothetical. Partial unwinds driven by BoJ communication shifts produced sharp, short-term moves in global risk assets during the 2024-2025 period.
For global portfolio managers, the second-order effect is what matters most. Carry unwind forces selling in US Treasuries, high-yield credit, and emerging-market bonds from a source that has nothing to do with those markets’ own fundamentals. The pressure originates in Tokyo and lands in New York, London, and São Paulo.
The carry trade arithmetic that sustains yen-funded positions even at a 1.0% BoJ rate reflects the roughly 2.5-2.75 percentage point spread that still exists against the Fed’s target range, a gap wide enough to keep the structural trade viable even as yen funding costs have risen materially from their negative-rate floor.
Domestic yields and the case for capital repatriation
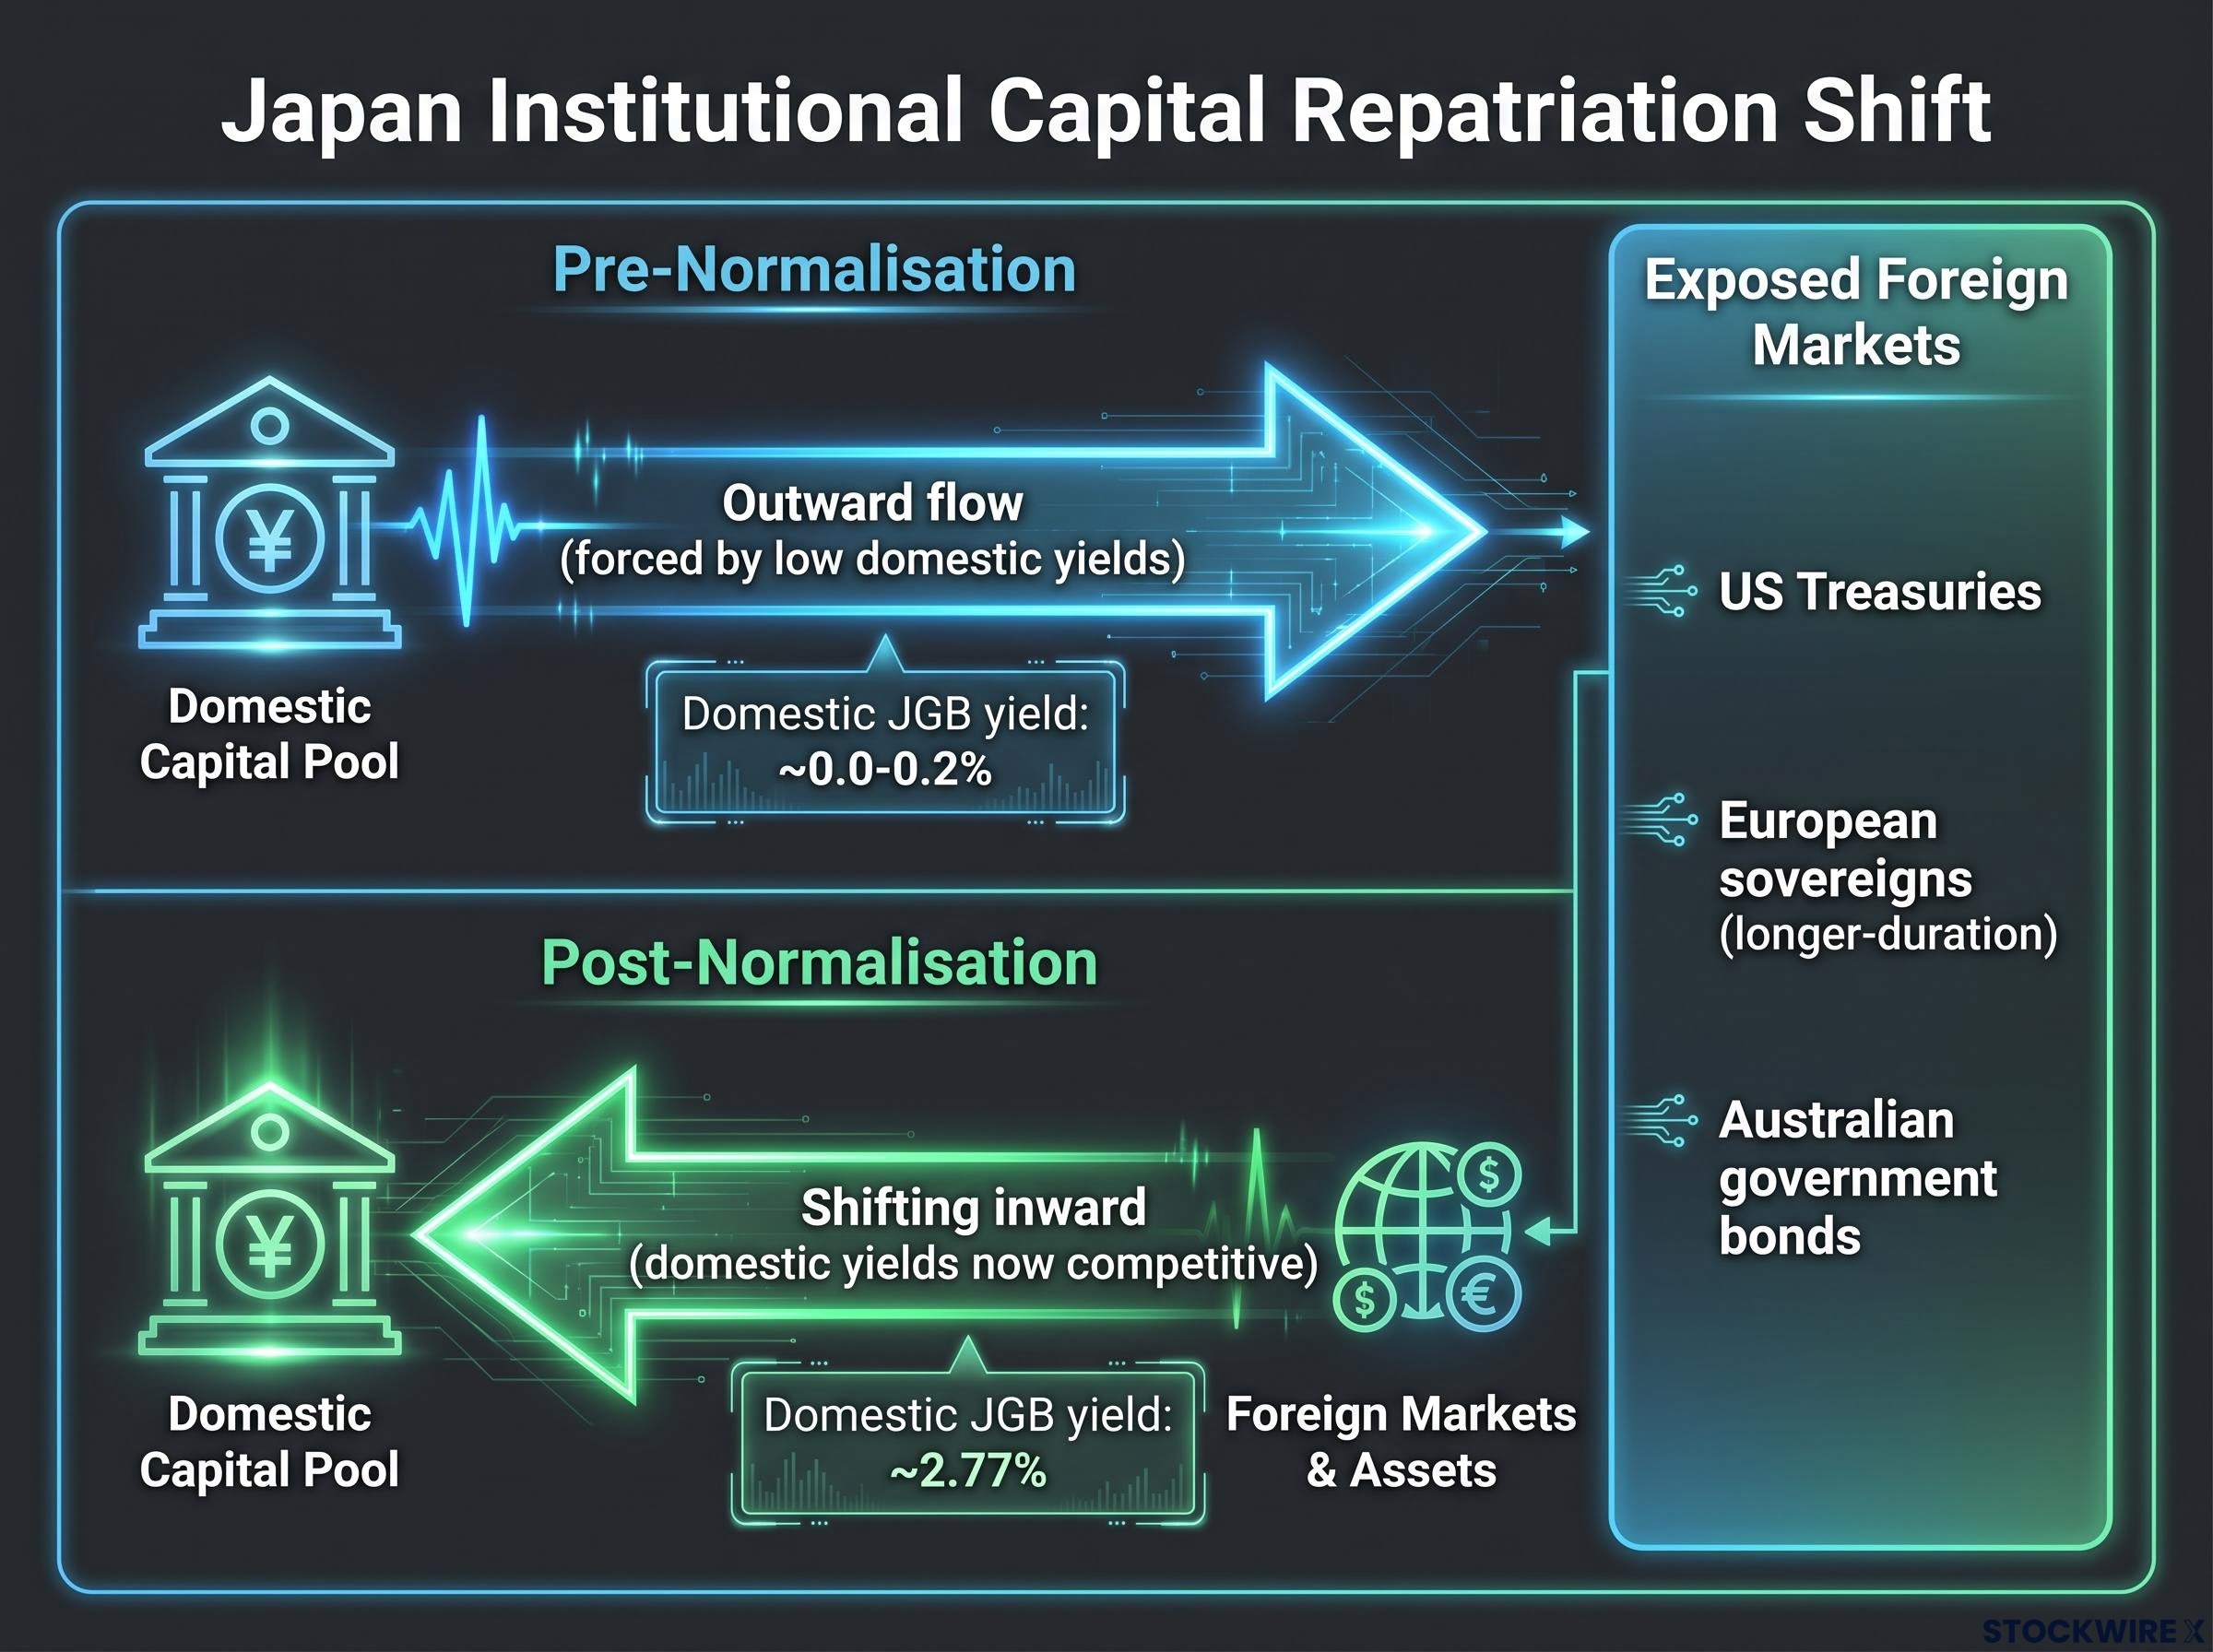
For most of the YCC era, Japanese life insurers and pension funds faced a simple but painful reality: domestic JGB yields were too low to meet return targets or match long-term liabilities. Foreign bonds became structurally necessary. Japan became one of the world’s largest exporters of long-duration capital, with trillions invested in US Treasuries, European sovereigns, and Australian government bonds.
The calculus has shifted. A 10-year JGB at approximately 2.77% represents a materially different risk-return proposition than one yielding 0.1%. Once currency-hedging costs are applied to foreign holdings, JGBs can compare favourably to hedged US or European sovereigns, particularly in a world where foreign central banks are easing and the yen is strengthening.
| Attribute | Pre-Normalisation | Post-Normalisation |
|---|---|---|
| Domestic JGB yield (10-year) | ~0.0-0.2% | ~2.77% |
| Hedged foreign bond attractiveness | High (wide yield gap, low hedging costs) | Reduced (narrower gap, higher yen hedging costs) |
| Structural flow direction | Outward (forced by low domestic yields) | Shifting inward (domestic yields now competitive) |
The BoJ’s purchase tapering reinforces this dynamic. As monthly purchases move toward ¥2 trillion, a larger share of government issuance must be absorbed by private domestic buyers, effectively pulling institutions back into the local market. Rating agencies and the IMF both recognise that the post-YCC environment structurally shifts the financing burden toward private domestic investors.
GPIF reallocation toward domestic assets, signalled by Finance Minister Katayama on 10 July 2026, represents one of the most concrete institutional expressions of the repatriation thesis: even a 5-10 percentage point shift in the near-$2 trillion portfolio implies tens to low hundreds of billions of dollars in foreign asset sales over the coming years.
The foreign bond markets most exposed to reduced Japanese institutional demand include:
- US Treasuries
- European sovereigns, particularly longer-duration issues
- Australian government bonds
Reallocation will be gradual. Institutions manage complex liability profiles and hedging programmes that do not pivot overnight. But the direction of travel is clear, and even partial repatriation, institutions redirecting a fraction of overseas sovereign allocations back to JGBs, removes a stable long-duration buyer from US and European bond markets. That puts upward pressure on those yields from a source that originates entirely outside their own fundamentals.
Four variables that will determine how far this travels
Japan’s policy path is not on autopilot. Four specific variables will determine whether normalisation accelerates or stalls, and each one transmits differently into global capital markets.
| Variable | Hawkish / Strong Signal | Dovish / Weak Signal |
|---|---|---|
| Wage growth and core inflation | Strong Shunto settlements, persistent services inflation → further hikes supported | Wage momentum fades, inflation undershoots → prolonged pause at 1.0% |
| BoJ bond purchase path | Smooth tapering toward ¥2 trillion/month → orderly yield discovery | Disorderly yield spike forces slowdown or reversal of tapering |
| Fed easing cycle speed | Rapid Fed cuts → differential narrows fast, repatriation accelerates | Slow or interrupted easing → carry trade stays viable longer |
| Yen behaviour and FX positioning | Persistent yen strength → confirms carry unwind underway | Renewed yen weakness → revives imported inflation, pressures BoJ hawkward |
The single most consequential signal to monitor: BoJ communication credibility on the purchase tapering path. If markets lose confidence that tapering will proceed as scheduled, the entire normalisation narrative reprices.
What this tells you is that tracking the BoJ’s communications and Shunto wage outcomes deserves the same weight in your macro framework as tracking the Fed. These four variables could each either accelerate or delay the global transmission of normalisation, and the interaction between them is what determines whether the shift stays orderly or produces the kind of abrupt repricing episodes that marked 2024-2025.
Two of the three carry trade warning signals that preceded the 2024 S&P 500 correction of approximately 10% were already active as of mid-2026, with Japan’s 10-year JGB yield above 2.65% and the US 10-year Treasury near 4.46-4.49%, leaving only a confirmed USD/JPY breakdown below the 160 neckline as the remaining trigger to watch.
What normalisation at 2.77% actually changes for global portfolios
The three channels covered in this analysis, JGB repricing, carry trade erosion, and institutional repatriation, are not independent forces. They are three expressions of a single structural reconfiguration: Japan’s monetary policy is normalising, and the capital that was pushed outward by artificial suppression is beginning to return.
The analytical foundation that separates an informed response from a reflexive one is the normalisation frame. Investors who read 2.77% JGB yields as a sovereign risk signal will misallocate. Those who understand it as market repricing, backed by 88-90% domestic ownership, no CDS stress, and explicit confirmation from Morningstar DBRS and the IMF, will position accordingly.
Three durable strategic shifts follow:
- JGBs are now a genuine market asset with market-determined yields, term premium, and sensitivity to inflation and fiscal signals, not a policy instrument pinned by central bank fiat.
- The yen’s funding-currency era is structurally over. With the policy rate at 1.0% and further data-dependent moves possible, the days of an essentially free yen funding source are finished for the foreseeable future.
- Japanese institutions have a credible domestic alternative. The structural incentive to hold more JGBs and fewer foreign bonds is now clearly present, and even partial reallocation alters the demand picture for US, European, and Australian sovereigns.
The convergence of BoJ tightening and Fed easing is the macrostructural dynamic defining the next phase. Parts of global markets have already priced this in. Others have not. Understanding which of your exposures sit in which category is the practical work that follows from this analysis.
This article is for informational purposes only and should not be considered financial advice. Investors should conduct their own research and consult with financial professionals before making investment decisions. These statements regarding future policy paths and capital flows are speculative and subject to change based on market developments and central bank decisions.
—