
On days when Treasury yields jump, some holdings in a broad index drop two or three times harder than others. The standard explanations, rotation out of growth, shifting sentiment, sector preferences, describe what happened but explain nothing about why. The real reason is mathematical, not behavioural, and once you see it, you cannot unsee it.
The 10-year U.S. Treasury yield sits at approximately 4.74% as of early August 2026. At that level, safe assets offer a return substantial enough to compete directly with riskier ones. Every future cash flow in every equity valuation globally is now being discounted at a hurdle rate that genuinely demands attention. Whether you hold concentrated growth positions or a broad cap-weighted index fund, the current rate environment reshapes the arithmetic of valuation in ways your portfolio is already reflecting.
Here is what this piece gives you: a mechanical explanation you can apply the next time yields move and your holdings behave unevenly. You will understand which positions carry the most rate sensitivity, why they do, and what kind of decline actually demands a response from you.
The equation that explains why some stocks fall harder than others
Every stock’s value rests on a single equation. The present value of a future cash flow is calculated as:
PV = CF / (1 + r)^n
Where CF is the cash flow you expect to receive, r is the discount rate (driven by interest rates), and n is the number of years until that cash flow arrives. The exponent is where everything changes.
A one-percentage-point rise in the discount rate does not strike all cash flows equally. The damage it inflicts depends almost entirely on how many years separate you from the cash flow in question. A payment landing in one year sheds less than 1% of its present value. That same rate increase applied to a payment due in 20 years strips away roughly 17%.
That is an 18x difference in sensitivity from the same one-percentage-point move.
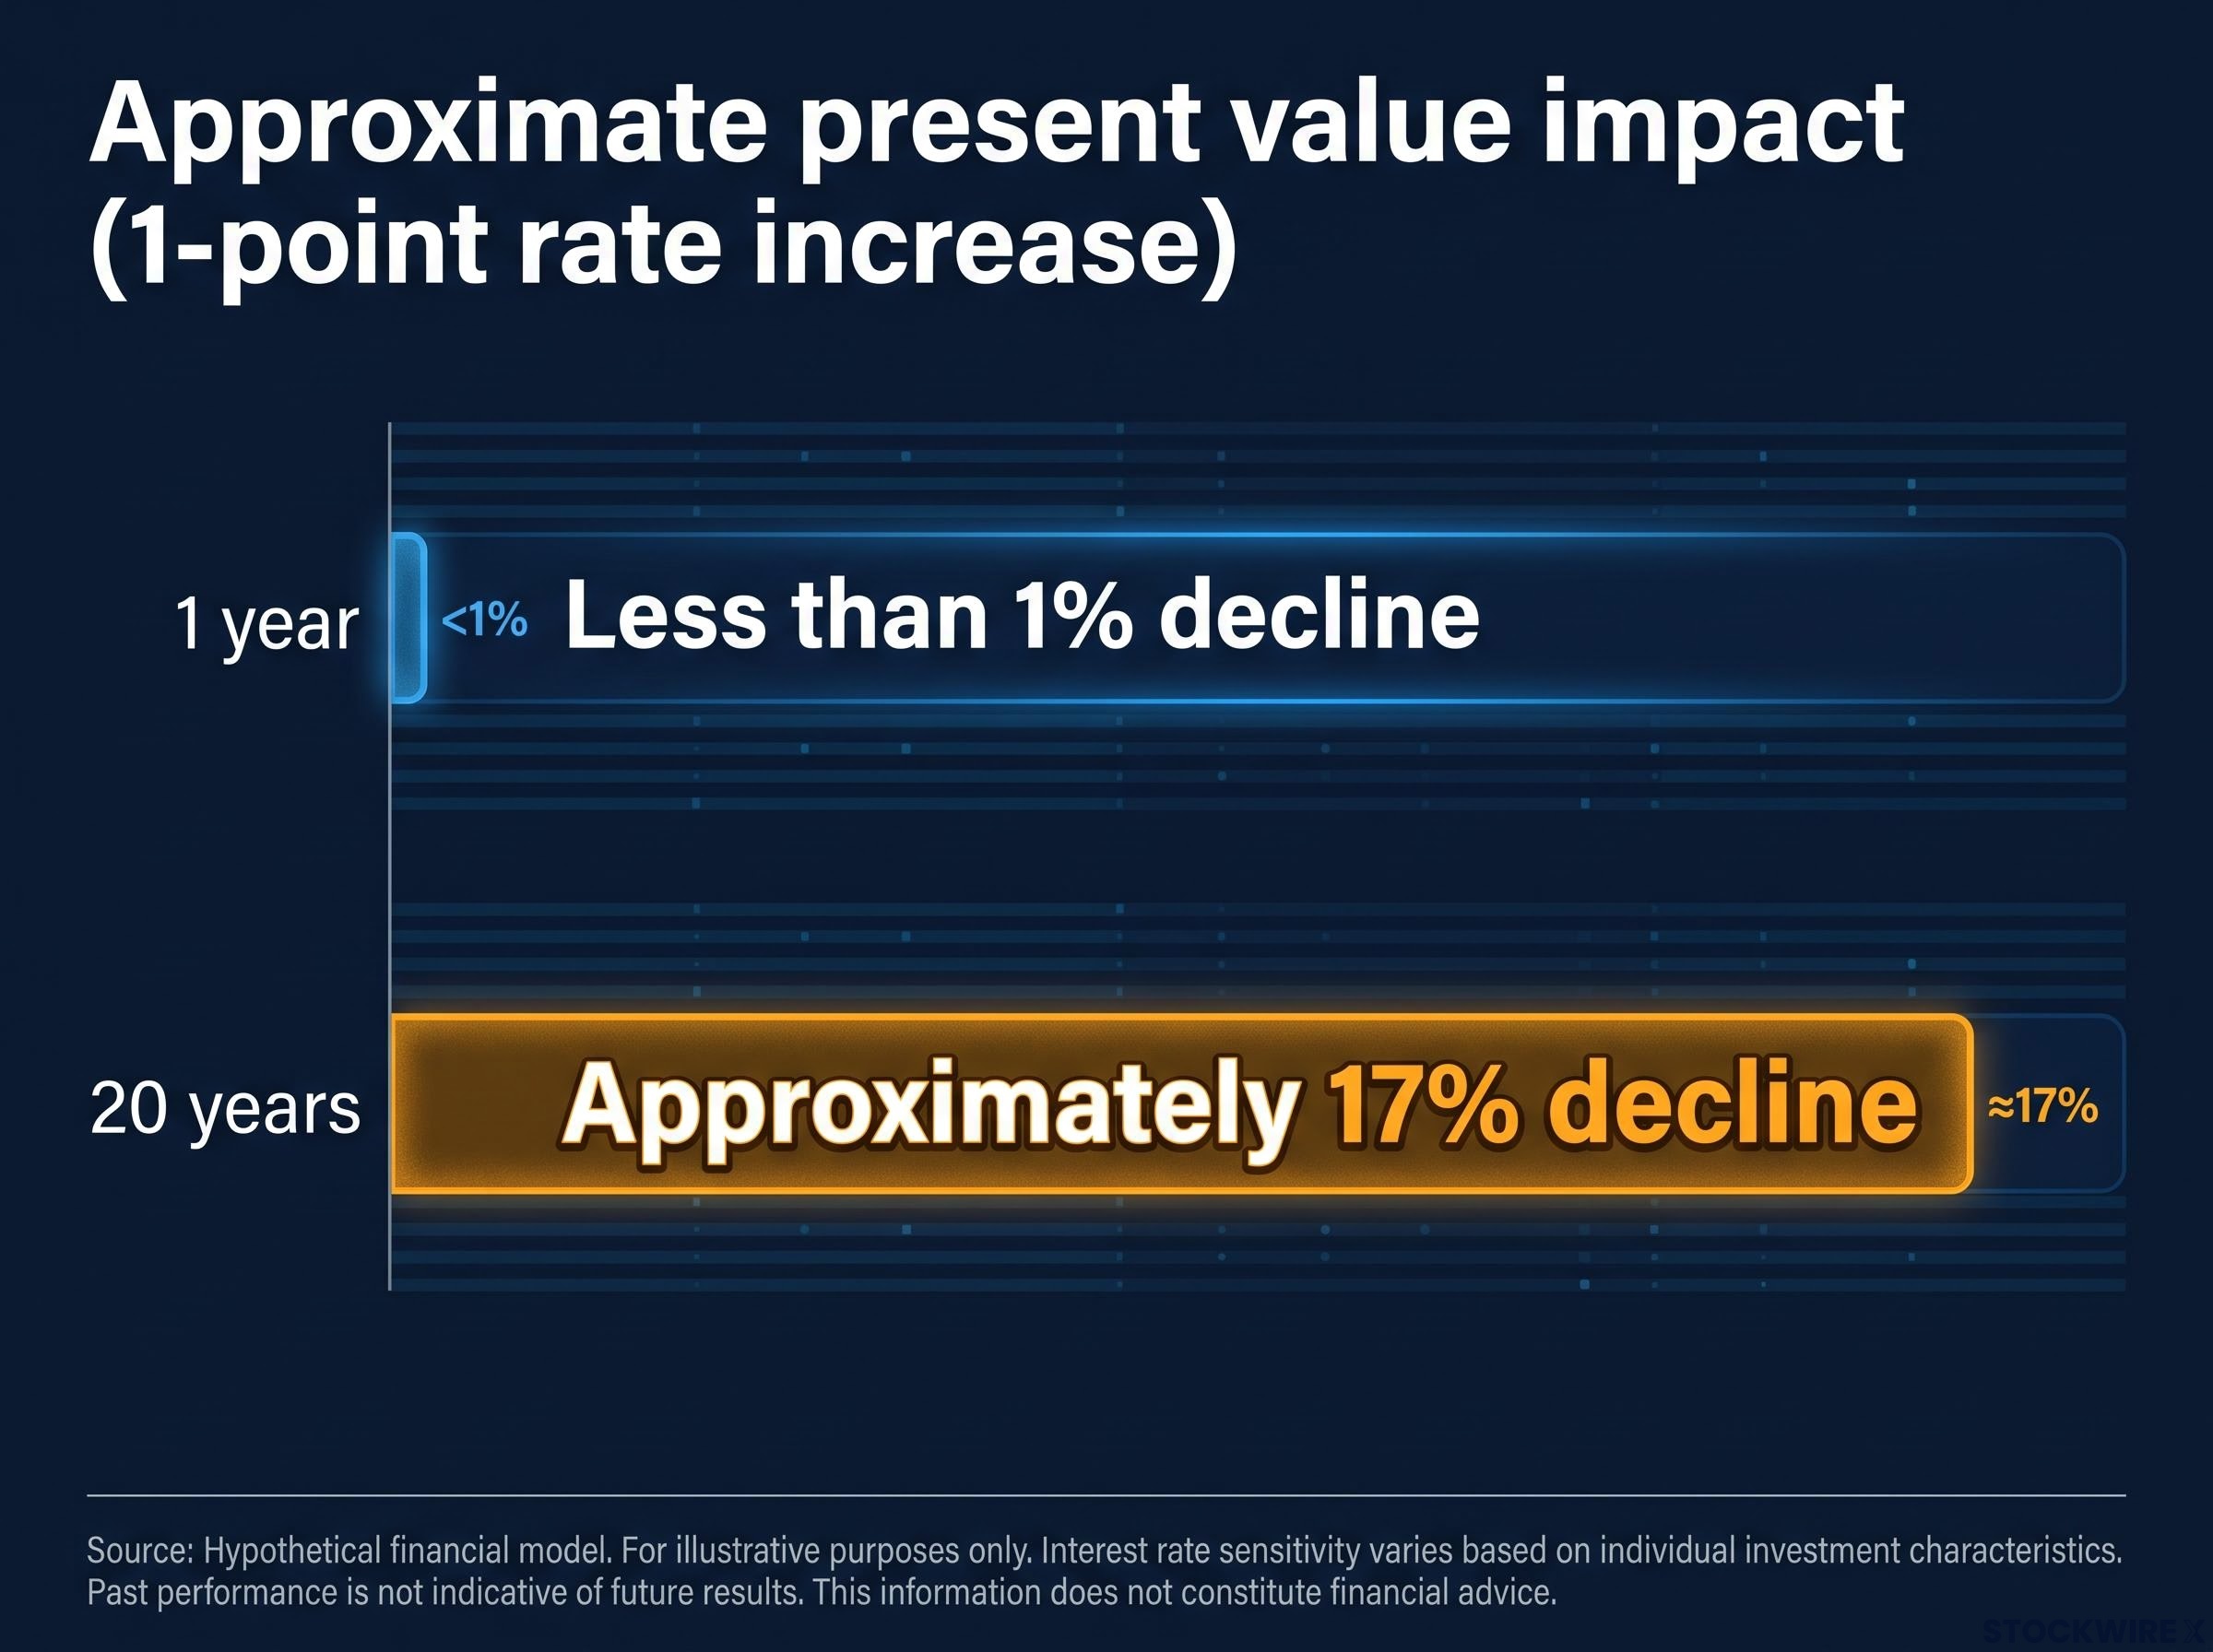
| Time horizon | Approximate present value impact (1-point rate increase) |
|---|---|
| 1 year | Less than 1% decline |
| 20 years | Approximately 17% decline |
This outcome is not a quirk of investor sentiment or market psychology. It is a direct consequence of how discounting works: each year of additional delay gives the higher rate more compounding power to work backwards, shrinking the present value by a progressively larger margin. A short-horizon cash flow barely feels the difference, while a distant one absorbs it in full. That 18x gap is the reason growth-heavy holdings in a broad index behave so differently from cash-generative holdings on a rate-shock day. Everything that follows builds directly on it.
When big ASX news breaks, our subscribers know first
How growth companies accumulate rate sensitivity over time
The equation you just saw applies to individual cash flows. A company, though, generates many cash flows spread across many years. The question becomes: where in time is most of that company’s value concentrated?
That is what equity duration measures. Equity duration is the effective average time at which a company’s future cash flows repay the price you paid today. It is also a direct measure of how sensitive that price is to changes in the discount rate. If you have encountered duration in the context of bonds, the concept is identical: longer duration means greater price sensitivity to rate moves.
Bond duration uses the same weighted-average logic: the longer a bond’s cash flows are spread into the future, the more its price falls when rates rise, with the Bloomberg US Aggregate losing 13.0% in 2022 precisely because its duration exposure amplified the Fed’s rapid tightening cycle.
The split between growth and value becomes clear when you look at where each type concentrates its value:
- Mature, cash-generative companies (value-tilted): a large share of their value sits in near-term cash flows, dividends, and current earnings. Lower duration. Less rate sensitivity.
- Growth-oriented companies: today’s profits are small or non-existent, and the bulk of value reflects earnings expected 5-20 years out. Higher duration. Substantially more rate sensitivity.
- The distinction is about timing, not quality: a dominant franchise with excellent long-run prospects can still be high-duration and therefore highly rate-sensitive.
According to MSCI’s published research, the MSCI USA Growth Index carries longer equity duration than the MSCI USA Value Index, with that duration difference driven by growth-related characteristics including elevated earnings growth forecasts and minimal current cash distributions to shareholders.
What this means for you is that your judgement of a company’s quality is genuinely separate from its duration exposure. Holding a great business does not protect you against rate-driven valuation compression if most of that business’s value sits far in the future. The sharpest rate-driven declines can hit the best companies in your portfolio, and understanding duration is how you stop mistaking a price move for a fundamental signal.
Separating mechanical price drops from genuine business deterioration
On a day when Treasury yields spike and your holdings fall, the decline could have two entirely separate origins. Identifying which one applies is the essential first step, because each demands a different course of action.
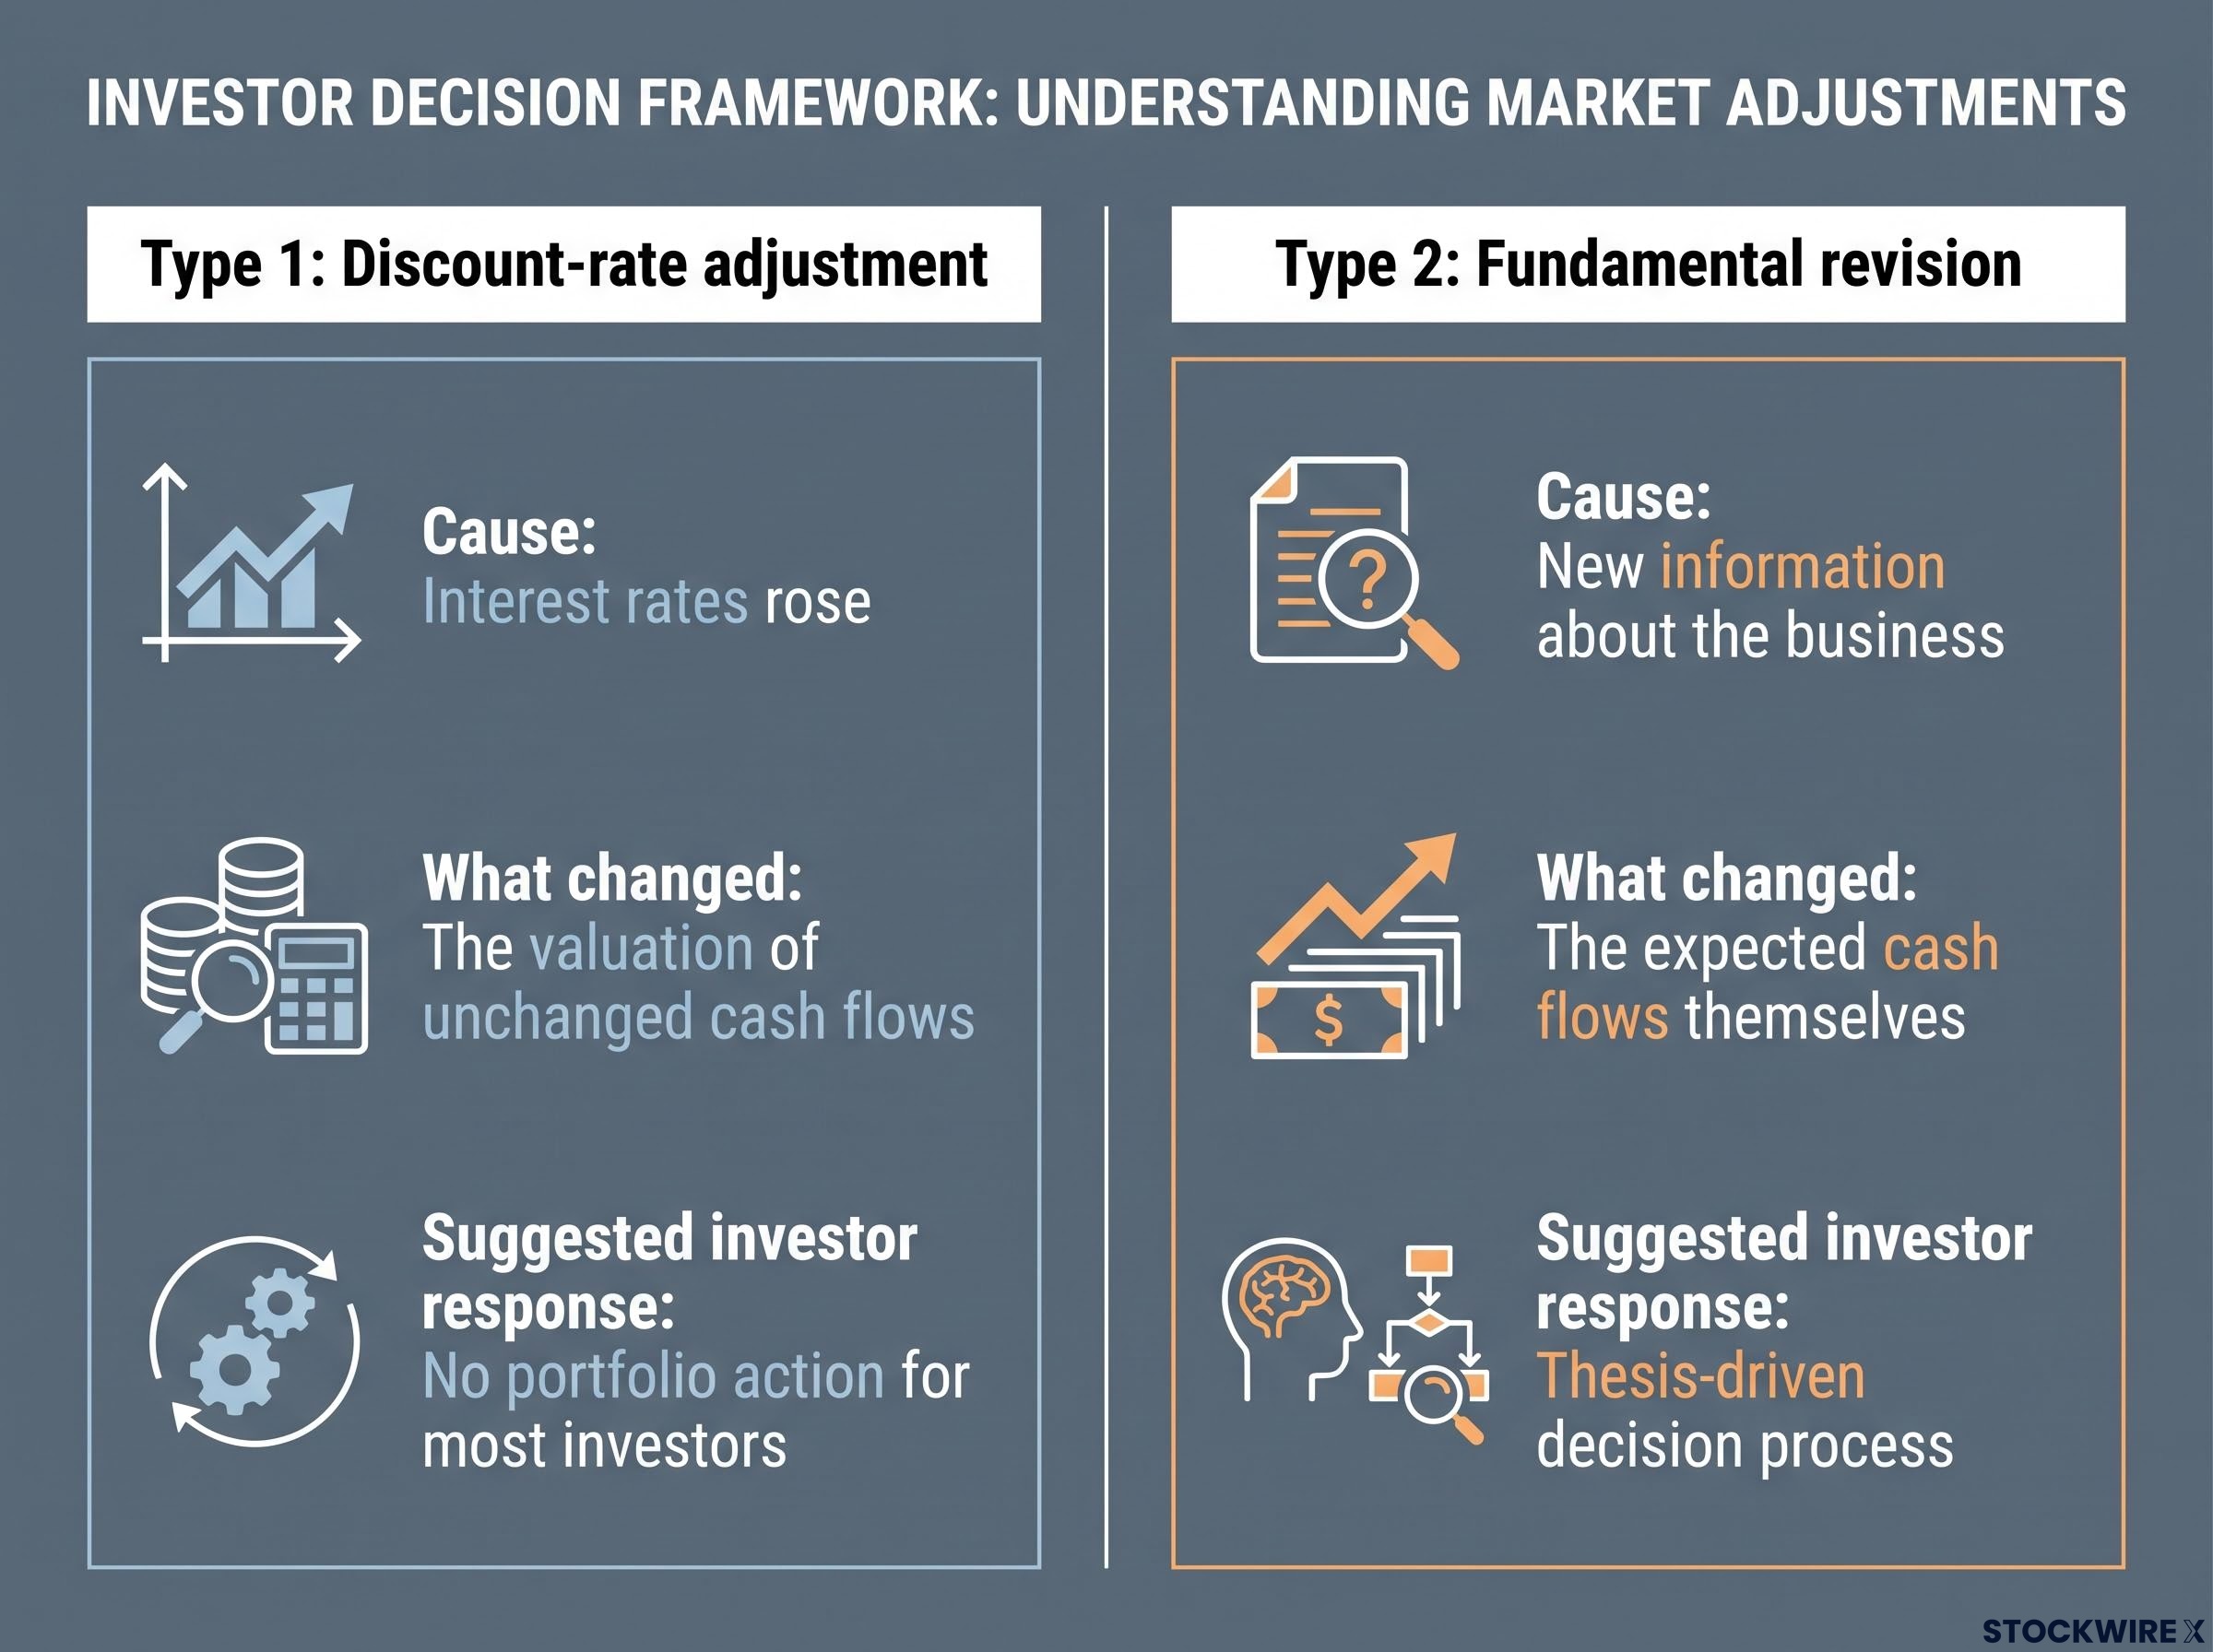
Type 1: a discount-rate adjustment. The rate used to discount future cash flows rose. Multiples compressed. The business itself has not changed; only the present value assigned to its unchanged cash flows has shifted downward. No new information about the company arrived.
Type 2: a fundamental revision. Expected cash flows themselves were revised downward because of an earnings miss, a competitive threat, a regulatory setback, or an operational problem. This is genuinely new information about the business.
A sentiment-driven pullback and a discount-rate adjustment share the same surface appearance: prices fall, headlines proliferate, and the account balance drops, but only one of them reflects a change in the business worth acting on.
| Attribute | Type 1: Discount-rate adjustment | Type 2: Fundamental revision |
|---|---|---|
| Cause | Interest rates rose | New information about the business |
| What changed | The valuation of unchanged cash flows | The expected cash flows themselves |
| Suggested investor response | No portfolio action for most investors | Thesis-driven decision process |
Morgan Stanley estimates that a 100 basis point increase in real yields explains 3-4 turns of multiple compression in U.S. growth stocks, with no new fundamental information required.
That number tells you something concrete: a large portion of a growth stock’s drawdown on a rate-shock day may be entirely mechanical. Research from Gormsen and co-authors formalises this distinction, finding that only pure discount-rate shocks, where rates change but growth expectations do not, move equity prices in proportion to their duration.
One nuance worth noting: rising yields sometimes coincide with improving growth expectations. In those cases, the positive effect on expected earnings can offset duration headwinds, particularly for cyclical names. But where the move is a pure rate shock, the duration-driven explanation is the operative one, and the 3-4 turns of multiple compression are not a signal to act on.
How cap-weighted index funds embed duration risk by construction
If you hold a broad market-cap-weighted index fund and noticed heavy drawdowns during the yield spikes of 2022-2023, the explanation is structural. Your fund’s largest positions were long-duration equities experiencing valuation compression, not businesses deteriorating in unison.
Cap-weighted index funds are dominated by very large technology and technology-adjacent firms whose valuations are driven by expected future growth rather than current payouts. These are, by construction, high-duration equities. Three structural features create this exposure:
- Sector concentration: Large-cap indexes weight heavily toward growth and technology names, which tend to carry longer duration profiles.
- Size weighting: The largest companies by market capitalisation are disproportionately growth-oriented, meaning they occupy the biggest portfolio positions.
- Valuation multiples of large constituents: The companies at the top of the index trade on growth-oriented multiples that embed expectations of earnings many years out.
MSCI’s own data show that its growth index carries longer duration and greater rate sensitivity than its value index. Broad diversification within a cap-weighted structure reduces the risk tied to any individual holding, but it leaves the systematic duration exposure embedded in the index’s growth and sector composition largely intact.
A drawdown in your index fund on a rising-yield day reflects, in part, the duration profile of its largest holdings. That duration exposure was not something you selected when you chose the fund. It came pre-loaded in the index’s construction methodology.
Index fund concentration compounds the duration exposure the current article describes: when five mega-cap technology stocks control roughly 23% of the broad market index and carry long equity duration profiles, a pure rate shock becomes structurally amplified through the index’s own weighting mechanics.
Why the current rate level recalibrates the value of every future cash flow
Everything discussed so far has been mechanism. Now apply it to the live environment.
The 10-year U.S. Treasury yield stands at approximately 4.74% as of early August 2026. At this level, the rate used to discount future equity cash flows is running well above the norms that prevailed for most of the past fifteen years, representing a meaningful shift in the valuation baseline for long-duration assets globally.
A mid-single-digit risk-free rate is not a slightly adjusted version of the near-zero era. It is a different valuation regime for long-duration assets. The differences are specific and measurable:
The FRBSF Treasury yield premium data decompose the 10-year yield into its underlying components, separating the pure expectations component from the term premium, which helps clarify how much of the current 4.74% level reflects genuine rate-path expectations versus compensation for duration risk.
- Hurdle rate for risky cash flows: At near-zero rates, the hurdle was low. At 4.74%, every risky cash flow must clear a meaningfully higher bar to justify its current price.
- Competitive pressure from safe assets: When Treasuries yield close to 5%, capital has a genuine risk-free alternative. Growth stocks must offer a proportionally larger premium to attract the same investment.
- Implied multiple compression for high-duration equities: Growth-stock valuation damage tends to accelerate once the 10-year yield rises above approximately 4.5%, because the hurdle rate for risky cash flows becomes genuinely competitive with risk-free alternatives.
At 4.74%, growth-heavy positions face a discount rate that substantially narrows their present value relative to what it was in the near-zero era. Any sizing or return expectation calibrated to that earlier environment deserves fresh scrutiny. That yield figure is not a backdrop detail. It is the active input currently being applied to the value of every asset you hold.
The mental model that keeps rate-driven declines in their proper place
You now have the mechanical framework. The practical question is how to deploy it whenever yields move and your portfolio responds unevenly.
The core diagnostic runs in two steps:
- Determine the cause. Did the decline coincide with a pure rate move (Treasury yields rose, no new company-specific information arrived), or did it coincide with new fundamental information (earnings miss, guidance revision, regulatory development)?
- Assign it to the correct category and respond accordingly. If the math changed but the business did not, the decline is a valuation adjustment and warrants no portfolio action for most investors. If the business changed, the decline warrants a thesis-driven decision about whether your original investment case still holds.
Growth-heavy holdings and broad cap-weighted funds will fall more on pure discount-rate days. Cash-generative, lower-duration names will tend to be more resilient. Neither outcome implies the underlying companies are worse businesses.
One additional point: when a growth company matures sufficiently to generate substantial near-term cash flows, its equity duration compresses and its sensitivity to rate moves falls along with it. Until that shift takes place, however, the rate sensitivity is structural. A stock whose value sits predominantly in the future will always carry greater exposure to discount-rate movements than one whose value is anchored in near-term earnings. That is a permanent feature of the mathematics, not a temporary condition tied to any particular market cycle.
When yields spike and the size of a decline unsettles you, the most productive question you can ask is a precise one: which type of cause drove this move, and does it change anything about my investment thesis?
Holding long-duration equities deliberately in a high-rate environment
The growth-stock sensitivity to interest rates is not an anomaly to wait out. It is a permanent mathematical property that will persist as long as these companies concentrate their value in the future. At 4.74%, that property is active and material.
None of this means you should avoid long-duration equities. It means you should hold them with your eyes open. If you understand duration, you know what a yield move will do to valuations and why. You can distinguish a mechanical price adjustment from genuine deterioration. You can size positions with the rate environment in mind rather than against the memory of a near-zero world.
For investors wanting a practical tool that makes rate sensitivity tangible at the individual stock level, our full explainer on the implied growth rate framework converts any share price into the minimum annual revenue growth the company must deliver for the investment to justify its current discount rate.
The practical difference between investors who carry this framework and those who do not shows up most clearly on volatile days. Investors who understand duration can place a rate-driven drawdown into its proper category quickly and move on. Investors without that framework find themselves searching for narratives that explain a price move the business itself never produced. One group gains clarity from volatility; the other accumulates noise.
The most consequential shift in thinking is a simple one: from “why is my portfolio falling” to “which type of decline is this, and does it require action from me.”
This article is for informational purposes only and should not be considered financial advice. Investors should conduct their own research and consult with financial professionals before making investment decisions. Past performance does not guarantee future results. Financial projections are subject to market conditions and various risk factors.