Non-U.S. equities have not outperformed the United States for a full calendar year since the 2000s. In 2026, they are doing exactly that, and the catalyst accelerating the gap may not be an earnings cycle or a central bank pivot but a diplomatic negotiation between Washington and Tehran. Yardeni Research’s “Go Global” thesis, initiated in December and reaffirmed as of 26 May 2026, argues that a prospective U.S.-Iran peace agreement could compress oil prices and redirect capital toward energy-importing economies across Europe and emerging markets. With Brent crude near $100 per barrel, partly reflecting Strait of Hormuz risk premium, the potential for supply relief is not a distant abstraction. Polymarket data assigns a 39-47% probability to a near-term framework agreement. This article unpacks the full investment logic: why cheaper oil benefits Frankfurt more than Houston, what the valuation gap between U.S. and international equities implies for forward returns, which markets have already moved, and where the genuine risks lie.
A diplomatic opening is already moving markets before any deal is signed
The interesting dynamic in mid-2026 is not whether a U.S.-Iran deal gets signed. It is that the anticipation of conflict resolution has already become sufficient to shift capital flows.
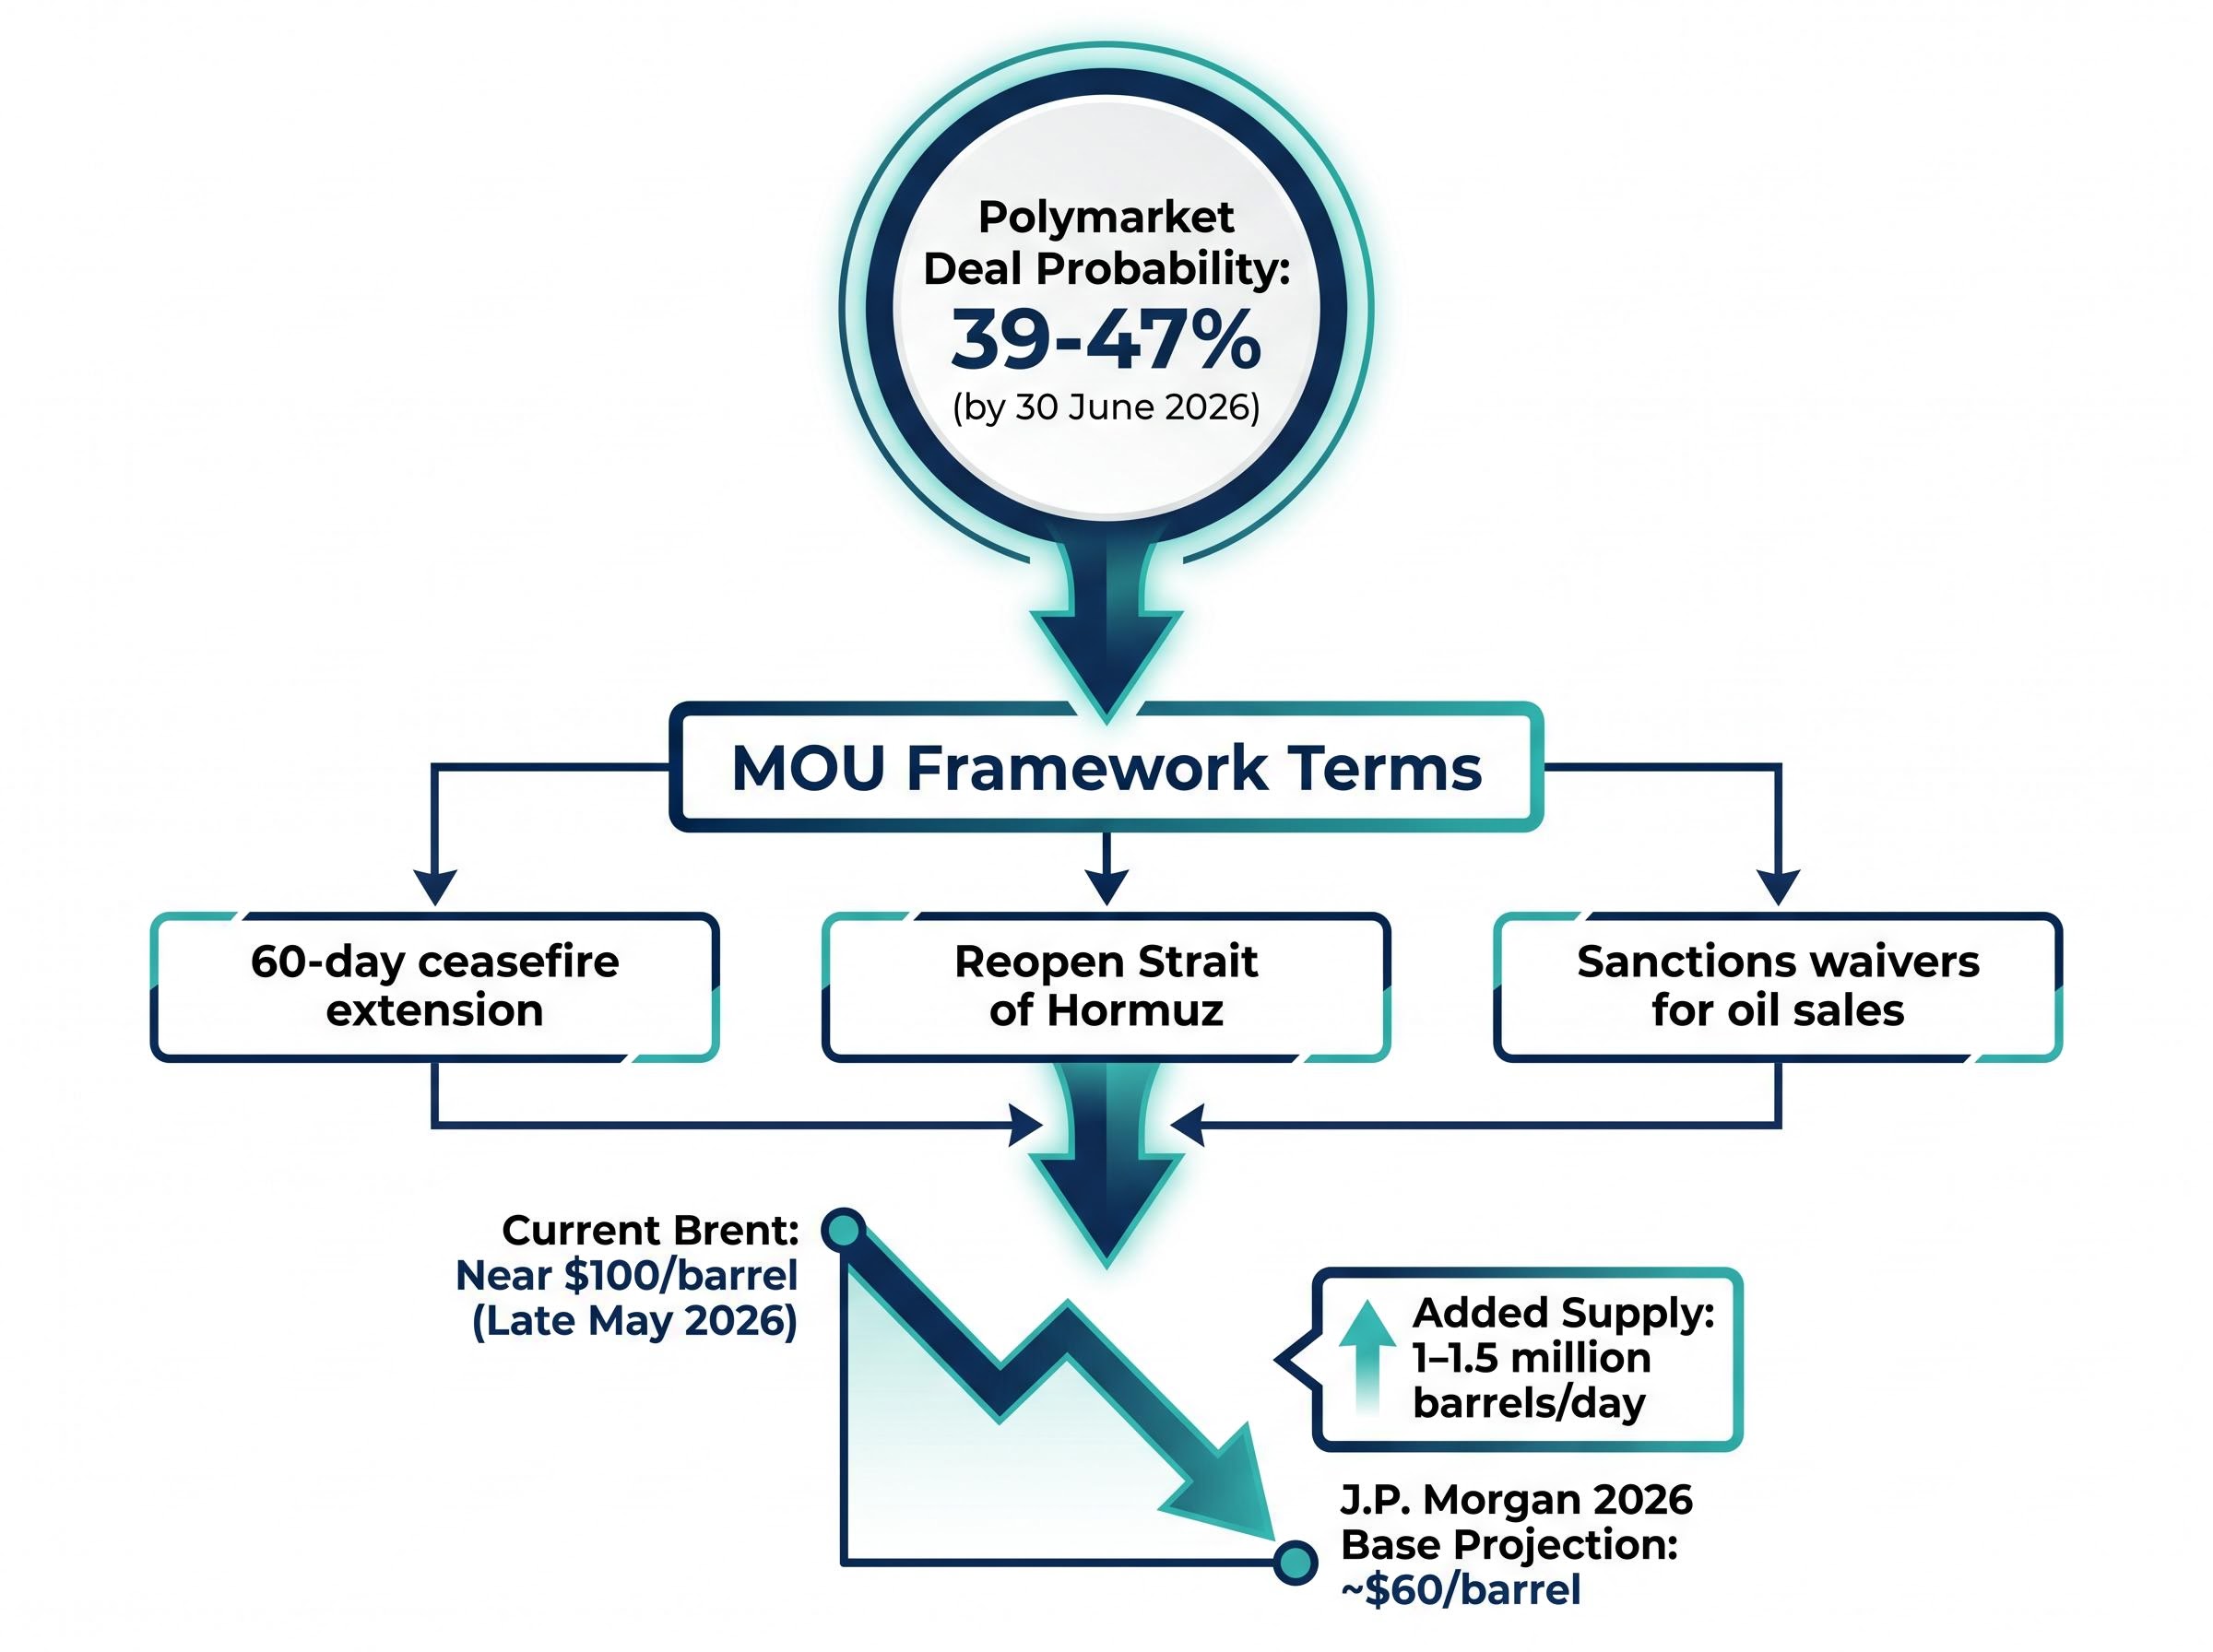
Yardeni Research’s central claim rests on this distinction. Markets price probabilities, not certainties, and the current probability is high enough to matter. Multiple rounds of U.S.-Iran negotiations have proceeded since April 2025, including indirect and episodic engagement, a temporary ceasefire announced in April 2026, and renewed momentum toward a memorandum of understanding (MOU) framework in May 2026. The MOU under discussion would establish a 60-day ceasefire extension, reopen the Strait of Hormuz, and permit Iran to sell oil under sanctions waivers while initiating negotiations on curbing the country’s nuclear programme.
Polymarket assigns approximately 39-47% probability to a nuclear-related agreement by 30 June 2026, placing this firmly in the range of a credible but not certain near-term scenario.
None of this requires a signed deal to generate market effects. Brent crude traded near $99-100 per barrel in late May 2026, with a documented geopolitical risk premium as a contributing factor. The forward-looking mechanism, where expectations alone move positioning, is the analytical foundation for the performance data and regional opportunity analysis that follows.
The market’s sensitivity to diplomatic signals was confirmed on 25 May 2026, when a preliminary US-Iran framework sent Nasdaq 100 futures up 1.4% and pushed Brent below $100 per barrel for the first time since the Strait of Hormuz closure began, a single-session move that illustrates how much risk premium remains available to compress if a formal agreement progresses.
When big ASX news breaks, our subscribers know first
How cheaper oil becomes a profit engine for energy-importing economies
The transmission mechanism from geopolitics to corporate earnings runs through a structural asymmetry between the United States and the rest of the developed world. The U.S. achieved energy self-sufficiency, meaning lower oil prices compress revenues for the domestic energy sector while providing limited net economic gain at the aggregate level. Energy-importing economies receive an unambiguous cost reduction.
Germany sits at the extreme end of this spectrum within Europe. Chemical producers, industrial manufacturers, and automotive groups are all directly exposed to energy input costs. The post-Russia-Ukraine energy shock made this vulnerability acutely visible, and elevated oil prices tied to Strait of Hormuz risk have sustained that structural drag through 2026. A reversal would unwind a meaningful portion of the cost disadvantage that has weighed on German and broader European industrial margins for nearly four years.
The global oil supply shock driving current Brent prices has structural features that distinguish it from previous supply disruptions: Saudi crude output fell to a 36-year low in April 2026, global inventories are drawing at more than double the previous record pace, and IEA data projects no supply-demand rebalancing before October 2026, meaning the risk premium in Brent pricing reflects a genuine physical shortage rather than speculative positioning alone.
Sanctions relief could suppress oil prices through three distinct mechanisms:
- Incremental Iranian supply of an estimated 1-1.5 million barrels per day returning to global markets
- Compression of the geopolitical risk premium currently embedded in Brent pricing
- OPEC+ strategic response, though potential Saudi-led cuts could partially offset the supply addition
J.P. Morgan projects Brent averaging approximately $60 per barrel for 2026 under soft fundamental conditions, with other bank forecasts ranging from $55 to $100 per barrel depending on the scenario. The gap between current prices near $100 and the base-case forecast illustrates how much risk premium is priced in, and how much margin relief could flow to energy-importing economies if that premium compresses.
The institutional crude oil price forecasts for 2026 compiled across major banks show a wide dispersion, with J.P. Morgan projecting Brent averaging near $60 per barrel under soft fundamental conditions while other forecasters place the range as high as $100, a spread that itself quantifies how much the geopolitical risk premium is doing in current pricing.
| Economy | Net oil position | Key energy-exposed sectors | Impact of lower oil on margins |
|---|---|---|---|
| United States | Net self-sufficient | Energy producers, shale, refining | Mixed (energy sector negative, consumers positive) |
| Germany | Major net importer | Chemicals, industrials, automotive | Strongly positive |
| Eurozone (broader) | Net importer | Manufacturing, transport, utilities | Positive |
| South Korea | Major net importer | Semiconductors, shipbuilding, petrochemicals | Positive |
The valuation gap that makes the international thesis more than a macro story
Even before any diplomatic outcome materialises, the numbers suggest international equities are structurally cheap on their own terms.
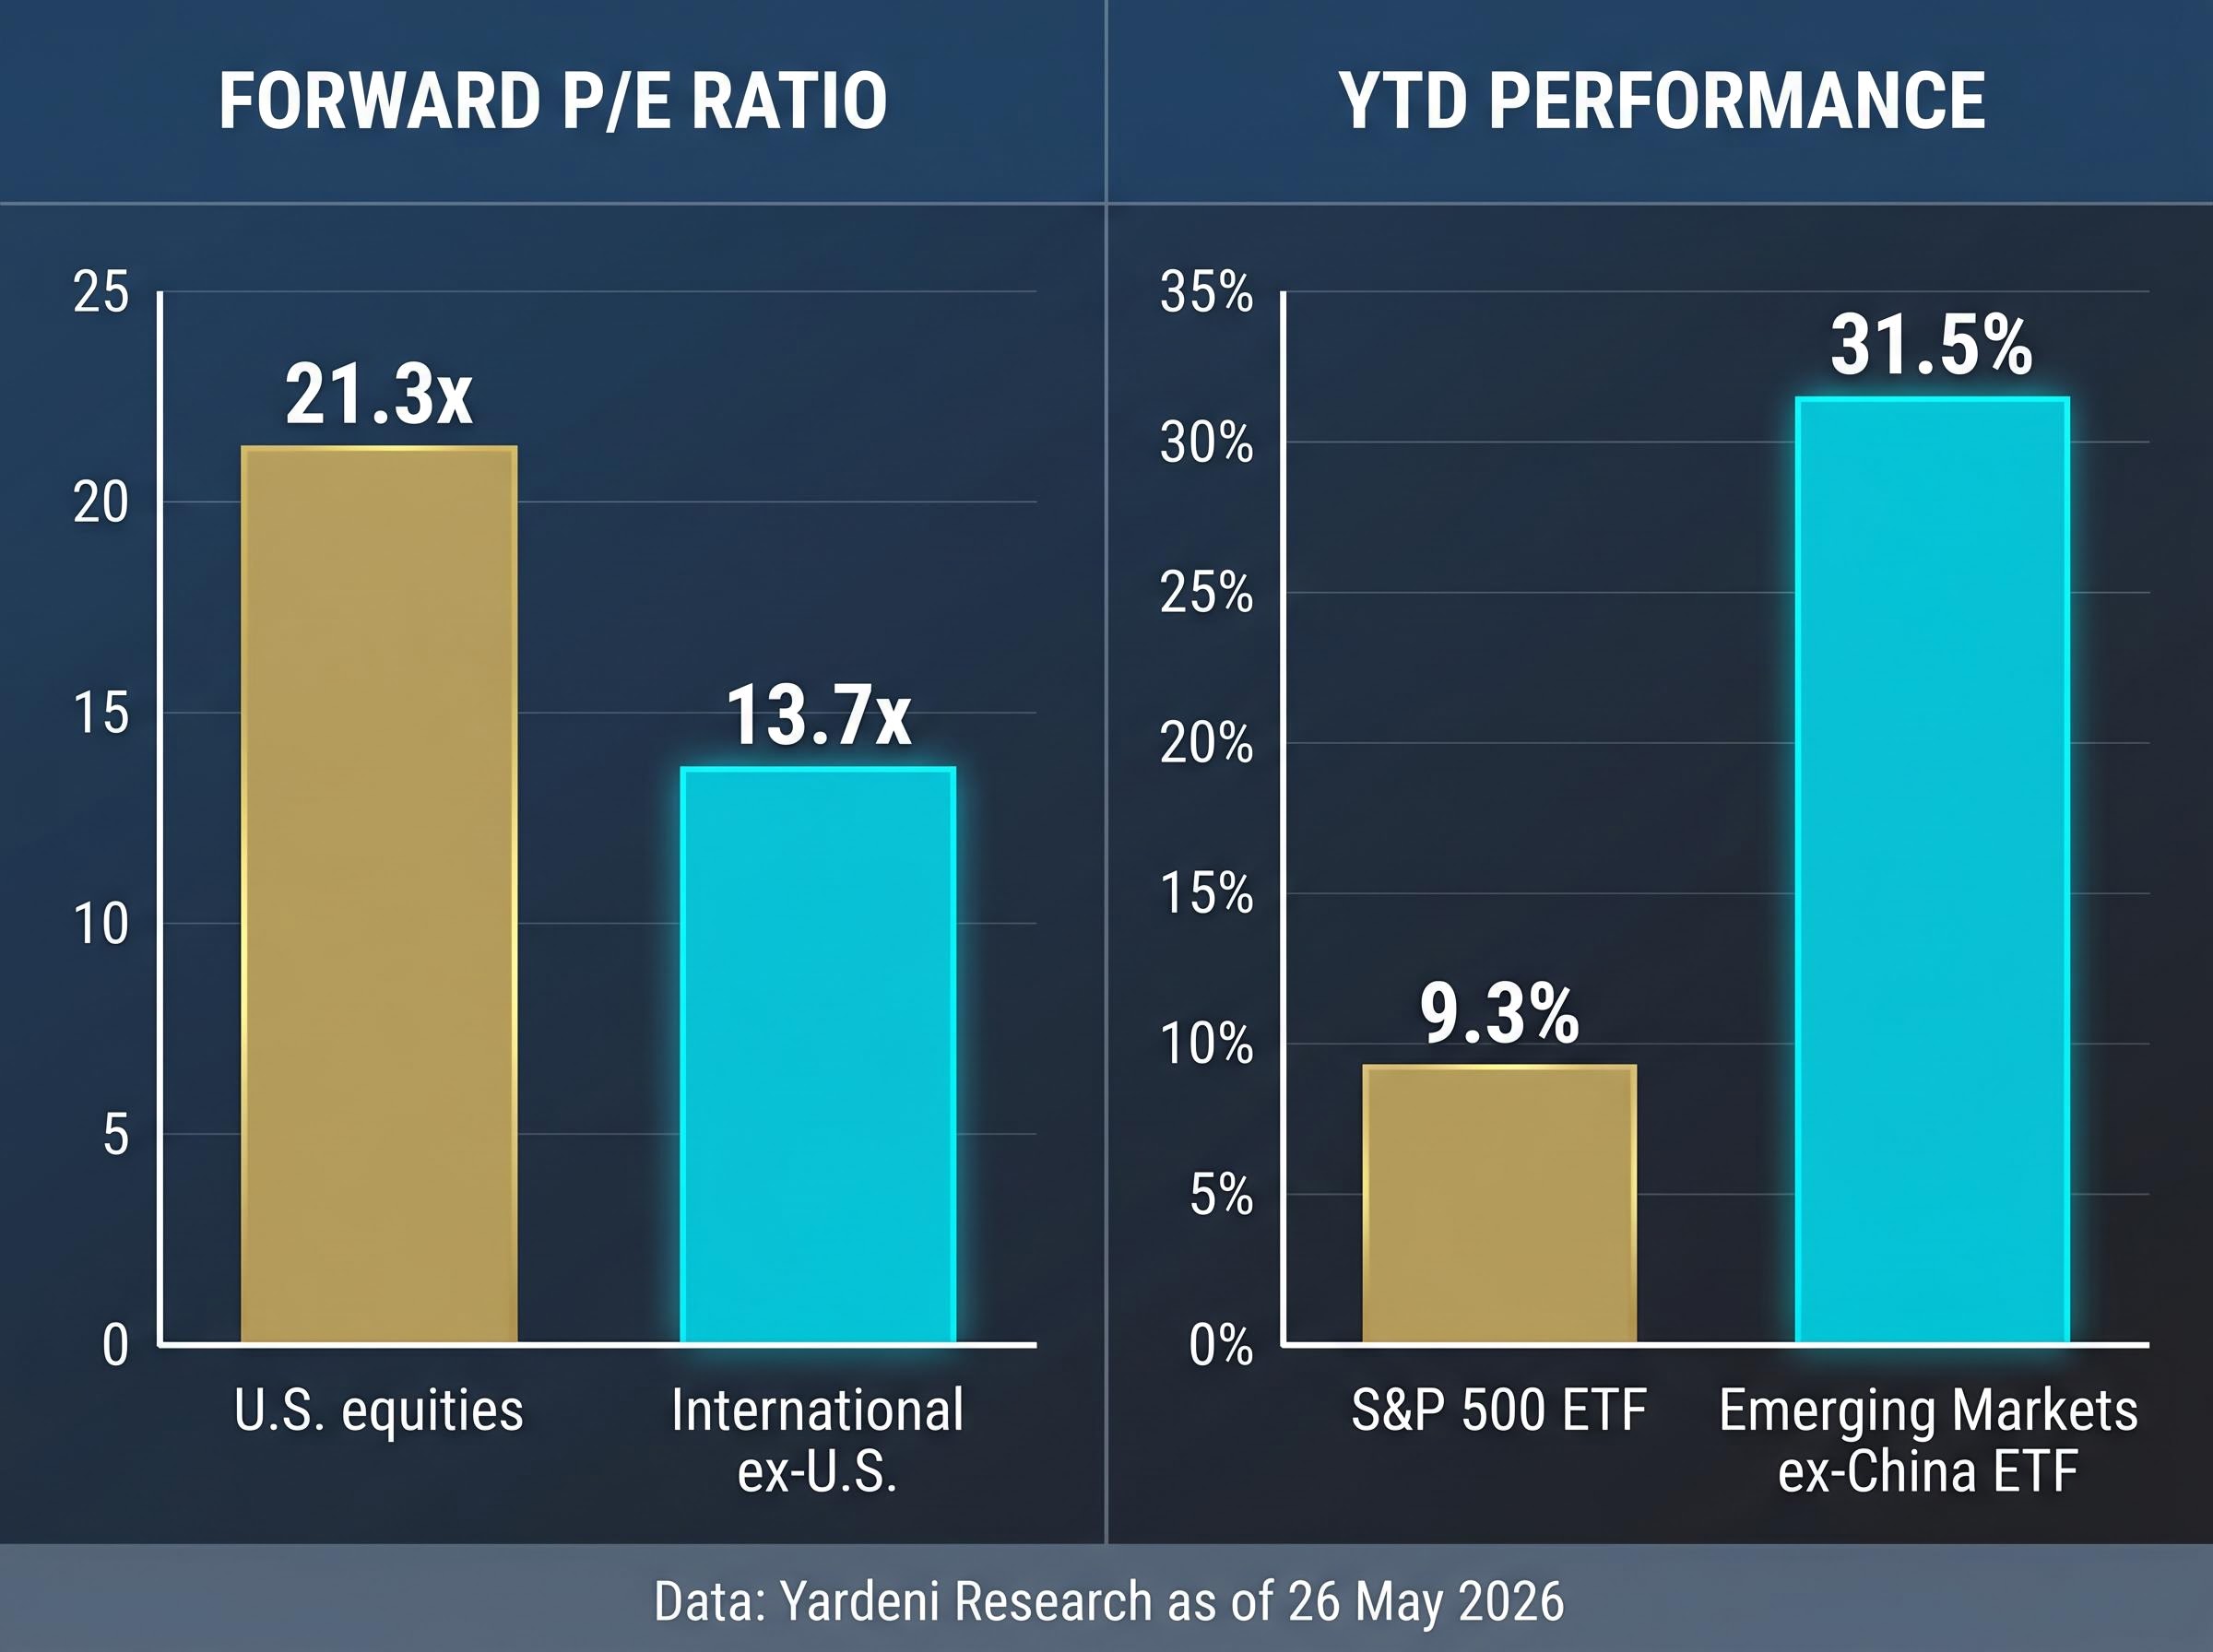
According to Yardeni Research data as of 26 May 2026, U.S. equities trade at a forward price-to-earnings (P/E) ratio of approximately 21.3x, while the rest of the world sits at approximately 13.7x. That is a differential of more than 7 turns, a gap wide enough to imply meaningfully different forward return expectations for capital allocated to each side.
The MSCI All Country World ex-U.S. index has outperformed the U.S. MSCI index over the prior year and into 2026, the first such outperformance in roughly two decades according to Yardeni Research.
The performance data reinforces the valuation argument. The Emerging Markets ex-China ETF has delivered approximately 31.5% year-to-date gains versus approximately 9.3% for the S&P 500 ETF as of 26 May 2026. This is not a marginal difference; it is a gap of more than 22 percentage points in less than five months.
| Market / Index | Forward P/E | YTD performance (26 May 2026) |
|---|---|---|
| U.S. equities | 21.3x | ~9.3% (S&P 500 ETF) |
| International ex-U.S. | 13.7x | Outperforming U.S. (first time since 2000s) |
| Emerging Markets ex-China | Below U.S. average | ~31.5% |
For investors assessing whether the rotation is a short-term trade or a structural repositioning, the valuation data provides the durability argument. The forward P/E ratio measures how much investors pay for each dollar of expected earnings over the next twelve months. At 13.7x, international equities are priced for considerably lower expectations than their U.S. counterparts at 21.3x, meaning they require less earnings growth to justify current prices.
Where the gains are already happening, and which markets could move next
The rotation is not a forecast. Parts of it have already occurred, and the regional scoreboard reveals distinct drivers for each market segment.
- AI-driven Asian outperformers already in motion
- Broader emerging markets delivering strong year-to-date returns
- Europe and Germany as the pending oil-sensitive opportunity
Asia’s semiconductor surge and what drove it
South Korea and Taiwan have been the standout performers of 2026, and the catalyst has nothing to do with oil. Yardeni Research data shows South Korean equities have gained approximately 87.2% year-to-date as of 26 May 2026, while Taiwan has returned approximately 52.4% over the same period. Both markets are riding AI-related semiconductor demand, a structural earnings driver rooted in global capital expenditure on artificial intelligence infrastructure.
This leg of the rotation has already repriced. The question for investors is how much further it can extend before semiconductor valuations reflect the earnings surge.
Europe and Germany: the trade that needs an oil price catalyst
The European picture is different. The Euro Stoxx 50 has posted positive year-to-date returns of approximately 2.4-5.75% through late May 2026, with the DAX showing approximately 2-3% gains through February data with continued positive momentum. These are respectable but modest figures compared to Asia.
The gap exists because the AI semiconductor catalyst that propelled South Korea and Taiwan does not apply in the same way to German industrial exporters. The European trade is explicitly tied to the oil and conflict resolution thesis: if the MOU progresses and Brent declines toward base-case levels, energy-intensive German and European firms would see direct margin improvement. Until that catalyst materialises, European equities may continue to lag their Asian counterparts in the rotation.
The risks that could derail the rotation thesis
The most powerful counterargument to the international equity thesis is straightforward: U.S. mega-cap technology and AI earnings concentration may continue to justify elevated valuations. If the P/E gap reflects a genuine growth differential rather than simple inefficiency, the rotation could stall regardless of what happens in the Strait of Hormuz.
Beyond U.S. earnings strength, four distinct risk categories could undermine the thesis:
The risk in the current setup is that oil markets pricing a deal have moved ahead of the diplomatic reality: Reuters reporting from 22-23 May characterised negotiations as near collapse due to an unresolved sequencing impasse over Iran’s enriched uranium stockpile, and bank scenario analysis projects Brent could spike to $110-150 per barrel if talks break down and Hormuz disruption risks escalate.
- U.S. earnings exceptionalism: Concentration of AI-related investment and monetisation in U.S. equities could sustain outperformance despite high valuations
- Geopolitical escalation keeping oil elevated: Sustained Israel-Iran tensions, IRGC activity, and broader Middle East instability could push prices higher rather than lower; years of underinvestment in Iranian oil infrastructure also mean rapid supply ramp faces practical constraints even with sanctions relief
- China demand and emerging market headwinds: Continued weakness in the Chinese property sector, uncertain consumer confidence, and shifting regulatory priorities could weigh on emerging market indices and Asian exporters dependent on Chinese final demand
- USD resurgence and Fed-ECB divergence: A resurgent U.S. dollar, driven by the Federal Reserve remaining relatively tighter than the European Central Bank (ECB) or by deteriorating global risk sentiment triggering safe-haven flows, would reduce USD-based returns from foreign assets and directly challenge the thesis that dollar weakness amplifies non-U.S. equity outperformance
OPEC+ dynamics add a further layer of complexity. Potential Saudi-led production cuts could partially offset the supply addition from Iranian barrels, limiting the oil price downside that the European trade depends upon.
What the rotation signals about where global capital is moving in 2026
The Yardeni Research “Go Global” thesis rests on two independent legs, and neither requires the other to function, though both working simultaneously would produce the strongest outcome.
The first leg is structural: at 21.3x forward P/E versus 13.7x for the rest of the world, international equities are priced for lower expectations, meaning less needs to go right for investors to earn satisfactory returns. This valuation gap exists regardless of what happens in Tehran.
Multiple US equity overvaluation signals converge independently on the same conclusion: the Buffett Indicator stood at 223.6% as of May 2026, approximately 2.4 standard deviations above its long-run trend and well above dot-com peak levels, providing a structural context for why capital is seeking forward return opportunities outside the US regardless of what happens in Tehran.
U.S. forward P/E: 21.3x versus rest-of-world: 13.7x, a differential of more than 7 turns according to Yardeni Research as of 26 May 2026.
The second leg is cyclical: if the MOU progresses toward a comprehensive agreement, the oil channel activates, energy prices decline, European industrial margins recover, and the valuation gap provides a margin of safety for investors entering at current prices. If diplomacy stalls, the Asian AI semiconductor trade retains independent momentum, as South Korea’s 87.2% year-to-date return demonstrates.
The historical significance should not be understated. A two-decade pattern of U.S. equity dominance is showing signs of disruption, supported not by vague rotation hopes but by specific mechanisms: a documented valuation differential, a live geopolitical catalyst with a quantifiable probability, and regional performance data that has already confirmed the early stages of the shift.
The bottom line on a two-decade shift in global equity leadership
International equities are outperforming U.S. markets for the first time in roughly 20 years. The valuation gap is historically wide. A specific geopolitical catalyst, the potential U.S.-Iran agreement, exists that could accelerate the divergence by compressing oil prices and releasing margin pressure on energy-importing economies.
Two variables deserve monitoring: progress on the U.S.-Iran MOU framework and the Brent crude price response as the leading indicator of whether the European leg of the trade is activating. The thesis is probabilistic. A 39-47% deal probability reflects genuine uncertainty, and the rotation could stall if U.S. earnings growth reasserts dominance or dollar strength returns.
This article is for informational purposes only and should not be considered financial advice. Investors should conduct their own research and consult with financial professionals before making investment decisions. Forward-looking statements regarding diplomatic outcomes and oil price projections are speculative and subject to change based on geopolitical developments and market conditions.