
Japan’s 10-year government bond yield has moved from around 0.2% at the start of 2022 to roughly 2.7% by July 2026. That is not a normalisation footnote. That is a structural repricing of the world’s third-largest economy after three decades of near-zero rates.
With the Bank of Japan’s policy rate now at 1.00% following the June 2026 hike, the question is no longer whether Japan’s rate cycle has arrived. The question is who absorbs the gains, who absorbs the losses, and whether Japan’s sovereign credit profile, carrying gross debt above 200% of GDP, can hold its footing as funding costs rise. Morningstar DBRS published its latest sovereign assessment today, 6 August 2026, affirming an A (high) Stable rating, but the conditions underpinning that stability are specific and testable.
This analysis maps the actual distribution of winners and losers across Japan’s financial system, explains the sovereign debt arithmetic that determines whether the rating holds, and gives investors in JGBs or Japanese bank equities a clear framework for what to watch next.
Megabanks are printing record profits, and the rate cycle is only partly responsible
The numbers landed in the fiscal year ended March 2026, and they were hard to ignore. Japan’s three megabanks reported combined net income of approximately ¥5.26 trillion, a figure that would have been difficult to imagine five years ago when compressed margins were treated as a permanent condition.
MUFG led with ¥2.43 trillion in net income, up 30% year-on-year. SMFG followed at ¥1.58 trillion, up 34%, with its domestic loan-to-deposit spread widening approximately 18 basis points to 1.14%. Mizuho posted ¥1.25 trillion, up 41%, the sharpest growth rate of the three.
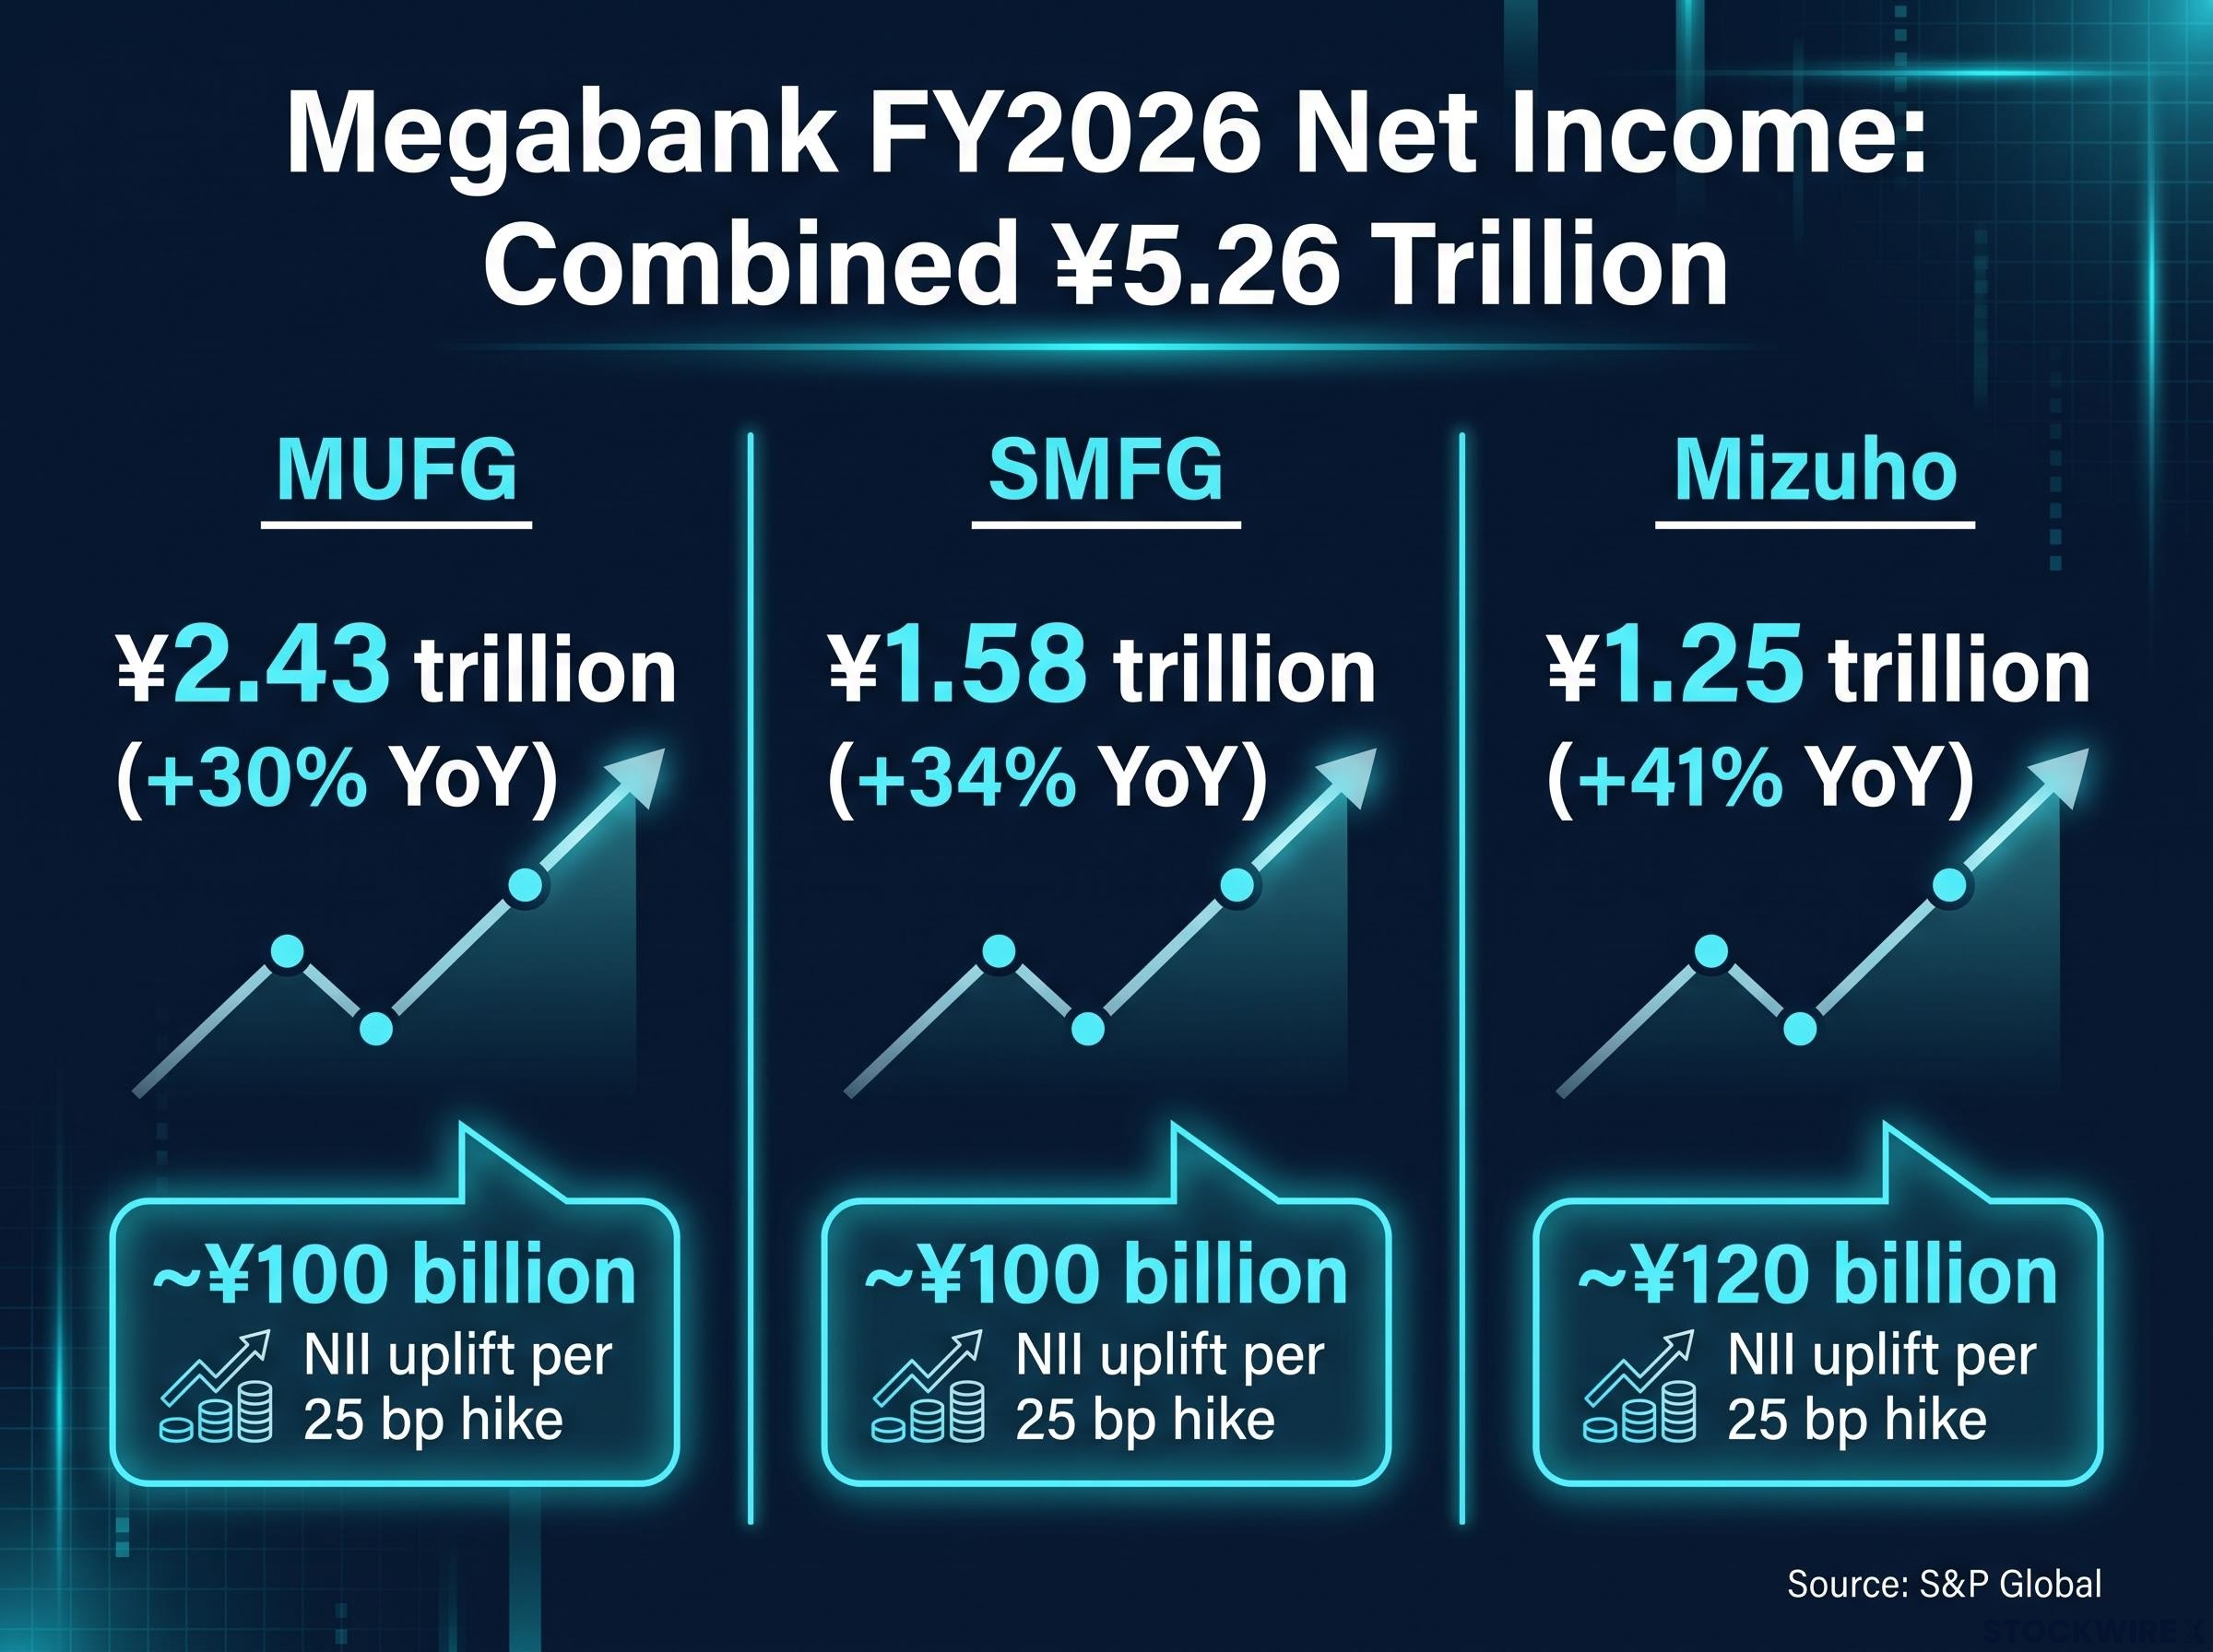
| Bank | FY2025 net income | Year-on-year growth | Est. NII uplift per 25 bp hike |
|---|---|---|---|
| MUFG | ¥2.43 trillion | +30% | ~¥100 billion |
| SMFG | ¥1.58 trillion | +34% | ~¥100 billion |
| Mizuho | ¥1.25 trillion | +41% | ~¥120 billion |
A Morningstar DBRS report dated 21 July 2026 confirmed that the major banking groups are seeing a substantial earnings boost from rising domestic rates and expanding loan books. According to S&P Global, each 25 basis point policy rate hike adds roughly ¥100 billion per year in net interest income for MUFG and SMFG, and approximately ¥120 billion for Mizuho. The earnings tailwind is quantifiable and, as long as rates continue rising or hold at current levels, ongoing.
The June 2026 BoJ rate hike mechanics, including the 7-1 board vote, the structured JGB tapering schedule, and the explicit inflation rationale centred on yen weakness and oil prices, set the conditions that the megabank earnings figures are now reflecting.
But the earnings story is not as clean as the headline numbers suggest.
S&P Global estimates the net operating profit effect of higher yen rates at approximately +3% for the three megabanks: a 12% boost from loan interest income offset by a 9% drag from unrealised bond losses.
That 9% drag matters. It tells you megabank earnings are not a pure rate-sensitivity play. Unrealised losses on existing bond portfolios are a real offset, and if yield curves steepen unexpectedly, that drag can widen. Equity investors have a rare window where each incremental hike is directly accretive to core earnings, but they should price in the bond-portfolio friction rather than treating the full 30-41% growth rate as the new baseline.
When big ASX news breaks, our subscribers know first
Regional banks face the same rate environment but a structurally different exposure
The megabank earnings surge has made it tempting to treat “Japanese banks” as a single beneficiary of rate normalisation. Regional banks tell a different story.
The structural difference is concentrated long-duration JGB holdings. Regional banks, particularly those with weaker loan franchises, have historically relied more heavily on bond portfolios for income. When yields rise, the market value of those existing long-maturity bonds falls. IRRBB (interest rate risk in the banking book, the measure of how much a bank’s equity value shifts when rates move) captures this exposure. The BoJ’s April 2026 Financial System Report shows that system-level yen IRRBB relative to capital has remained low on average, but that average masks a tail of more exposed regional institutions.
The BoJ Financial System Report published in April 2026 quantifies system-level yen IRRBB relative to capital, confirming that the average remains low but that the distribution across institutions includes a tail of more exposed regional banks that the headline figure obscures.
S&P Global explicitly anticipates polarisation: loan-intermediation-focused banks benefit, while securities-heavy or weaker-franchise banks remain under pressure. Reuters and S&P both flag regional banks holding long-maturity JGBs as disproportionately exposed to unrealised losses.
Three structural factors separate the most vulnerable regional banks from the megabanks:
- Business model concentration: Heavy reliance on bond portfolio income rather than diversified fee and lending income
- JGB maturity profile: Longer-duration bond holdings that produce larger mark-to-market losses per basis point of yield increase
- Earnings diversification: Limited international or fee-based income streams to absorb domestic bond portfolio pressure
The BoJ is increasing scrutiny of whether lenders fully understand how their deposits, loans, and securities portfolios will respond to further rate increases. Both BoJ and AMRO confirm that banks have strengthened asset-liability management overall, but this is a directional improvement, not a universal guarantee.
What to look for before treating “Japanese banks” as a single trade
For investors screening Japanese financial sector equities, the system-level resilience assessment is reassuring but not actionable without institution-level analysis. Three signals matter most: the share of total assets held in fixed-income securities, the weighted average maturity of the bond portfolio, and the presence or absence of active hedging programmes. If you cannot assess these for a specific regional bank, the megabank template does not transfer safely.
What higher rates actually mean for Japanese households, and why wages decide everything
Higher rates should help savers and hurt borrowers. That is the intuitive expectation. The reality is more lopsided than the theory suggests.
Deposit rates have risen from effectively zero, but banks are currently offering approximately 0.20% on ordinary deposits, even as their profits reach record levels and the policy rate sits at 1.00%. The gap between those two numbers tells macro watchers that the household sector is not yet receiving the full benefit of normalisation. A meaningful share of the rate-cycle dividend is being retained by bank margins rather than redistributed to savers.
Bloomberg characterised the dynamic as banks that “boom” while shoppers “scrimp,” a framing that captures the distributional tension between financial sector income gains and consumer purchasing power.
On the borrower side, variable-rate mortgage holders and households with revolving credit are seeing real cost increases. Transmission from the policy rate to retail lending rates has been faster than transmission to deposit rates, which is how banks widen margins but also how households feel the squeeze first.
Corporate survey data from mid-2026 reinforces the pressure: approximately 50% of Japanese firms report negative business impacts from BoJ rate hikes, with higher funding costs discouraging capital investment.
The variable that resolves this tension is wages. Recent wage negotiations delivered the strongest nominal increases in decades, and if that trajectory holds, household financial positions remain resilient. If wage growth decelerates while funding costs continue climbing, consumption headwinds build. The transmission chain runs three ways:
- Household consumption resilience: wages must exceed the combined drag from higher mortgage costs and inflation
- Nominal GDP trajectory: household spending feeds directly into the growth figures sovereign analysts track
- Sovereign debt-service arithmetic: nominal GDP growth is the numerator in the equation that determines whether Japan’s debt ratio stabilises or rises
Wages are not just a household data point. They are simultaneously a retail indicator, a corporate earnings signal, and a sovereign credit variable.
Japan’s sovereign debt arithmetic: the g-versus-r equation and stability conditions
Morningstar DBRS affirmed Japan’s A (high) Stable sovereign rating today, 6 August 2026, as assessed by analysts Rohini Malkani and Thomas R. Torgerson. The rating is the analytical anchor for understanding Japan’s position, but the conditions underpinning it are specific.
Among advanced economies, Japan carries the largest government debt burden, with gross debt standing at approximately 200.8-204.4% of GDP as of early-to-mid 2026. By any international comparison, the number is extreme.
Sovereign debt sustainability thresholds are frequently misread by anchoring on a single ratio rather than on the structural conditions that determine whether that ratio is stable, and cross-country evidence from the UK and Japan shows that domestic investor bases, maturity profiles, and the g-versus-r dynamic matter far more than the headline percentage alone.
Three structural buffers prevent that ratio from translating into immediate sovereign stress:
- Average JGB maturity of approximately eight years: the roughly eight-year average term means newly issued debt at higher rates displaces existing cheaper obligations slowly, so rising market yields take years rather than months to lift the government’s overall funding cost
- Deep domestic investor base: banks, insurers, pension funds, and the BoJ hold the bulk of JGBs, reducing exposure to sudden foreign investor flight
- Reliable market access: the government has continued to place debt successfully even as the BoJ has scaled back its bond purchases, demonstrating that private demand fills the gap without requiring exceptional pricing
| Metric | Value |
|---|---|
| Gross debt / GDP | ~200.8-204.4% |
| Average JGB maturity | ~8 years |
| 10-year yield (early 2022) | ~0.2% |
| 10-year yield (July 2026) | ~2.7% |
| BoJ policy rate | 1.00% |
| DBRS sovereign rating | A (high) Stable |
Proposals for expanded public investment, including a long-term economic strategy associated with Sanae Takaichi, have raised questions about the pace of fiscal consolidation, though the near-term direct fiscal impact is assessed as limited.
The g-versus-r equation in practice
The sovereign equation reduces to one condition. When nominal GDP growth (g) runs ahead of the government’s effective interest rate on debt (r), the debt ratio has a natural tendency to stabilise or decline even without large primary surpluses. When r persistently outpaces g, however, achieving debt stability requires the government to run primary surpluses large enough to cover the gap.
That equation is currently favourable. BoJ normalisation and global rate spillovers, rather than a fiscal risk premium, appear to be the dominant forces behind the yield increase. But the margin is not wide. Corporate surveys showing approximately 50% of firms reporting negative rate impacts are directly relevant here: suppressed corporate investment reduces nominal GDP potential, narrowing the gap between g and r.
For JGB investors, the A (high) Stable rating is not a static guarantee. It holds as long as nominal GDP growth remains above the government’s effective borrowing cost, which means the rating’s resilience is directly tied to the wage and growth data that sovereign analysts will be watching every subsequent quarter.
Normalisation or warning signal? Reading yield moves in the context of Japan’s rate history
A 2.7% yield on a 10-year Japanese government bond sounds unremarkable if you benchmark it against US Treasuries or European sovereigns. Benchmarked against Japan’s own history, it is a different story entirely.
Japan’s policy rate was effectively zero or negative for most of the period from the late 1990s through early 2024. The BoJ operated yield curve control for years, meaning market participants were not setting prices freely. Current yields represent the first genuinely market-set JGB prices in years. In that context, the move from 0.2% to 2.7% is not an incremental adjustment. It is the market rediscovering what Japanese government risk is worth without central bank suppression.
The analytical question is what is driving the yield higher, because the credit implications differ sharply depending on the source:
- Stronger growth prospects: credit positive, because higher yields reflect a healthier economy with stronger tax revenue potential
- Global rate spillovers: credit neutral, because yields are rising in sympathy with other sovereign markets rather than reflecting Japan-specific deterioration
- Elevated fiscal risk premium: credit negative, because the market is pricing in doubt about Japan’s ability to service its debt
For any sovereign analyst evaluating Japan, the critical judgement is whether the yield move represents an orderly return to normal pricing, or whether it contains an early signal that markets are beginning to price in meaningful fiscal stress.
Across Morningstar DBRS, the BoJ, and the broader analytical community, the prevailing view is that the rise in yields is primarily the product of policy normalisation and the global repricing of rates. The fiscal consolidation debate and spending proposals associated with Takaichi are relevant variables for the medium-term trajectory, but they have not yet shifted the yield composition toward a risk premium interpretation.
The July 2026 hold also brought carry trade unwind risk back into focus, with the BoJ’s dissenting board member pressing for an immediate hike to 1.25% and the U.S. Treasury formally labelling the yen undervalued, adding a bilateral diplomatic dimension that operates independently of any scheduled BoJ meeting.
What this tells you is that the meaningful benchmark is Japan’s own rate history and the extent to which the yield increase reflects an economy returning to normal rather than a sovereign credit deteriorating, not the absolute number compared against economies with structurally higher inflation. The same 2.7% number means something very different depending on which force is driving it.
What the balance of evidence tells investors positioned in JGBs or Japanese bank equities
The threads across this analysis converge on three monitoring variables, and on one variable that integrates them all.
For financial sector equity investors, the megabank versus regional bank divergence is the first-order sorting mechanism. Sector exposure is not enough. Institution-level duration and hedging analysis is required. For JGB investors, the sovereign assessment is conditionally stable, the g-versus-r equation is the live variable, and the data that feeds it arrives quarterly.
The three variables that deserve ongoing tracking:
- Nominal wage growth trajectory: a positive reading is sustained increases above inflation and rising interest expenses; a negative reading is deceleration, which tightens conditions across household, corporate, and sovereign balance sheets simultaneously
- Corporate investment data: positive is capital expenditure holding or rising despite higher funding costs; negative is a sustained pull-back that reduces nominal GDP growth potential
- The spread between effective government borrowing cost and nominal GDP growth: positive is g comfortably exceeding r; negative is the gap narrowing toward zero or inverting
For JGB investors: the sovereign arithmetic watch list
Track quarterly nominal GDP releases relative to the government’s effective interest cost, wage settlement data from the annual Shunto negotiations, and any policy signals from the Ministry of Finance on fiscal consolidation pace. The eight-year average maturity buffer means deterioration in the g-versus-r equation would take multiple years to fully transmit into government cash flows. That provides a meaningful adjustment window, but not an unlimited one.
For bank equity investors: beyond the sector narrative
Identify whether a target institution’s income is predominantly loan-based or securities-based. Assess the duration profile of the bond portfolio. Verify whether hedging programmes are sufficient to absorb a further 100 basis point yield increase. The megabank earnings tailwind, with each 25 basis point hike adding ¥100-120 billion in annual net interest income, is real and quantifiable. But applying the megabank template to regional bank analysis without adjustment is the specific analytical error this analysis is designed to prevent.
BoJ and AMRO both assess that banks have strengthened asset-liability management and maintain sufficient loss-absorbing capacity. The framing is “manageable but not costless,” and that conditionality is the point. Japan’s rate normalisation is currently being absorbed without systemic stress, but the margin of safety is not wide. Wages are the single most efficient indicator to track across all positions simultaneously, because they feed household resilience, nominal GDP, corporate investment appetite, and sovereign debt arithmetic at the same time.
For investors wanting to reconcile the sovereign debt concerns with Japan’s equity market performance, our full explainer on Japan’s 2026 market outlook examines how the IMF, OECD, and Moody’s each assessed debt sustainability alongside the institutional positioning data that explains why capital continued flowing into Tokyo.
This article is for informational purposes only and should not be considered financial advice. Investors should conduct their own research and consult with financial professionals before making investment decisions. Past performance does not guarantee future results. Financial projections are subject to market conditions and various risk factors.