Apple’s AI Bet Is a Services Play, Not an iPhone Supercycle
1 hr ago

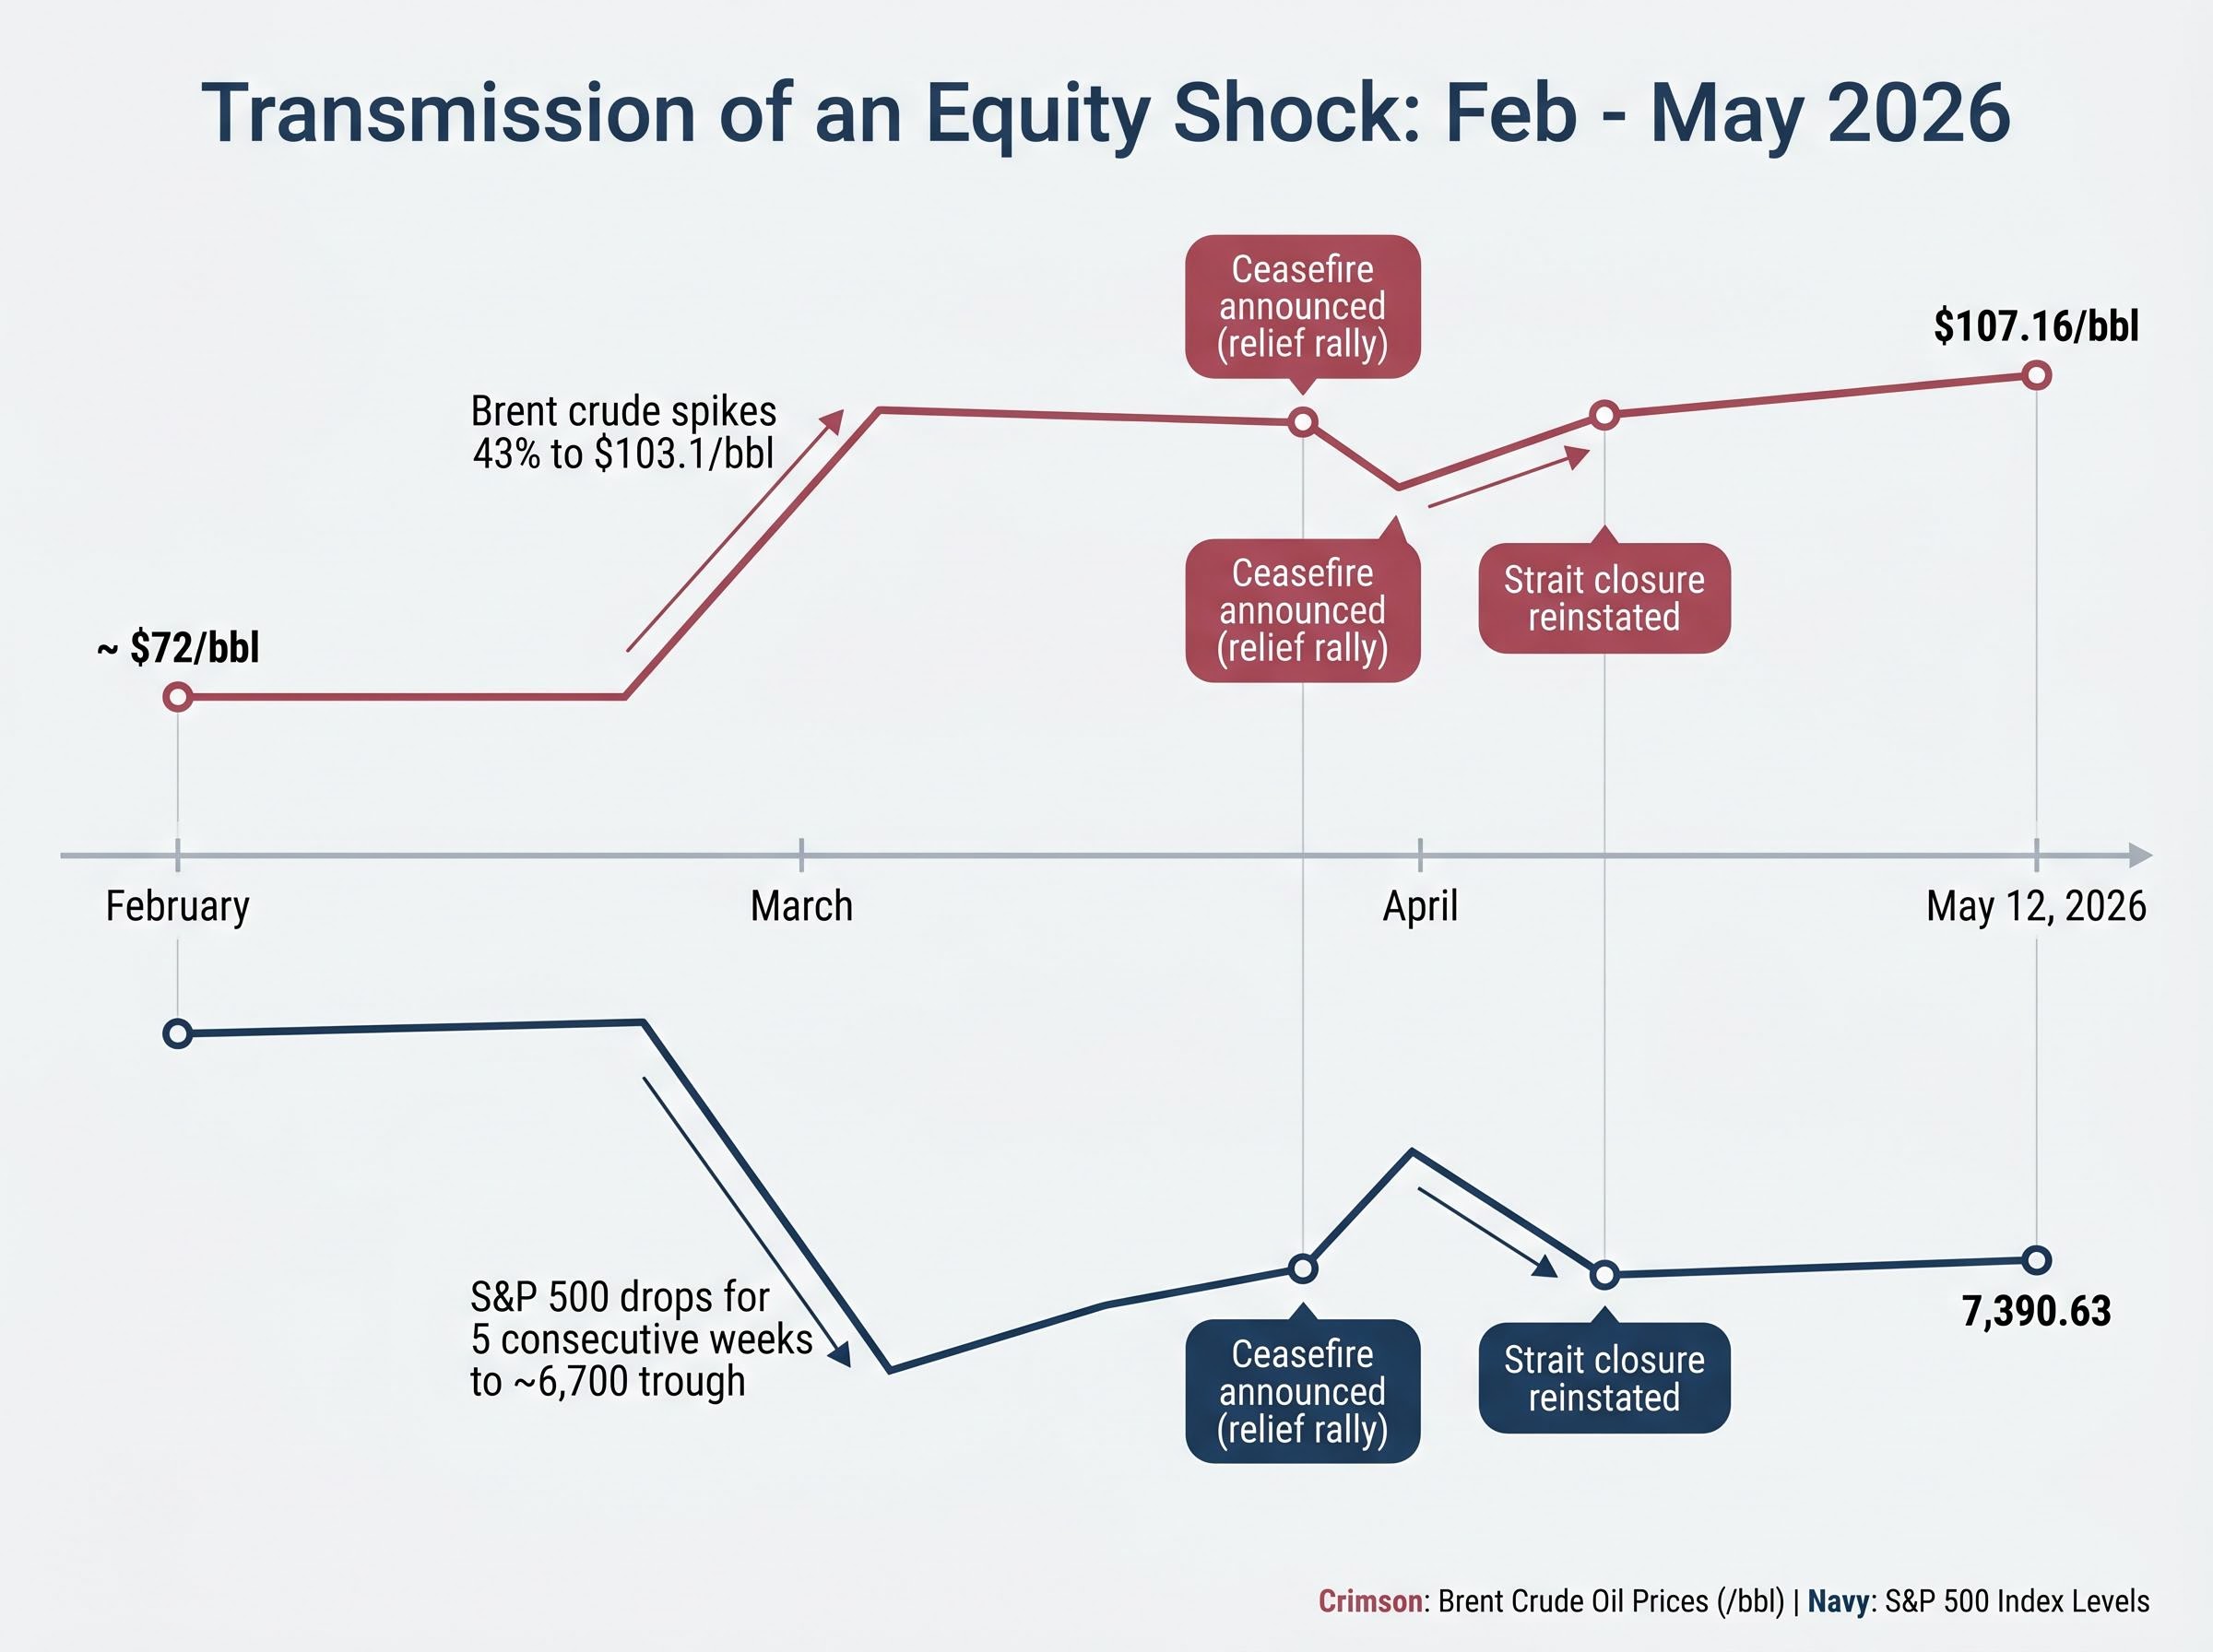
The S&P 500 fell for five consecutive weeks in March 2026, a streak that has occurred only twice in the prior fifteen years. The trigger was not a domestic recession, a banking failure, or a policy error. It was a conflict eight thousand miles away that closed the Strait of Hormuz, a waterway carrying roughly one fifth of the world’s oil, and repriced risk across global equity markets within weeks.
Brent crude surged from approximately $72 per barrel in February to more than $103 in March, a 43% spike that transmitted through energy costs, corporate margin expectations, and consumer sentiment simultaneously. As of 12 May 2026, the S&P 500 has partially recovered from its March lows near 6,700 to close at 7,390.63, but the conflict remains unresolved. The Trump administration has described the ceasefire as “on life support,” and elevated volatility shows no sign of retreating.
What follows draws on Fisher Investments’ institutional analysis alongside independent data to examine how the shock unfolded, why the market’s response follows a recognisable historical pattern, and what the divergence between current sentiment and underlying fundamentals means for investors watching the second half of 2026.
The Iran conflict produced many headlines, but only one mechanism mattered for equity markets: the Strait of Hormuz closure. Understanding the transmission chain, rather than the geopolitical narrative around it, separates signal from noise.
The causal sequence moved in three steps:
EIA data on Strait of Hormuz transit volumes confirms the chokepoint carries approximately 20% of global petroleum liquids consumption, a concentration that makes even a partial or temporary closure sufficient to reprice oil markets within days rather than weeks.
Brent crude rose from approximately $72 to $103.1 per barrel in a single month, a 43% spike that repriced risk across US equity markets.
That five-week losing streak is a historically rare pattern. In the prior fifteen years, it has occurred only twice: in 2011 and 2022. Both episodes were associated with distinct macroeconomic shocks, and both preceded extended periods of volatility before resolution.
The 8 April ceasefire announcement triggered an immediate rally, but the move was driven by short-covering rather than a shift in fundamentals. Hedge funds unwinding bearish positions created the appearance of recovery without the underlying resolution to sustain it.
That distinction became concrete on 18 April, when Iran reinstated the Strait of Hormuz closure. The relief trade reversed. As of 12 May 2026, Brent crude stands at $107.16/bbl, up 2.83% on the day and 7.85% month-over-month. The headline risk from this conflict is not historical. It remains live.
Historical precedent does not predict outcomes, but it establishes a baseline probability distribution. The question is which features of past energy-driven shocks match the current situation, and which do not.
The recurring gap between geopolitical risk and stock market behaviour is not a 2026 anomaly; markets process conflict as a probability-adjusted input to future earnings rather than a proportional headline shock, which is why Goldman Sachs strategists attributed S&P 500 performance in April 2026 to approximately 12% EPS growth rather than the geopolitical narrative surrounding it.
NBER research on geopolitical risk and energy markets documents a consistent pattern in which geopolitical shocks increase both price levels and volatility in energy commodities, providing the academic foundation for the recovery probability distributions the article draws on from prior conflict episodes.
The Russia-Ukraine 2022 episode provides the most relevant comparison. That conflict produced an approximately 10-15% initial S&P 500 drawdown, a roughly 40% spike in energy-related measures, and a recovery timeline of approximately 6-9 months as markets adapted to a new supply reality. The five-week consecutive decline pattern in March 2026 mirrors the early-phase behaviour of the 2022 episode closely.
| Conflict | Energy shock type | Approx. initial S&P 500 drawdown | Recovery timeline | Pre-conflict valuation context |
|---|---|---|---|---|
| Gulf War 1990-91 | Oil supply disruption (Middle East) | Not confirmed in current data | Not confirmed in current data | Moderate valuations |
| Russia-Ukraine 2022 | Energy supply shock (~40% spike) | ~10-15% | ~6-9 months | Elevated but not extreme |
| Iran conflict 2026 | Strait of Hormuz closure (~43% oil spike) | ~4.7-5% (March); ongoing | Unresolved | Historically extended |
Fisher Investments’ institutional framework identifies several conditions under which equity markets historically recover from energy-driven geopolitical shocks:
These conditions form a pattern to monitor rather than a guarantee. One variable complicates the analogy: equity valuations entering 2026 were historically extended, reducing the margin of safety that cushioned earlier episodes. That distinction may extend the drawdown duration compared to the 2022 template.
Historical recovery patterns from energy shocks share one assumption: that the Federal Reserve retains the flexibility to support growth while supply disruptions resolve. In 2026, that assumption is under pressure.
Stagflation, where inflation persists alongside stagnant or declining economic growth, operates through a three-part mechanism that is now active:
BlackRock CEO Larry Fink has framed the oil-driven economic outlook as presenting “two extremes”: abundance-driven growth on one end, or recession on the other. The middle ground is narrowing.
Institutional analysts have drawn comparisons to the 1970s energy crisis, though direct equity market quantification of that parallel remains contested.
Prior to the conflict, markets had priced in approximately 50 basis points of rate cuts for 2026. That trajectory has inverted. Rate cut expectations have reversed, and potential rate increases are now under discussion.
This shift is the variable that makes the forward scenario genuinely binary rather than a question of timing. If the Fed raises rates to combat oil-driven inflation, it suppresses the earnings recovery that equity bulls are counting on. If it holds or cuts, it risks allowing inflation to become entrenched. Historical recovery timelines of 6-12 months assumed a Fed that had room to act. That room has narrowed materially.
Fed rate policy frozen at 3.50%-3.75% for a fifth consecutive meeting, with core PCE at 3.2% and JPMorgan raising its stagflation probability to 35%, has created a set of valuation dislocations that sit directly beneath the binary scenario framework the current conflict has imposed: technology, growth, and small-cap equities are trading at historically rare discounts while energy has already repriced from the most undervalued to the most overvalued sector in 2026.
The anxiety itself may be constructive. Fisher Investments’ institutional framework identifies a pattern they characterise as the “wall of worry”: a divergence between subdued investor sentiment and solid underlying fundamentals that has historically preceded the next leg of a bull market.
Fisher Investments characterises the current wall of worry as a historically bullish condition, noting that markets tend to climb when the weight of concern is heaviest and visible risks are loudest.
The consumer confidence and stock market divergence reached a historically extreme point in April 2026, when the University of Michigan’s sentiment index hit a record low of 49.8 while the S&P 500 traded near all-time highs, a gap that historical precedent, including the 2022 sentiment trough, suggests has tended to coincide with market bottoms rather than the beginning of sustained declines.
Several sentiment indicators have reset meaningfully since the conflict began:
Fisher Investments draws a specific contrast between the current cautious sentiment environment and the more confident attitudes that characterised the post-2025 recovery period. That reset is meaningful rather than cosmetic: the 2025 correction left investors positioned for continuation, whereas the current conflict has forced a genuine reassessment.
Fisher Investments’ institutional forecast calls for a continuing bull market, with stronger performance anticipated in the second half of 2026. The firm distinguishes between current headline-driven anxiety, which it views as temporary, and a genuine deterioration in economic fundamentals, which it has not identified. That distinction drives their continued bullish positioning.
Behind the Iran conflict headlines sits a second variable that institutional frameworks increasingly identify as material: the approaching November 2026 US midterm elections.
Fisher Investments’ “US Midterm Miracle” thesis holds that approaching midterm elections create political incentive structures that favour conflict resolution, and that the likely post-election shift toward legislative gridlock is historically favourable for equity returns. The mechanism is straightforward: administrations facing electoral accountability are incentivised to resolve costly conflicts before voters reach the ballot box.
The Trump administration’s position reinforces this dynamic. Low approval ratings specifically on Iran war handling, combined with voter prioritisation of affordability and war costs, create direct political pressure toward de-escalation. Democrats are positioning to leverage both war management and economic concerns for potential Congressional gains.
The two binary outcomes for markets, drawn from the HBKS Wealth and Fisher Investments frameworks, diverge sharply:
A shift in Congressional control, which current political dynamics suggest is possible, could alter energy policy, sanctions frameworks, and defence spending trajectories. Fisher Investments characterises the resulting legislative gridlock as a structural tailwind: divided government limits the passage of market-disrupting policy in either direction, reducing tail risk from regulatory or tax changes. This dynamic has been observed across multiple midterm cycles, and the firm identifies it as a recurring pattern specific to the US political system.
For investors wanting to understand the political tailwind mechanism in greater depth, our full explainer on the midterm election stock market cycle walks through the 15.4% average S&P 500 gain in the 12 months following midterms since 1950, examines the specific H1 weakness and Q4 recovery pattern that cycle analysts have mapped onto 2026, and identifies the macro conditions under which the pattern has historically broken down.
The S&P 500 at 7,390.63 as of 12 May sits at the intersection of two divergent paths. The institutional consensus, drawn from HBKS Wealth, Goldman Sachs, and BlackRock, identifies conflict resolution as the single variable that determines which path materialises.
HBKS Wealth has characterised geopolitical resolution as “the single most important variable” for equity market direction in the second half of 2026.
| Dimension | Resolution scenario | Protracted conflict scenario |
|---|---|---|
| Oil price trajectory | Normalises toward pre-conflict range (~$72/bbl) | Sustained above $100/bbl through H2 2026 |
| Fed policy path | Resumes rate cut trajectory | Policy dilemma persists; rate hikes possible |
| Equity market outlook | New highs possible by late summer/autumn 2026 | Extended volatility; earnings compression |
| Recession probability | Low; growth trajectory restores | Rising but below base case (Schwab threshold: >6 months of conflict) |
The expert positioning consensus, characterised by Charles Schwab as a “wait for clarity” stance, leans against aggressive risk addition in the current environment. JPMorgan Asset Management has emphasised diversification as the primary risk management tool, a view echoed across multiple institutional frameworks.
The framework above is not a prediction. It is a map of the decision tree. The practical question for investors is not whether markets will recover (history suggests they will) but on what timeline and at what cost to the recovery trajectory that was already in progress before the Strait of Hormuz closed.
Geopolitical shocks have repeatedly proven less durable in their market impact than feared at onset. The Russia-Ukraine episode, the Gulf War, and prior oil disruptions all resolved faster in equity terms than the headlines at their peaks would have suggested. Fisher Investments’ institutional framework, which forecasts stronger performance in the second half of 2026, rests on this historical foundation.
The foundation, however, is conditional. The stagflation mechanism and the Fed’s narrowing policy corridor introduce a structural complication that not all prior episodes shared. As of 12 May 2026, the conflict timeline remains open, the Strait of Hormuz remains contested, and oil remains above $100 per barrel.
The appropriate response to calibrated uncertainty is neither paralysis nor aggression. It is knowing which variables to watch: Strait of Hormuz status, oil price trajectory, and Fed signalling. These three indicators, more than any individual headline, will determine whether the second half of 2026 follows the historical recovery script or rewrites it.
This article is for informational purposes only and should not be considered financial advice. Investors should conduct their own research and consult with financial professionals before making investment decisions. Past performance does not guarantee future results. Financial projections are subject to market conditions and various risk factors.
The Strait of Hormuz is a critical maritime chokepoint through which approximately 20% of the world's oil supply transits. When it is closed or disrupted, oil prices spike rapidly, compressing corporate margins and triggering equity market selloffs, as seen in March 2026 when Brent crude surged 43% in a single month.
The Iran conflict triggered a rare five-week consecutive decline in the S&P 500, pushing the index to a trough near 6,700 in March 2026 before a partial recovery to 7,390.63 by 12 May 2026. The shock was transmitted through the Strait of Hormuz closure, a 43% oil price spike, and deteriorating corporate margin expectations.
Based on historical precedent, including the Russia-Ukraine 2022 episode, equity markets have typically recovered within approximately 6-12 months of a geopolitical energy shock onset, with recovery accelerating once supply disruptions normalise, regardless of whether a formal peace agreement is in place.
Stagflation refers to a combination of persistent inflation and stagnant or declining economic growth, and it is a key risk in the current environment because the Strait of Hormuz closure has kept oil above $100 per barrel, pushing up costs across the economy while simultaneously suppressing business investment and growth expectations.
Institutional frameworks highlight three variables as the most critical to watch: the operational status of the Strait of Hormuz, the trajectory of Brent crude oil prices, and Federal Reserve policy signalling, since these three factors will determine whether the second half of 2026 follows historical recovery patterns or deviates from them.