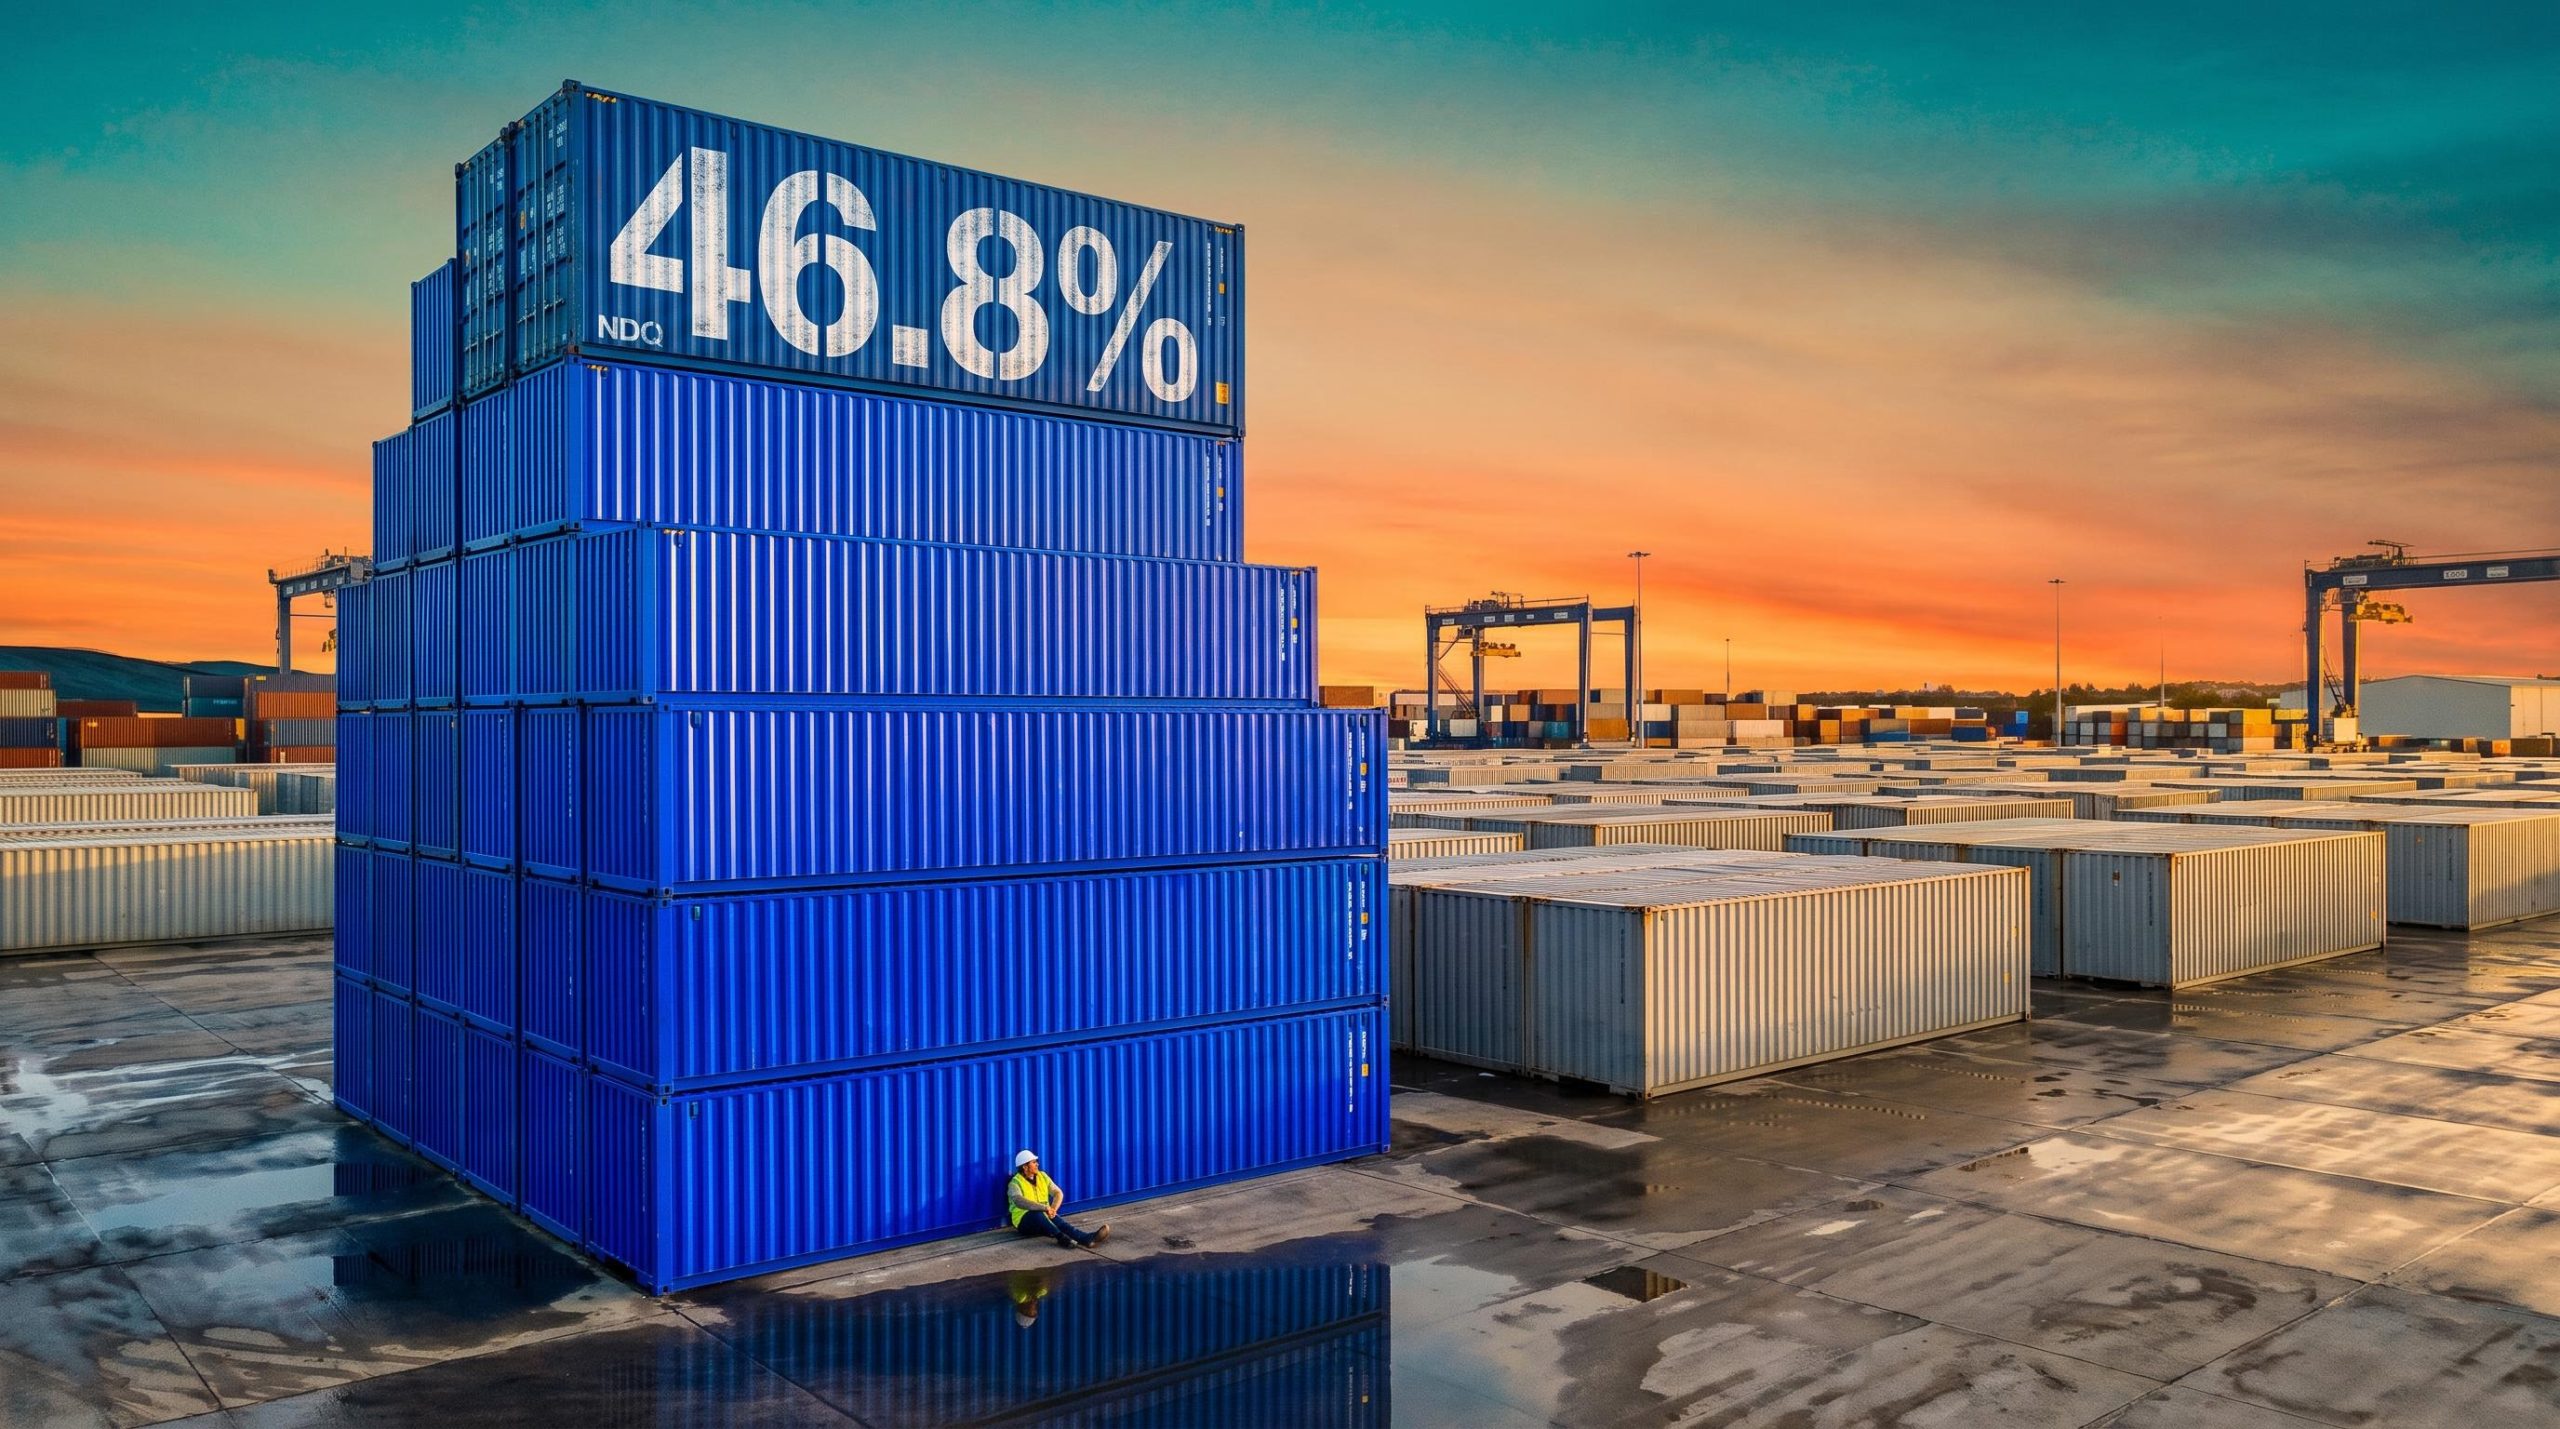
Owning about 100 companies sounds like diversification. In the Betashares Nasdaq 100 ETF (ASX: NDQ), nearly half the money sits in just ten line items worth 46.8% of the fund, and those ten lines are really nine businesses because Alphabet appears twice.
That concentration has paid off. NDQ has returned 24.40% p.a. over three years and 21.57% p.a. over ten, according to Betashares. Vanguard reports 18.58% and 14.06% over the same periods for its international shares fund, VGS, as at 30 September 2026.
For Australian investors, the real question is what that record means. It could be a reason to buy, or a reason to look harder at what has been driving it.
This analysis sets out what NDQ actually holds, which parts of the AI earnings debate matter most, and where the fund fits next to VGS or VDHG. You will be able to judge whether it belongs at the centre of your portfolio or on the edge of it.
What is inside NDQ, and how concentrated is it really?
NDQ tracks the Nasdaq-100 Index, which holds 100 of the largest non-financial companies listed on the Nasdaq exchange. It charges a 0.48% p.a. management fee and manages about $9.94 billion (as at 23 October 2026, per InvestSMART). The “100 companies” label suggests a broad fund. The weightings say otherwise.
| Holding (Betashares, 26 October 2026) | Weight |
|---|---|
| NVIDIA | 8.0% |
| Apple | 7.8% |
| Microsoft | 6.1% |
| Micron Technology | 4.7% |
| Amazon | 4.3% |
| Advanced Micro Devices | 4.0% |
| Tesla | 3.3% |
| Alphabet (first share class) | 3.0% |
| Meta Platforms | 2.8% |
| Alphabet (second share class) | 2.8% |
| Combined | 46.8% |
Concentration check Nearly half of NDQ sits in nine economic issuers.
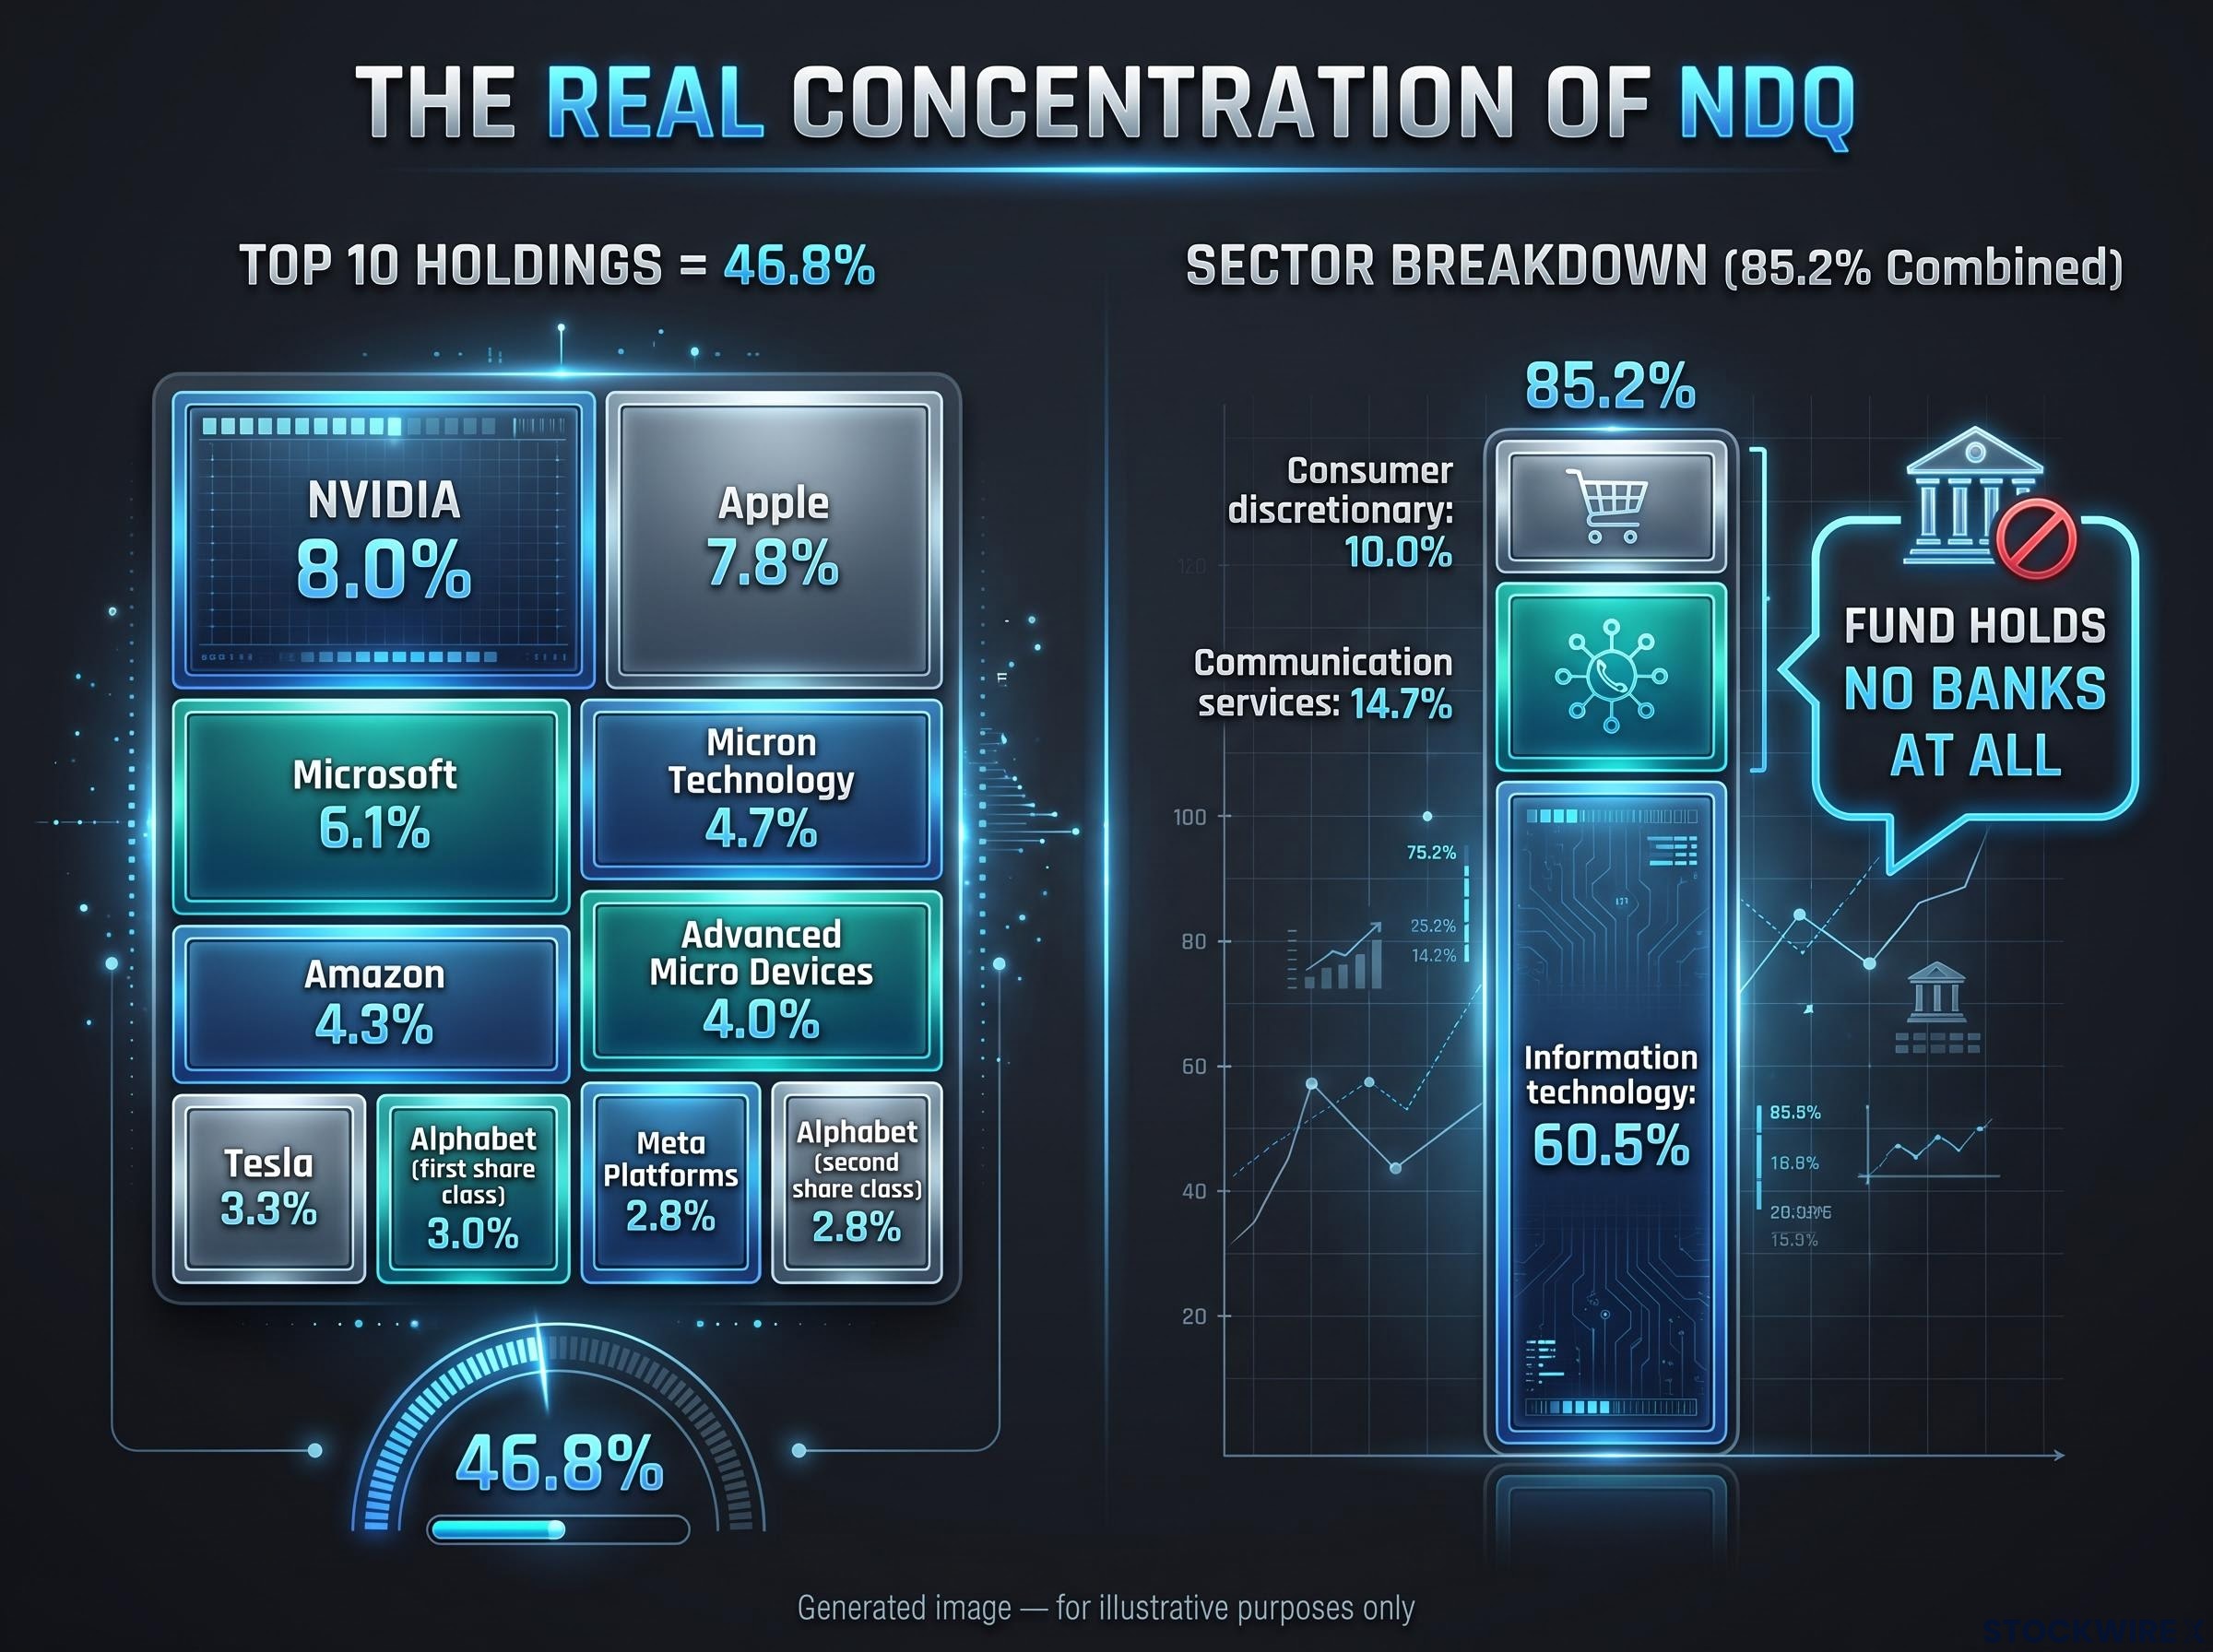
The sector split narrows things further:
- Information technology: 60.5%
- Communication services: 14.7%
- Consumer discretionary: 10.0%
- Combined: 85.2% of the fund
Because the index excludes financials, NDQ holds no banks at all. That is a sharp contrast with the bank-heavy ASX that many Australian portfolios lean on. Morningstar has also pointed out that the largest holdings are increasingly tied to the same AI-investment theme, so they tend to rise and fall together.
The absence of banks in NDQ is the flip side of the ASX technology gap: technology is only about 5% of the ASX 200 by weight against roughly 27% of the S&P 500, which is why Australian portfolios rarely hold these businesses.
What this tells you is that buying NDQ means taking a large position in about nine companies and one sector. Your outcome depends heavily on a handful of AI-linked businesses.
Where NDQ’s holdings overlap with global funds
The same names lead broader funds as well. Vanguard’s VGS holds NVIDIA at 5.81%, Apple at 5.42% and Microsoft at 4.01% as its top three positions. The weights are smaller, but the leadership is identical, which becomes important when you consider holding both.
When big ASX news breaks, our subscribers know first
Is AI earnings growth structural or cyclical?
If a few AI-linked giants drive NDQ, the next question is whether their earnings can keep compounding. The evidence supports both a bullish reading and a sceptical one.
The bull case: demand, cash flow and reinvestment
Demand data is striking. Reuters reported in August that NVIDIA’s Q2 data-centre revenue rose 117% year-on-year to US$89 billion, with Q3 guided to about US$108 billion. Cloud usage, enterprise AI adoption and semiconductor progress all feed the same pipeline.
The largest holdings are also highly profitable. They can fund heavy investment from their own cash flow rather than relying on outside capital. Goldman Sachs Research has estimated roughly US$9 trillion in potential AI-related capital revenues.
Goldman Sachs Asset Management, November 2025 Tech gains reflect fundamental growth and strong balance sheets more than irrational exuberance, with earnings disappointment the principal threat.
The counter-case: payback, circular financing and competition
Spending is running faster than visible returns in places. Reuters reported in July that Microsoft’s capex growth averaged about 62% between 2024 and 2026, against Azure revenue growth nearer 37%. Capex, short for capital expenditure, is money spent on long-lived assets such as data centres and chips.
Reuters also reported that Microsoft, Alphabet, Amazon, Meta and Oracle expect to spend about US$795 billion in 2026, approaching US$1.08 trillion in 2027. Late this month, Microsoft reportedly trimmed its 2026 capex forecast from US$175 billion to US$170 billion because third-party GPU capacity was delayed, not because its AI plans had stalled.
Goldman has warned that slowing capex growth could threaten valuations. Reuters has described investors examining arrangements in which chip companies help finance their own customers, while those customers build in-house alternatives to NVIDIA chips.
The payback question looks sharper against operating cash flow, with PIMCO estimating hyperscaler capex now absorbs 93-94% of it, up from 33-40% in 2022-2023, leaving little room for buybacks or dividends.
| Structural signals | Cyclical warning signs |
|---|---|
| NVIDIA data-centre revenue up 117% | Microsoft capex growth (~62%) outpacing Azure (~37%) |
| Ongoing cloud and enterprise AI demand | Hyperscaler spend heading toward US$1.08 trillion |
| Self-funding, highly profitable leaders | Customer financing and in-house chip competition |
| Goldman’s ~US$9 trillion revenue estimate | Goldman’s warning on slowing capex growth |
Read together, the disagreement is about timing and payback, not whether AI has value. Reuters notes institutions now separate proven earners from businesses valued on future adoption. The best-supported view is structural demand moving through a cyclical investment and valuation cycle.
For you, that means NDQ is a bet on both the AI thesis and the prices paid for a few companies. Being right about AI alone does not guarantee a good return.
What could go wrong: valuation, currency and tax for Australian holders
Valuation risk is the danger most investors already expect. The Australian-specific risks are less visible and can compound it.
- Valuation and capex: returns fall if AI spending slows or disappoints
- Concentration: a few mega-caps drive most outcomes
- Currency: unhedged exposure to AUD/USD movements
- Tax: no franking credits and foreign income reporting
Market and valuation risk
The 2022 reminder The Nasdaq-100 and NDQ fell more than 30% peak-to-trough in 2022 as rising rates compressed the valuations of long-duration growth stocks.
Morningstar reported NDQ’s five-year standard deviation, a measure of how widely returns swing, at about 15.8 against 12.3 for its category index, with downside capture above 100%. In plain terms, the fund has tended to fall further than its peers in down markets.
Morningstar Australia has reportedly downgraded NDQ from Neutral to Negative under updated methodology, citing the 100-stock cap, exchange-based exclusions and top-heavy weighting. Its August 2025 rating had been Neutral. Even Betashares cautions that NDQ is a concentrated growth allocation, not a complete portfolio.
Costs show up too. NDQ returned 17.45% over one year against the index’s 17.90%, a gap reflecting fees and tracking drag.
Australian-specific risks
NDQ is unhedged, so your return in Australian dollars depends on both the Nasdaq-100 and the AUD/USD exchange rate. Betashares cites currency as a major reason NDQ’s performance differs from the US-listed QQQ.
A rising Australian dollar has already been a headwind for unhedged holders, with the currency up roughly 20% against the US dollar since January 2025, which trims the AUD return on US-listed assets even when the underlying shares climb.
On tax, NDQ is Australian-domiciled and issues an annual AMIT tax statement (the Attribution Managed Investment Trust regime’s yearly summary of your taxable income). US dividends may generate foreign income tax offsets, but there are no franking credits. Holding US-listed ETFs directly adds US withholding tax and estate-planning issues, so a tax professional is worth consulting.
The takeaway: a US tech sell-off and a rising Australian dollar can hurt you at the same time. And with no franking credits, NDQ replaces none of the income features of local shares.
NDQ vs VGS vs VDHG: which structure fits your portfolio?
Those risks are the price of NDQ’s performance lead. That lead is real, and it is why investors compare the three funds in the first place.
How the three compare
| Fund | Fee | Holdings | 3-yr / 10-yr return | Best-suited role |
|---|---|---|---|---|
| NDQ | 0.48% | ~100 Nasdaq stocks | 24.40% / 21.57% | Deliberate satellite |
| VGS | 0.18% | 1,206 companies, 22 markets | 18.58% / 14.06% | Low-cost international core |
| VDHG | 0.27% | 13 Vanguard funds | 14.56% / n/a (launched 2017) | Complete diversified portfolio |
NDQ’s figures are as at late October, while Vanguard’s are as at 30 September 2026, so the comparison is not perfectly aligned. NDQ still leads on every available period, including five years (16.74% against 12.87% for VGS and 8.84% for VDHG). VDHG holds 90% growth and 10% defensive assets, with 36.0% in Australian shares.
Which role does NDQ play?
The better question is what job each fund does:
- NDQ alone: a high-conviction, high-volatility tech allocation, not a global portfolio
- VGS alone: broad international shares, still heavily US-weighted
- VDHG alone: the closest to a complete portfolio in one fund
- VGS + NDQ: a tilt that doubles up on the same US mega-caps rather than adding diversification
- VDHG + NDQ: an intentional AI and tech tilt on a diversified core
Morningstar has warned that pairing NDQ with VGS or other US-equity ETFs may offer less diversification than investors expect. NDQ’s higher returns are the reward for concentration risk, not a reason to replace your core. Size it to what you could stomach losing in a 30% fall.
The overlap with broad US funds is measurable: QQQ shows a 0.88 correlation with the Vanguard S&P 500 ETF, so adding a Nasdaq-100 product to a US-heavy core delivers less diversification than a separate ticker implies.
Sizing NDQ: the decision you make before you buy
NDQ is a credible long-term vehicle for AI and technology exposure, but a concentrated and unhedged one. Its record reflects both genuine AI demand and the rich valuations attached to a few companies.
So the useful order of decisions is role first, fund second. Decide whether you want a core holding, a satellite tilt or a complete portfolio, set the size you can tolerate, and then choose the ETF that fits.
From here, three variables are worth monitoring: hyperscaler capex guidance, whether AI revenue keeps pace with AI spending, and the AUD/USD exchange rate.
This article is for informational purposes only and should not be considered financial advice. Investors should conduct their own research and consult with financial professionals before making investment decisions. Past performance is not a reliable indicator of future performance, and forward-looking views cited here are speculative and subject to change.