
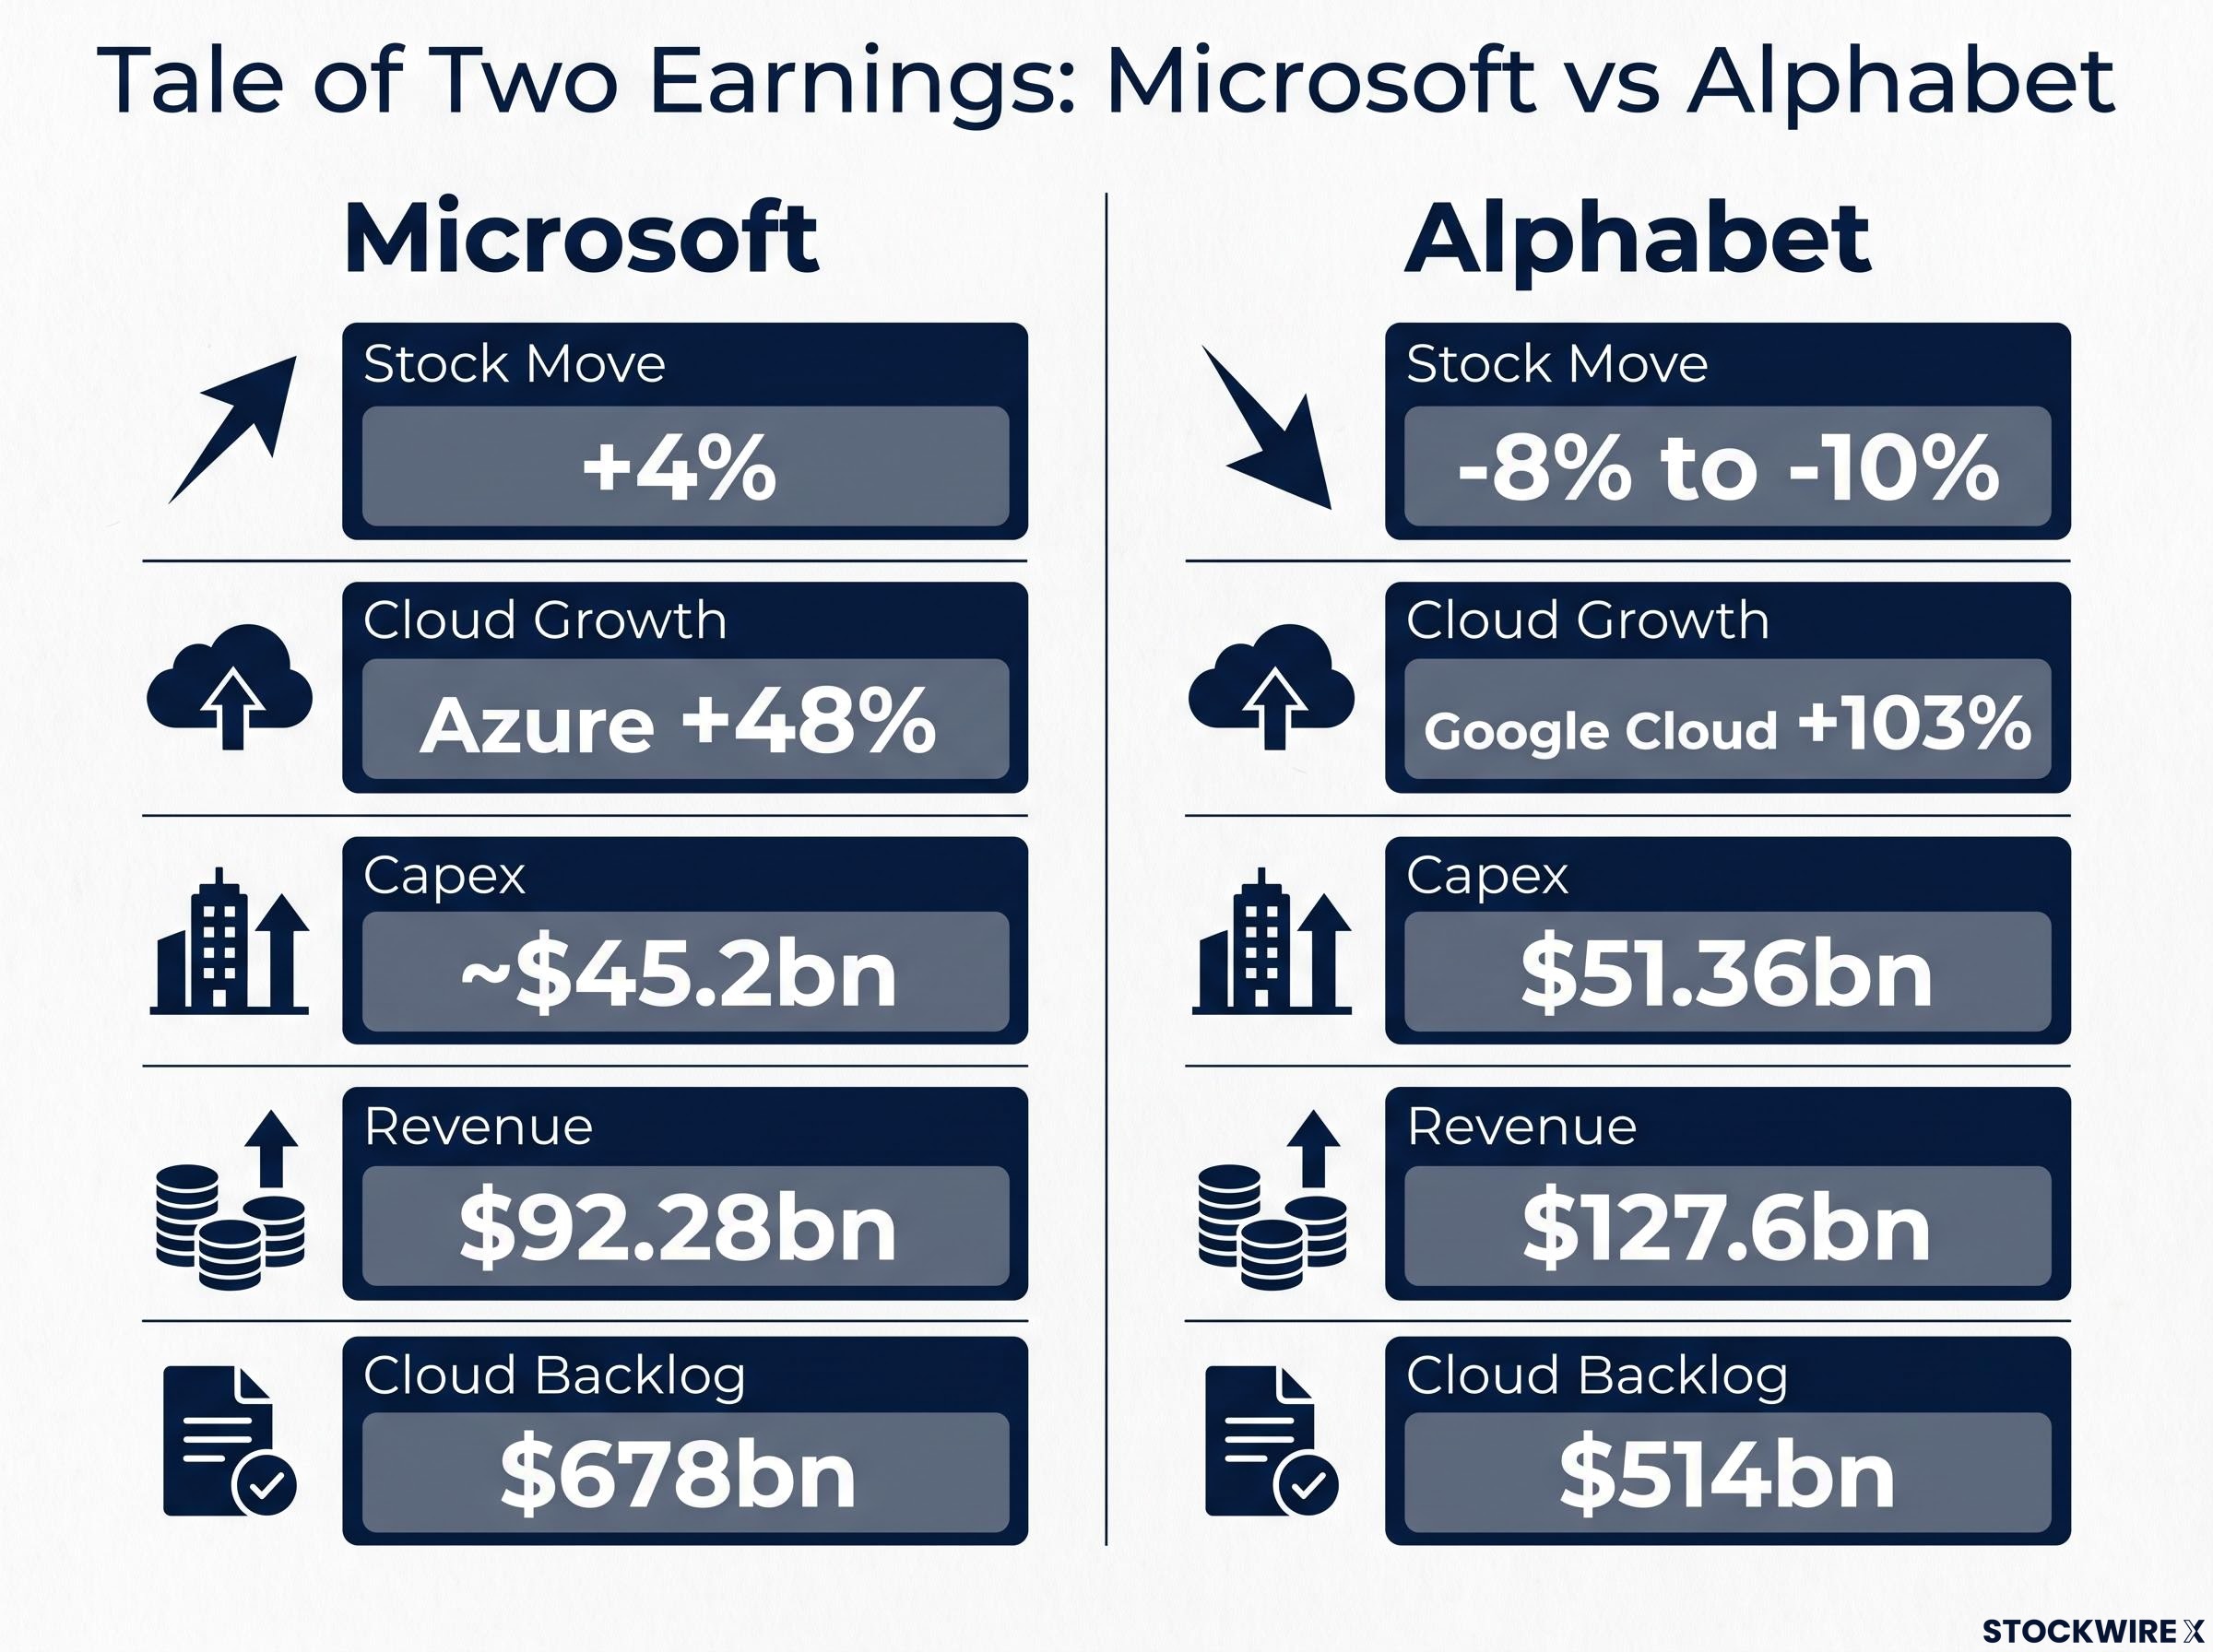
Microsoft rose about 4% in extended trading on Wednesday 28 October 2026, while Alphabet fell roughly 8-10%. The split came even though Google Cloud revenue jumped 103% and Microsoft’s Azure grew 48%, two of the strongest cloud prints of this Big Tech earnings season.
The gap shows that strong demand for AI computing power no longer settles the question. Investors are now pricing how that demand gets paid for: from cash already earned, or from borrowed money and future promises.
Oracle supplied the third data point. Its shares climbed about 10-11% after it set a fiscal 2030 revenue target and, more importantly, capped how much new money it will raise.
Taken together, the three reactions show you which kinds of AI spending the market is rewarding right now, and which kinds it is punishing.
Why did the market back Microsoft and punish Alphabet?
On paper, Alphabet’s cloud business grew more than twice as fast as Microsoft’s. Yet Alphabet was the stock investors sold.
The cash-flow numbers resolve the paradox. Growth rate was never the deciding variable.
Microsoft’s beat and the new segment lens
Microsoft posted revenue of $92.28bn against $90.69bn consensus, and adjusted earnings per share (EPS) of $4.89 against $4.73. Azure delivered the main upside: $33.17bn in revenue versus a $32.32bn estimate, disclosed in dollars for the first time.
That disclosure came with a new segment structure. The “Agents and Infra” segment, which groups Azure with related infrastructure businesses, brought in $76.8bn versus $75.63bn expected, giving investors a clearer view of how AI demand turns into sales.
Capital expenditure (capex, money spent on long-term assets such as data centres and chips) came in at about $39.4bn, or about $45.2bn including finance leases. That broader figure sat below the roughly $50.7bn analysts expected.
Alphabet’s miss beneath the Cloud headline
Alphabet’s Cloud revenue of $30.7bn beat consensus of about $28.7bn (some estimates ran to $29-30bn), with Cloud operating income of about $11.1bn. The trouble sat below that line.
Group operating income reached $40.58bn against a $43.19bn FactSet consensus. Free cash flow, the cash left after operating costs and capex, was negative $9.07bn versus about negative $2.70bn expected. Adjusted EPS was $2.67 against $3.02; GAAP EPS of $2.12 also absorbed an approximately $8.7bn loss on equity securities.
Capex of $51.36bn actually came in below the $55.09bn estimate. The selloff reflected the sheer scale of spending and cash burn, not an overshoot, and it happened despite a Cloud backlog (contracted revenue not yet recognised) of about $514bn.
Combined hyperscaler capex is running at a pace that could approach $725bn in 2026, which explains why each company’s funding mix has become as important as its cloud growth rate.
| Metric | Microsoft | Alphabet | Consensus/Estimate |
|---|---|---|---|
| Revenue | $92.28bn | $127.6bn | MSFT $90.69bn; GOOGL $127.9bn-$128.2bn |
| Adjusted EPS | $4.89 | $2.67 | MSFT $4.73; GOOGL $3.02 |
| Cloud growth | Azure +48% | Google Cloud +103% | Both above expectations |
| Capex | About $45.2bn incl. leases | $51.36bn | MSFT about $50.7bn; GOOGL $55.09bn |
| After-hours move | Up about 4% | Down about 8-10% | N/A |
XTB’s read The market rewarded Microsoft’s perceived spending discipline and penalised Alphabet’s move toward negative cash flow, even though Alphabet’s cloud business grew faster.
Zacks pointed to Microsoft’s operating margin expanding to 45.1%, with contracted future revenue reported at $678bn. For you, the lesson is direct: judge any AI-exposed holding by how quickly demand converts into cash, not by its headline cloud growth. Alphabet’s slump was not a demand problem.
When big ASX news breaks, our subscribers know first
Oracle’s $225bn target and $20bn cap: why did investors cheer a financing limit?
The headline from Oracle’s Investor Day was ambition. The reason for the rally was a boundary. The plan has four parts:
- Revenue target: at least $225bn in fiscal 2030, implying more than 35% compound annual growth from fiscal 2026.
- Fundraising cap: $20bn across fiscal 2027-2030 (about $10bn equity and $10bn gross debt, excluding refinancing), on top of a $20bn at-the-market equity raise (shares sold gradually into the open market) completed in fiscal Q1 2027.
- Capex path: peak investment in fiscal 2027-2028, stepping down in fiscal 2029.
- Cash flow goal: positive free cash flow in fiscal 2029.
Oracle’s fiscal 2029 expectation At least $30bn of positive free cash flow, according to the company.
The cap matters because Oracle had become the leveraged outlier. FactSet singled it out given rising debt and contractual commitments to build capacity for OpenAI, and the original source reports the stock had fallen 33% this year before Wednesday.
The market is prepared to pay for AI buildouts that show an end-point to external funding. But Oracle’s plan is a promise, not a result: construction, power procurement, delivery and financing all still need to land on schedule.
Is the AI buildout becoming a credit-market story?
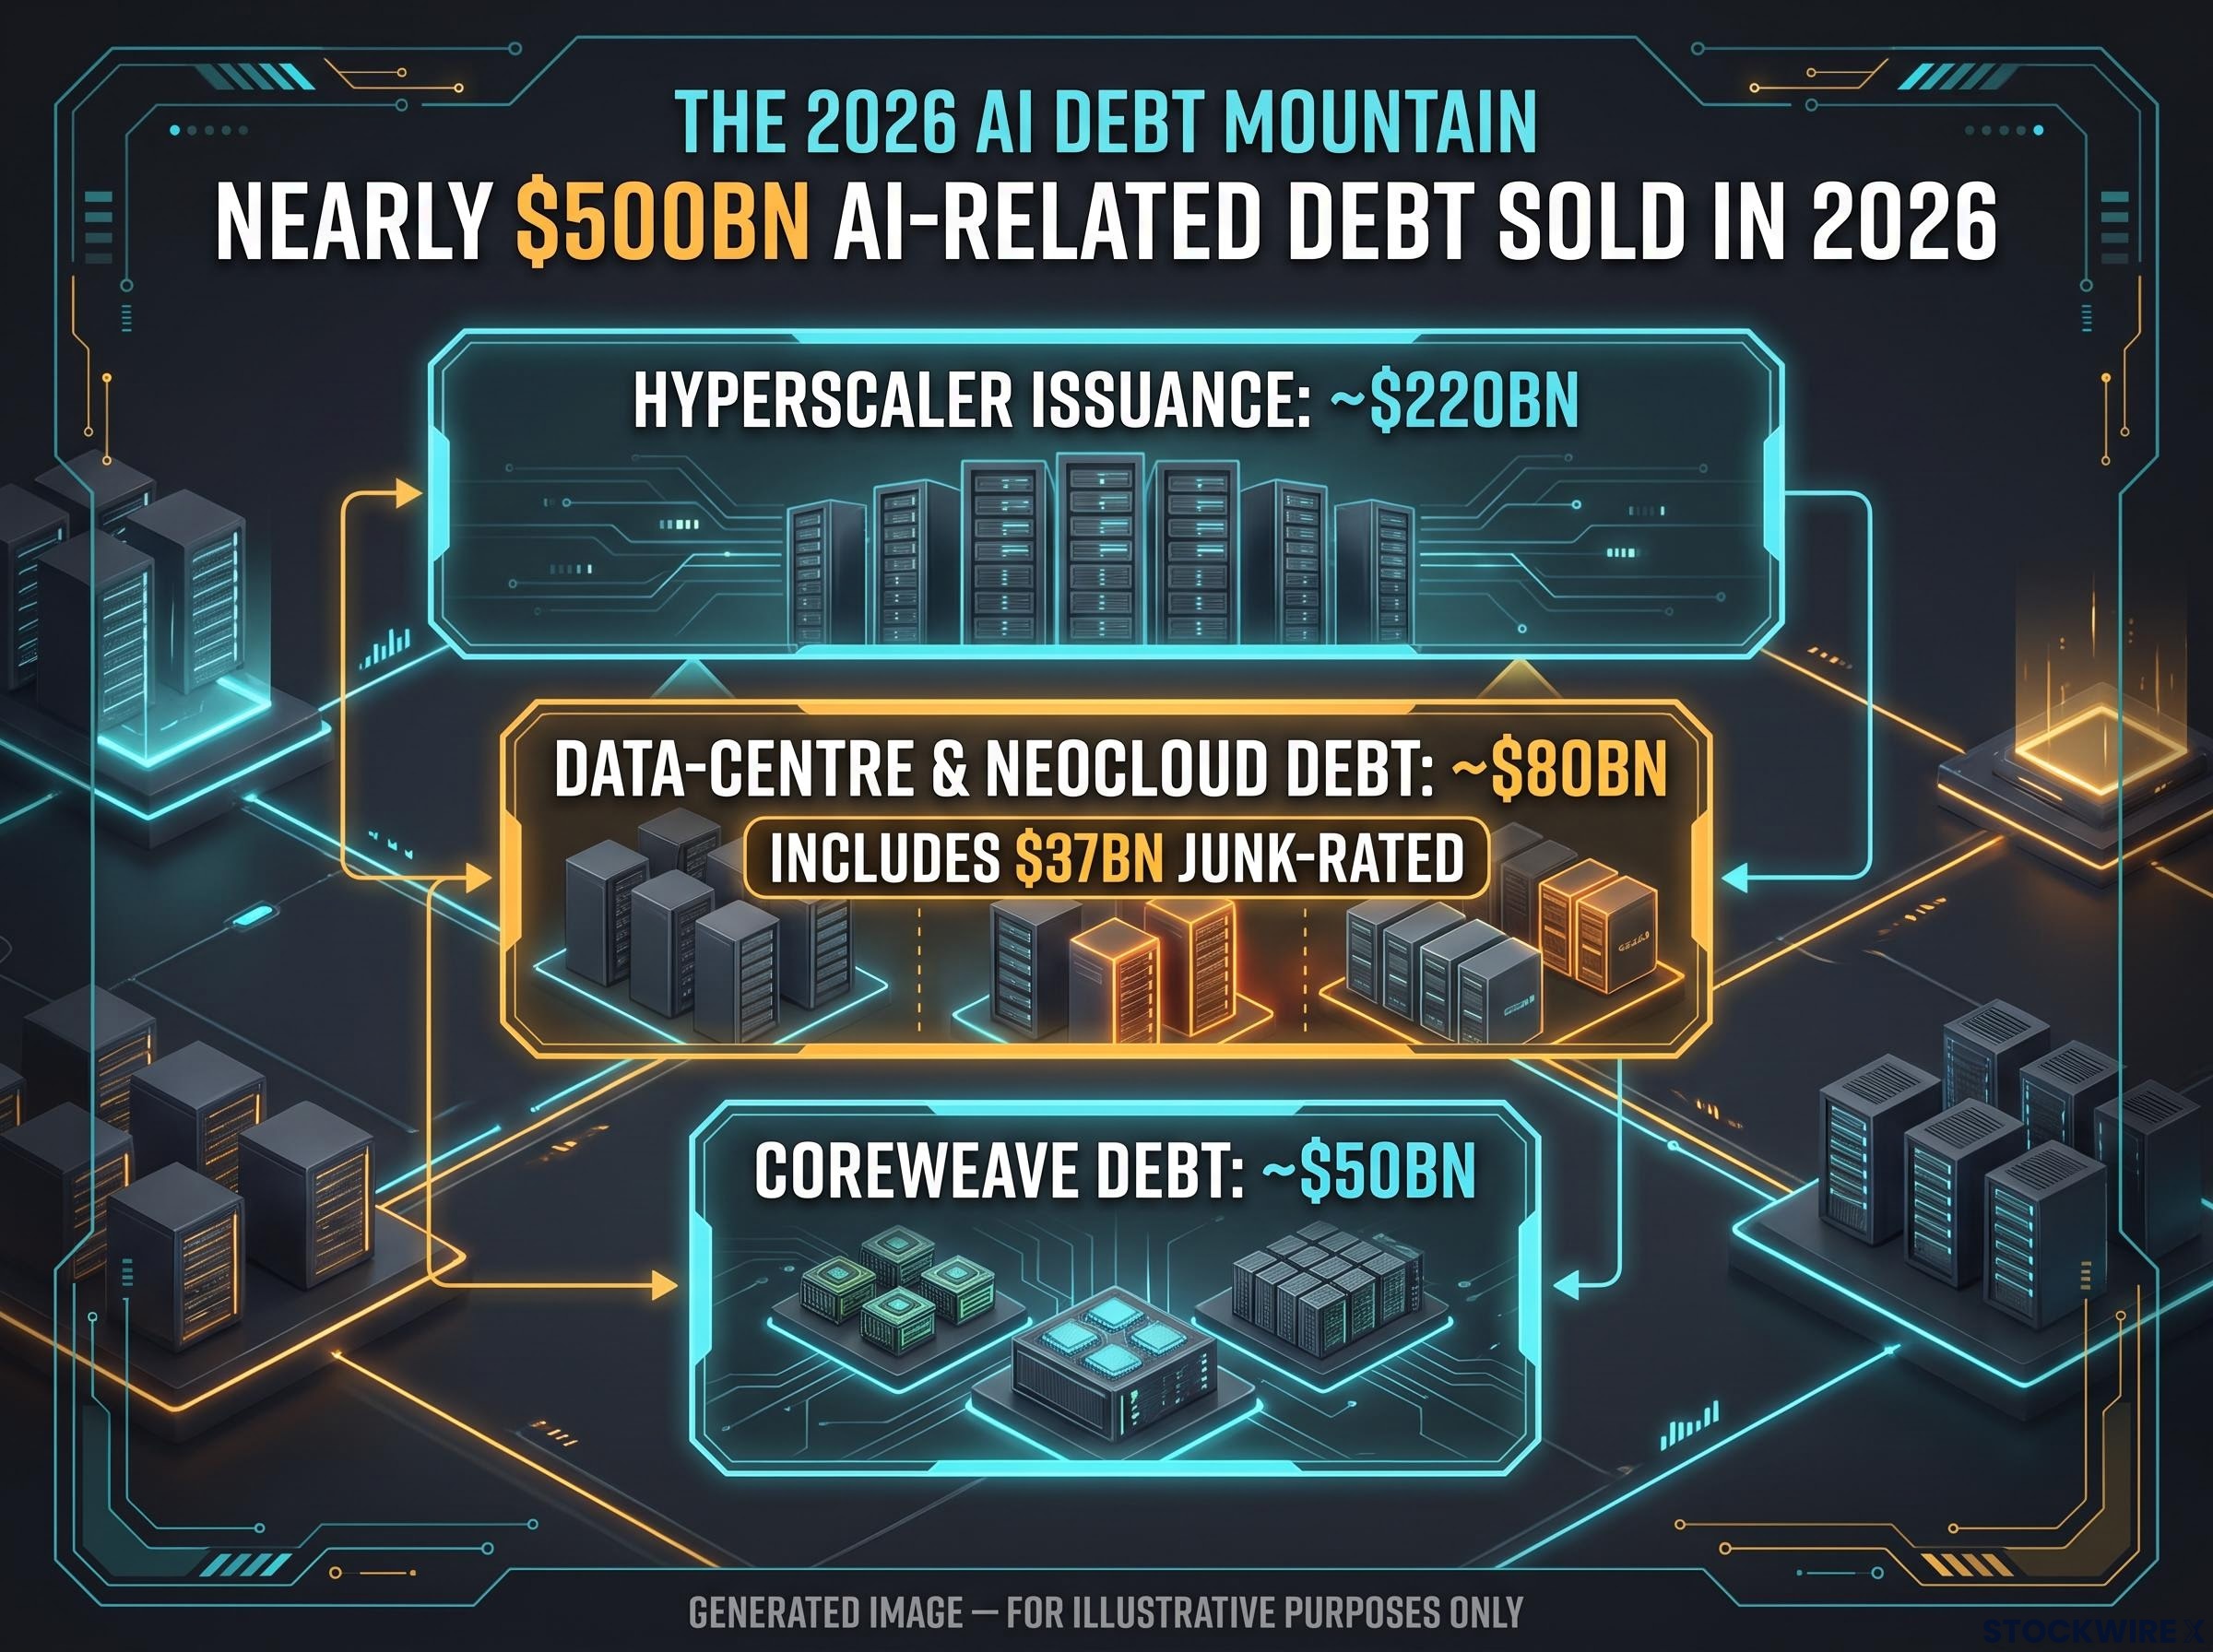
Beneath the earnings sits a mountain of borrowing. Nearly $500bn of AI-related debt was sold in 2026 through early August, according to Goldman Sachs via Reuters, about one-fifth of higher-rated US issuance compared with 1% in 2024.
Much of that borrowing sits inside bond, pension and income funds, so AI debt exposure reaches savers who never bought a single AI stock, and one stress event can hit both the equity and credit sides of an account.
How the financing chain works
- Hyperscalers (the largest cloud providers) commit to vast GPU, power and data-centre spending.
- Their own cash flow does not fully cover it, especially during construction.
- Developers, neoclouds (newer specialist AI cloud providers) and equipment owners borrow through bonds, private credit, leases, asset-backed securities (ABS) and commercial mortgage-backed securities (CMBS).
- Lenders justify that debt with expected demand and long-term contracts from big tech customers.
- If demand, pricing or customer credit disappoints, leveraged borrowers face refinancing pressure before their assets generate enough cash.
The Dallas Fed sketched a possible funding mix: about 20% from operating cash flow or equity, about 30% from unsecured high-grade debt, and the rest from private lenders and foreign investors. Microsoft can fund more internally; Oracle and the neoclouds lean far harder on outsiders.
| Measure | Figure | Source |
|---|---|---|
| AI-related debt sold in 2026 | Nearly $500bn through early August | Goldman Sachs via Reuters |
| Hyperscaler issuance | About $220bn through 10 August | BNP Paribas via Reuters |
| Data-centre bonds and neocloud debt | About $80bn, $37bn junk-rated | Reuters |
| Data-centre bond yields | Top-rated from below 5% to about 7%; riskier near 10% | Reuters |
Bulls, bears and the lenders in between
Bulls point to backlogs of about $514bn at Alphabet and $678bn at Microsoft. Morgan Stanley argues private credit is often backed by contractual cash flows from creditworthy tenants.
Bears see strain building. CoreWeave carries about $50bn of debt, and Columbia Business School found about $4bn of it trading below 80 cents on the dollar. Oliver Wyman warns the cycle’s credit exposure could exceed early-internet broadband, while some insurers and banks are nearing internal limits; one European bank lender cited about five months to transfer risk.
Strong cloud earnings and rising credit stress can coexist. Owning AI exposure now means checking who funds the capacity, not just who demands it.
What should investors watch next: structural growth or a cyclical rush?
Two fair readings of the cloud boom compete, and the evidence supports parts of both.
| Structural case | Cyclical case |
|---|---|
| AI workloads moving into commercial production | Growth flattered by a low base and a rush for scarce capacity |
| Inference and agents create recurring consumption | Customers may over-order, then cut back as GPUs free up |
| Long-term contracts give visibility | Contracts shift risk rather than remove it |
| Buyers are highly profitable companies | Falling compute prices could cut revenue per unit |
| Cloud as a new general-purpose computing layer | Telecom-style overbuilding, as with late-1990s fibre |
Alphabet kept its 2026 capex guidance of $195bn-$205bn, and CNBC reported spending could exceed $300bn in 2027. FactSet warns that front-loaded capex is pushing free cash flow toward zero or negative for several hyperscalers.
Analysts warn that AI capital spending is now consuming close to 90% of operating cash flow at some hyperscalers, which is why free cash flow has become the number the market watches most closely.
A slowdown in spending would reassure shareholders but could expose suppliers, data-centre landlords and private-credit lenders. The signals worth tracking:
- Free cash flow trends against capex guidance
- Backlog quality: customer concentration, cancellation rights, delivery schedules and power availability
- Funding mix, especially the share coming from outside lenders
- Yields on data-centre and neocloud debt
Backlog size matters less than its quality. Treat Microsoft, Oracle and the neoclouds as three distinct risk profiles. Projections are subject to market conditions, and past performance does not guarantee future results.
Cash, caps and credit: the metrics that decide the next round
Wednesday’s verdicts followed one logic. Microsoft was rewarded for turning demand into cash, Alphabet was punished for burning cash despite 103% Cloud growth, and Oracle was rewarded for putting a visible limit on outside funding.
The next test is whether that logic holds. Watch free cash flow, how each company funds its buildout, how quickly backlogs convert to revenue, and whether spreads on data-centre debt keep widening. If cash conversion improves while credit stays calm, the boom looks structural; if not, the strain will likely show in lenders first.
This article is for informational purposes only and should not be considered financial advice. Investors should conduct their own research and consult with financial professionals before making investment decisions.