When 94 of 100 economists polled by Reuters expect the Federal Reserve to hold rates, the decision itself should be the least interesting thing that happens all day. Yet on Wednesday long-dated Treasuries reversed sharply, and one technical trader whose session commentary informs this piece cut his margin use close to zero.
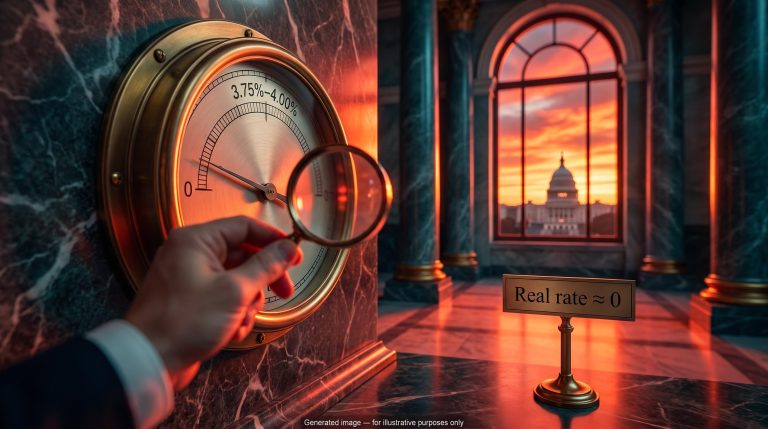
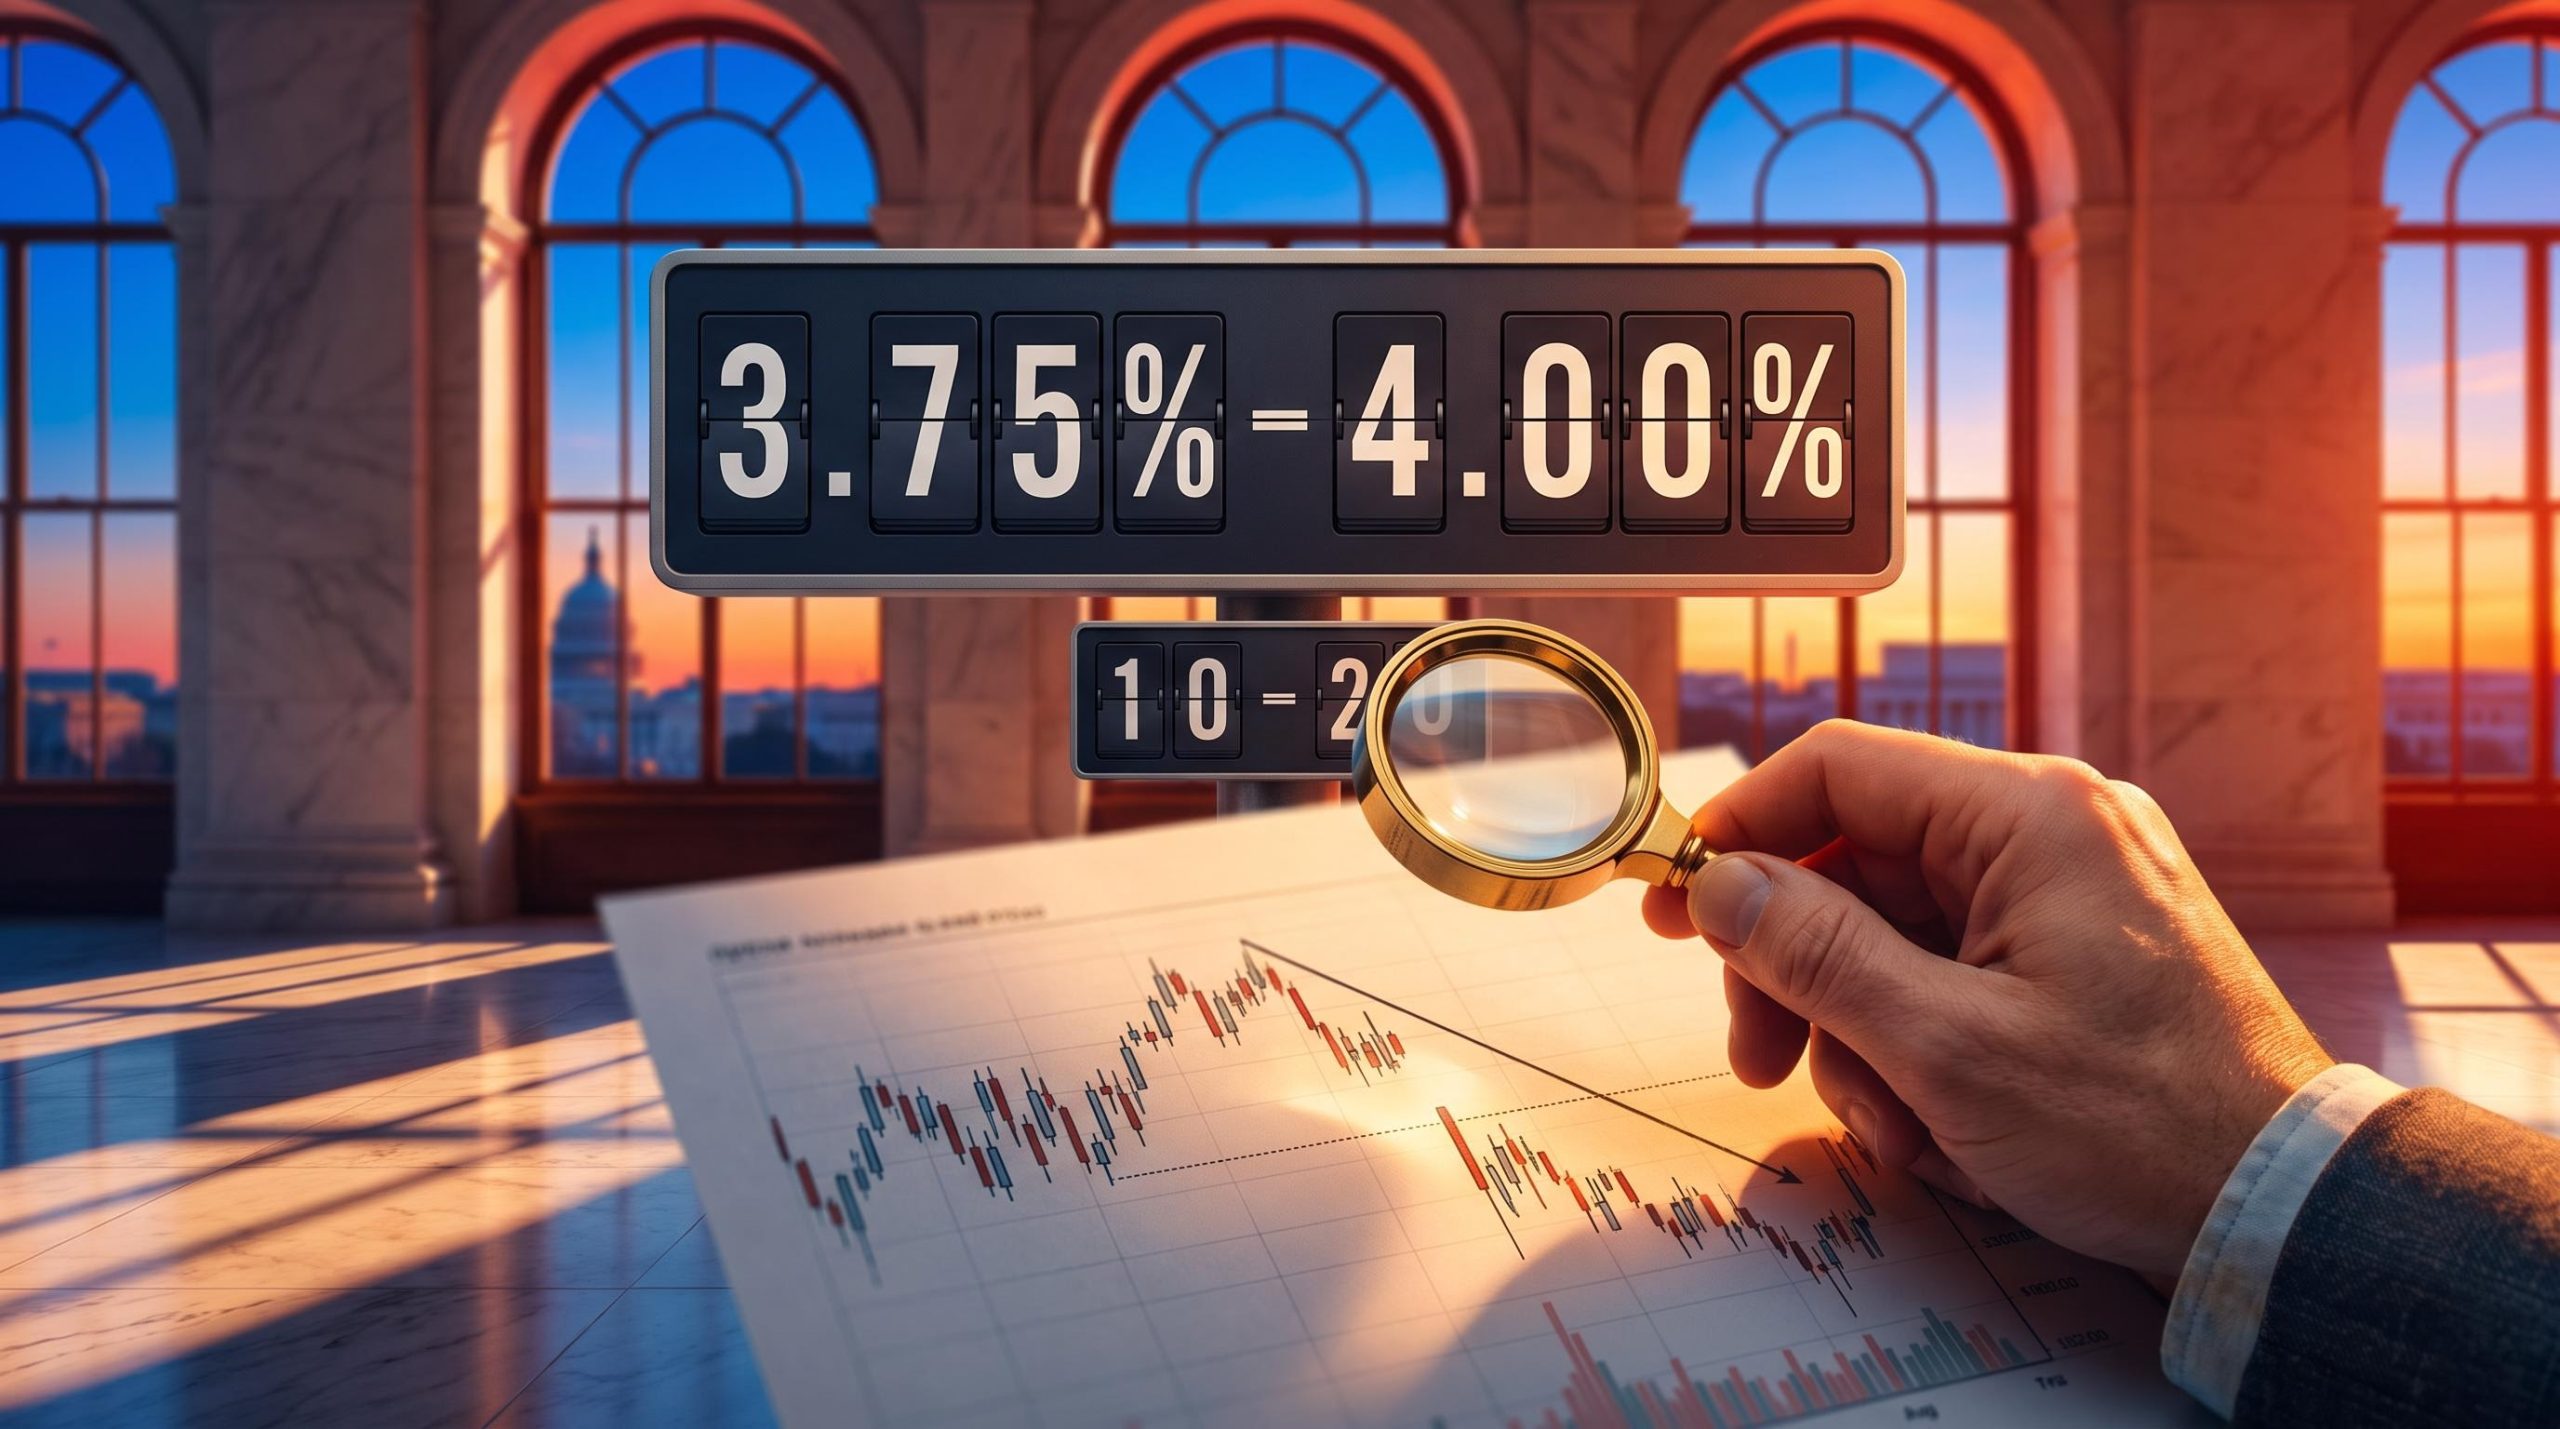
The Federal Reserve held its target range at 3.75%-4.00% on 28 October 2026, in a 10-2 vote. The midterm elections arrive on 3 November, and Microsoft and Alphabet reported earnings after the bell on the same day.
That cluster of events, more than the rate call, is what makes this FOMC day worth a cross-asset market analysis. Reuters flagged the pile-up in advance as a likely source of volatility and a test of the AI-led rally.
Here is a chart-based way to read channels, gaps, topping patterns and trend lines across stocks, bonds, metals, oil and emerging markets. It also covers how to size your risk when several catalysts land in the same week.
Why did a widely expected Fed hold still move the market?
The decision was not the story. A hold had been priced in for weeks, and the Fed delivered it.
The language carried more weight. The statement said inflation “remains elevated” and upgraded its view of economic activity, and Reuters reported that it left the door open to further increases if inflation persists. Yahoo Finance noted that the proximity of the midterms argued against any bold move. That made this a wait-and-see pause rather than a turning point.
The Fed’s shrinking share of outstanding public debt is one reason the bond market sets rates for long-duration money independently, which helps explain why a routine hold can coincide with a sharp reversal in long-dated Treasuries.
The trader found one detail puzzling: stocks rallied during the press conference itself. The closes looked calm on the surface.
| Asset | Close | Move | Note |
|---|---|---|---|
| S&P 500 | 7,743.98 | +0.3% | Initial Reuters read about +0.1% |
| Nasdaq Composite | 26,549.85 | +0.27% | Initial Reuters read about -0.1% |
| Russell 2000 | 2,830.52 | +0.41% | Small caps led |
| 10-year Treasury yield | 5.047% | +5 bp | Reuters |
| 30-year Treasury yield | 5.338% | +3.8 bp | Reuters |
The gap between the early Reuters figures and the later closes is a lesson on its own. Before you act on a headline move, check its timestamp.
Institutional voices stayed measured.
Edward Jones view Strategist Mona Mahajan remains overweight equities but less aggressive, and sees fixed income as more attractive after the rise in yields.
Schwab’s Nathan Peterson argued that AI adoption could still earn favourable post-earnings reactions. When an outcome is this well priced, the signal sits in rates and positioning, and that is where you should be looking.
When big ASX news breaks, our subscribers know first
How to read channels, gaps and topping patterns
On a trader’s screen this week, the semiconductor charts split in two directions. Understanding why requires a short vocabulary.
The tools
A channel is a pair of parallel lines drawn along a price’s highs and lows; a trend line is a single line connecting rising lows or falling highs. A gap is a price range skipped between one session’s close and the next session’s open. A bearish engulfing candle is a down day whose body fully covers the prior day’s up move. An island reversal is a cluster of sessions isolated by gaps on both sides. A head-and-shoulders is three peaks with the middle one highest. Overhead supply is a price zone where many earlier buyers may sell to break even.
| Pattern | What it shows | Example this week | Main caveat |
|---|---|---|---|
| Channel | Orderly trend boundaries | SOXX held its channel; SMH broke and is back at the line | Lines vary by timeframe |
| Bearish engulfing | Sellers overwhelming buyers | Nvidia, after a lifetime high earlier in October | Needs confirmation |
| Gaps | Levels the market skipped | Micron passed one gap and nears a bigger one | Gaps can reverse fast |
| Head-and-shoulders | Possible exhaustion of a rally | KORU, graded B to B-minus | Leveraged ETFs reset daily |
Nvidia also broke a short-term uptrend, and the trader believes its direction eventually leads the market. Micron sits at its May price despite swings of roughly $200-300 around $1,000.
Where they fail
Every one of these lines is partly subjective, and a channel on a daily chart can disappear on a weekly one. A bearish candle means little without confirmation from breadth, volume or earnings revisions. Oversold markets can also stay oversold: the Russell 2000’s relative strength index, a momentum gauge running from 0 to 100, sat at 28.3 on 14 October.
Leveraged ETFs like KORU add another trap. Because they reset daily, volatility drag can pull long-run returns away from the stated multiple.
The practical read for you is simple. These patterns show where a trade is wrong, which makes them risk-control tools rather than forecasts.
What are bonds, small caps and tech saying?
That risk-control lens matters most where Wednesday’s sharpest move occurred.
Bonds and small caps
The trader observed TLT, a long-dated Treasury fund, falling more than 1% intraday and erasing four sessions of gains. LQD and IEF each slipped about 0.33%, and the utilities fund XLU fell almost 1%. These are trader-observed intraday figures, and no verified TLT close was available.
Because the coupon on a Treasury is fixed, falling prices mechanically lift yields, which is why the way bond yields move matters for anyone holding long-dated funds like TLT through a volatile session.
Commentators disagree on why yields keep climbing:
- Hot September inflation, which pushed the 10-year above 5.3% intraday on 14 October
- Heavy Treasury supply from wider deficits, which Reuters said has at times outweighed Fed expectations
- $220 billion of 2026 debt issuance from Alphabet, Amazon, Meta, Microsoft and Oracle to fund AI
- Safe-haven swings during geopolitical and AI-slowdown scares, which have pushed yields the other way
Small caps feel that pressure first because they borrow at higher cost. The trader notes IWM has trended down since mid-August, and the Russell 2000 fell 1.3% on 7 October and 1.70% on 14 October. The trader holds a short in IEF, a bet that intermediate Treasuries keep weakening.
Semiconductors and AI earnings
The PHLX Semiconductor Index fell 11.4% the prior week, its longest losing streak since 2008. The trader sees a topping pattern in KLA and would short near a price-to-earnings (P/E) ratio of 42. Teradyne sits near a support break.
The after-hours earnings split showed that AI does not trade as one position.
| Company | Cloud result | Total revenue | After-hours move | Lesson |
|---|---|---|---|---|
| Microsoft | Beat, Azure stronger | Beat expectations on cloud | About +2% | Cash generation rewarded |
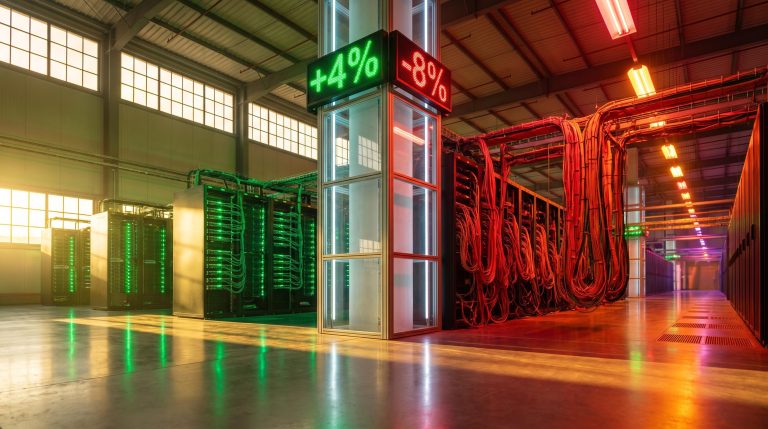
| Alphabet | Beat | Missed | More than -8% | AI spending punished without revenue |
If long yields keep rising, expect your rate-sensitive and leveraged holdings to suffer before mega-cap cash generators do.
Metals, oil and emerging markets: where the charts diverge
Beyond rates and tech, the picture fragments further.
Silver fell more than 1%, and palladium has lost about 50% since its January peak. No sourced explanation exists; a stronger dollar, higher real yields, unwinding of crowded trades or industrial-demand worries are plausible hypotheses only. The trader says silver is close to violating its low for the year.
Oil moved the other way. Brent traded below $114 on 27 October on hopes of Persian Gulf de-escalation, yet USO rose more than 2.5% on Wednesday.
For readers weighing how long firm crude can last, our detailed coverage of the commodity glut shows how projected supply surpluses could reverse today’s oil strength.
Oil cuts both ways A firm oil price lifts energy stocks, but it also feeds the inflation the Fed says “remains elevated,” which complicates any path to lower rates.
| Asset | Observed move | Verification status | Chart read |
|---|---|---|---|
| Gold | Slightly lower, $4,064.20 | Schwab indicative, not a close | Weak after one-day reprieve |
| WTI crude | $102.13 (+2.26%) | Schwab indicative, not a close | Strong |
| XLE | About +0.67% | Trader-observed | Near Monday’s lifetime high |
| EEM | About +1.25% | Trader-observed | Gap near 64.30 is key |
| EWZ (Brazil) | About -2% | Trader-observed | Trading inside Monday’s bar |
Brazil is sliding on fiscal and political uncertainty around President Lula ahead of its presidential election, the next vote in a sequence that included Israel’s Knesset election on 27 October. The trader is short Mexico (EWW) and China (FXI), and sees a topping pattern in Argentina (ARGT).
These markets move for different reasons. Check each position against its own chart and catalyst rather than assuming a single risk-on or risk-off regime.
A practical framework for cutting risk before an election
With catalysts this scattered, sizing matters more than prediction. The trader expects a quiet election Tuesday and a chaotic Wednesday, though that is opinion, and no verified table of historical election-day returns exists to test it.
His approach translates into a repeatable checklist:
- Set the maximum gap loss you can tolerate before the event.
- Reduce margin so an adverse open cannot force a sale.
- Avoid re-entering positions you have already closed.
- Place defined stops on any short, such as staying below a price gap.
- Cut concentration in speculative names first.
Those speculative names are showing strain: IREN has lost about 23%, Reddit has printed three major tops, and Rigetti is reversing.
The trade-off is real:
- For cutting risk: protection against overnight gaps, no forced selling, room to act after the result
- Against cutting risk: missed gains if a relief rally follows, and cash drag if the event passes quietly
The research supports a barbell approach. Keep profitable, cash-generative leaders, and trim leverage, margin, speculative AI names and long-duration bonds.
A caution on signals Lower highs, broken channels and bearish candles flag risk. They do not prove a top.
Decide your tolerable loss now, and size positions so the outcome cannot make the decision for you.
What the hold changes, and what the election still decides
The Fed hold changed little. Bonds, oil and the Microsoft-Alphabet split showed where risk is actually concentrating.
Next comes Amazon’s report, the midterms on 3 November (Reuters reported investors leaning toward a Democratic Congress), and Brazil’s presidential vote. Each could gap prices in either direction.
Before Tuesday, set your position sizes, stop levels and margin tolerance, then revisit them after Wednesday’s open. This is educational analysis, not personalised advice.
This article is for informational purposes only and should not be considered financial advice. Investors should conduct their own research and consult with financial professionals before making investment decisions. Past performance does not guarantee future results, and views on market direction are speculative and subject to change.