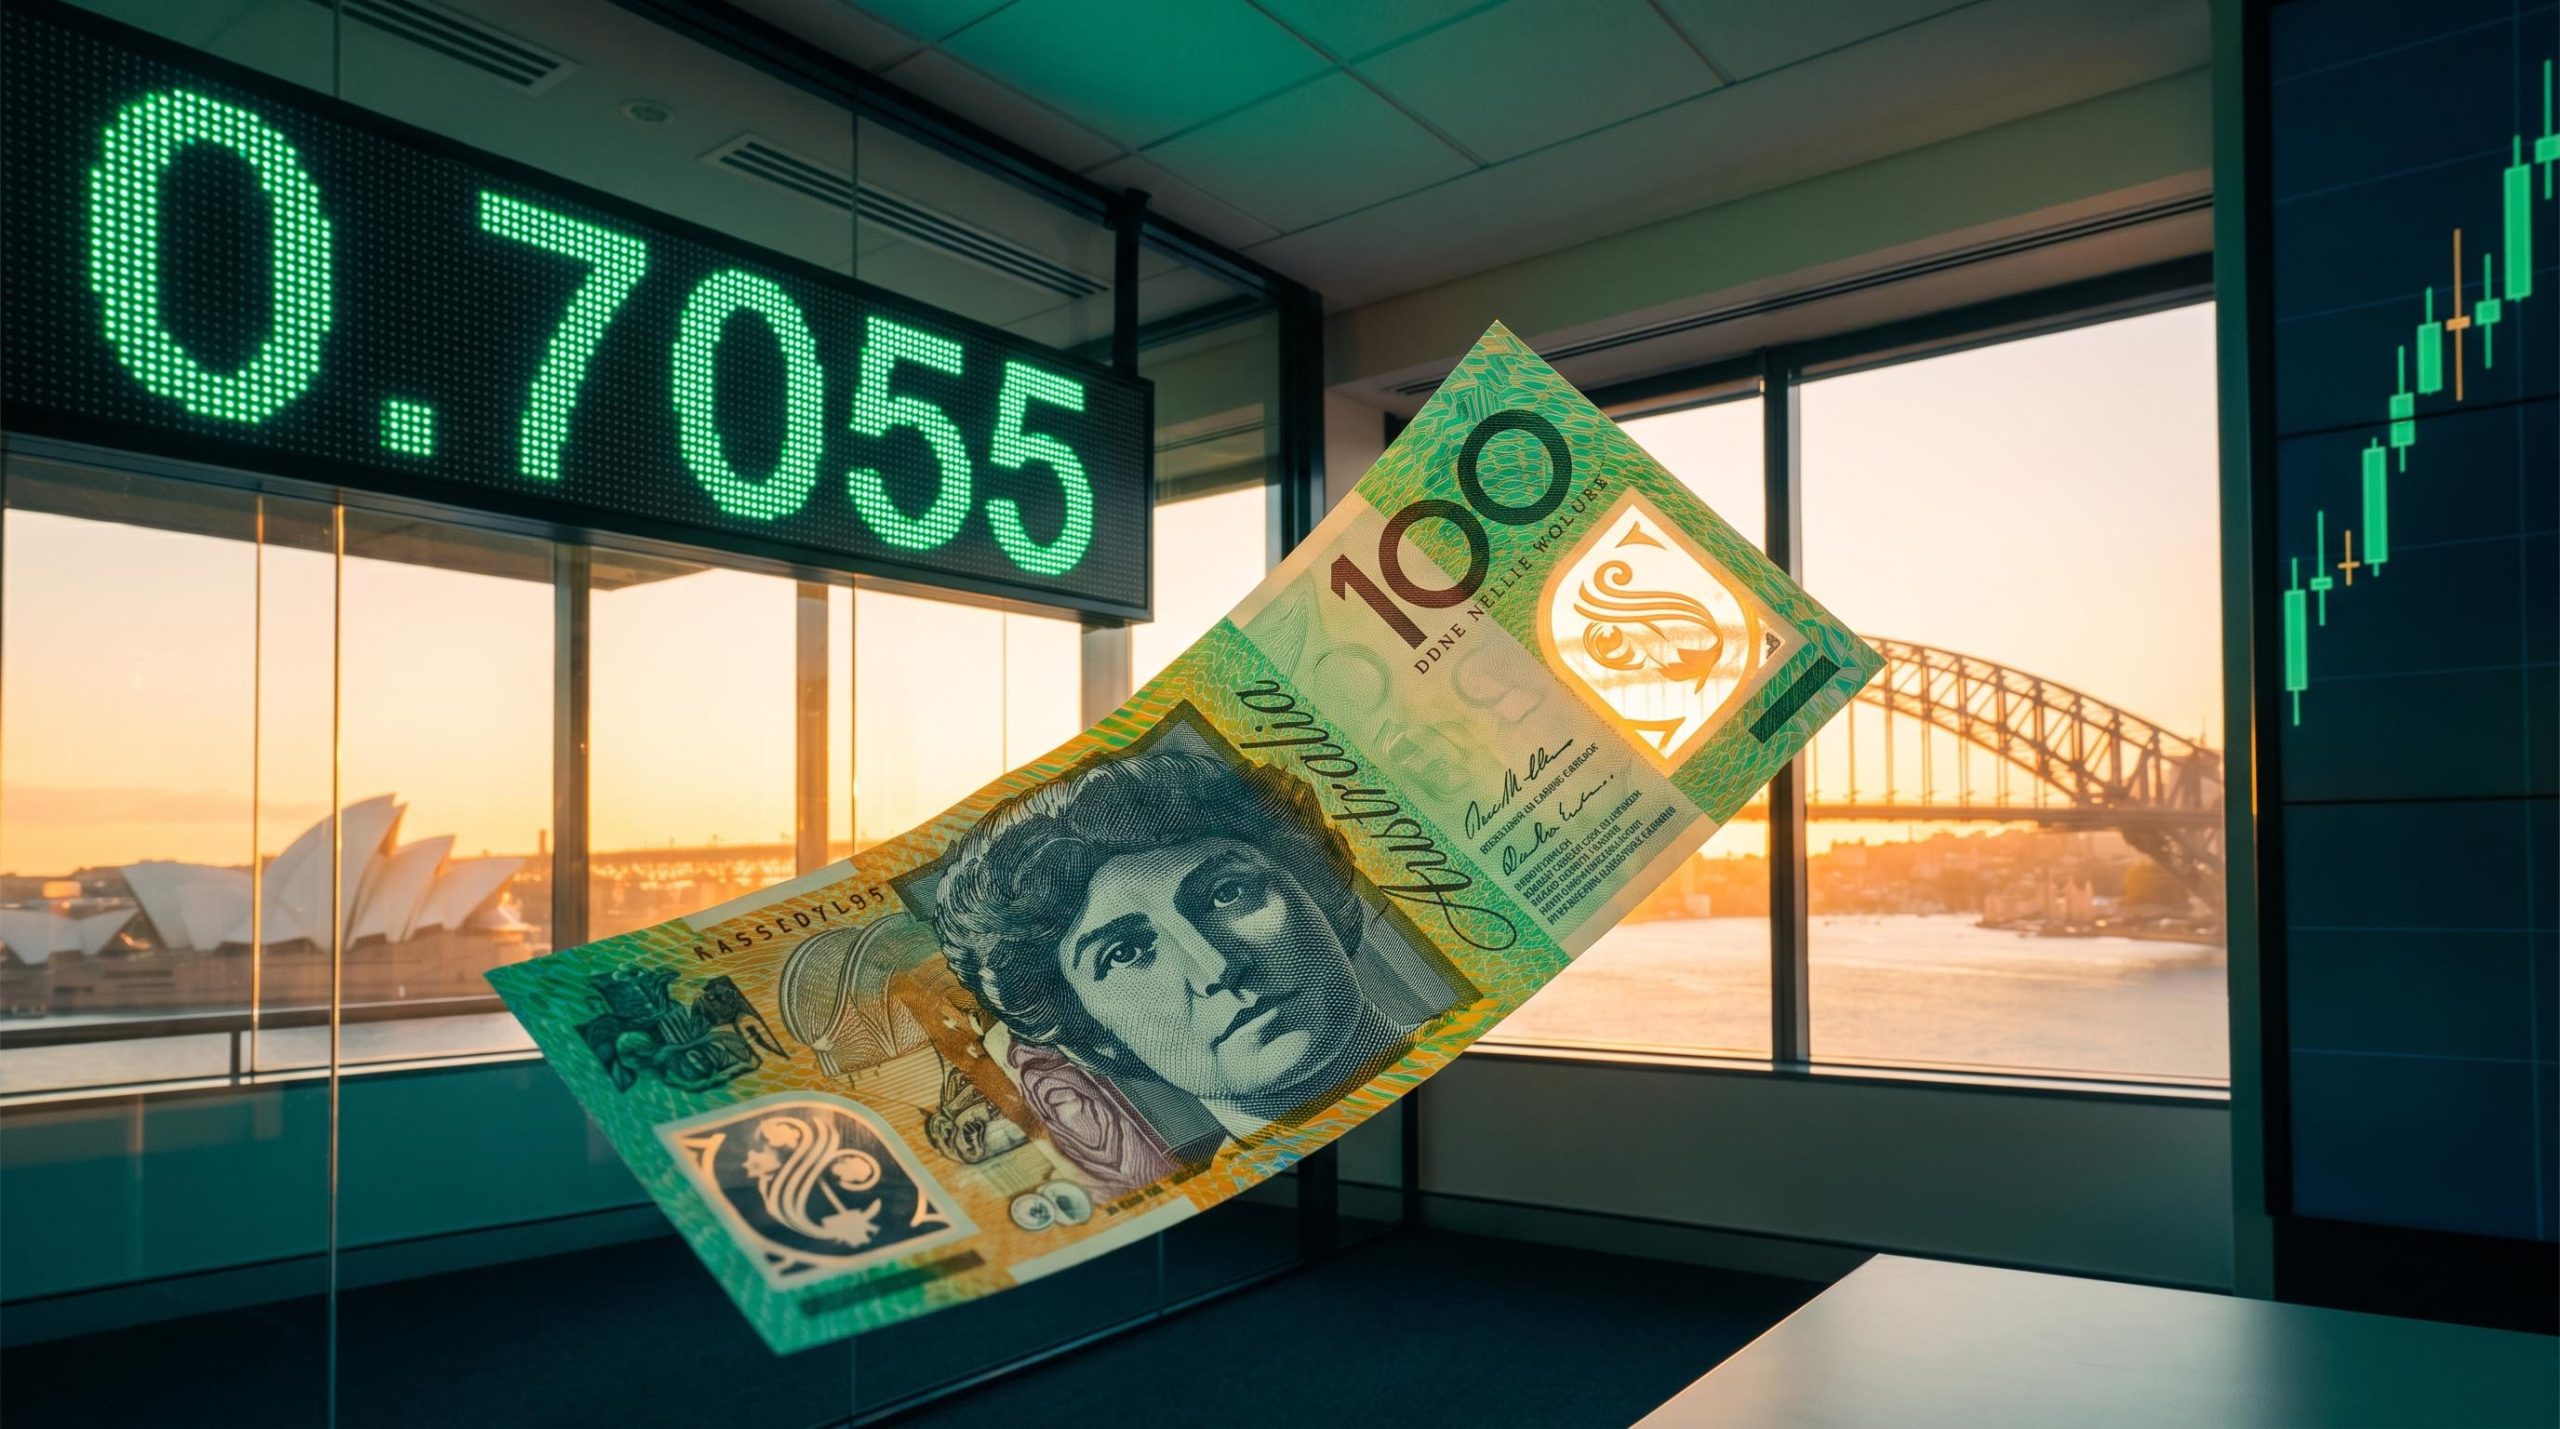
The Australian dollar pushed toward 0.7055 in Asian trading on Thursday after hotter-than-expected inflation data. September CPI and the Q3 trimmed mean both ran above the Reserve Bank of Australia’s (RBA) own forecasts, lifting the odds of a 3 November rate hike to roughly 82-90% and resetting the near-term AUD/USD forecast.
The other side of the pair moved less. The US Federal Reserve held its target range at 3.75%-4.00% on Wednesday, and Chair Kevin Warsh declined to offer any guidance on December.
That left the US dollar’s hawkish premium in place without adding to it. A hawkish premium is the extra value a currency carries because markets expect its central bank to keep rates high or raise them.
Here is why the Aussie is firming, how much of the next RBA move is already in the price, and which chart levels and outside forces will decide where the pair goes next.
Why did hot inflation push RBA hike odds above 80%?
The repricing came first and came fast. The ASX RBA Rate Tracker jumped from about 62% to about 82%. Brown Brothers Harriman (BBH), citing RBA futures, put the move at 60% to 85%, and other reports went as high as 90%.
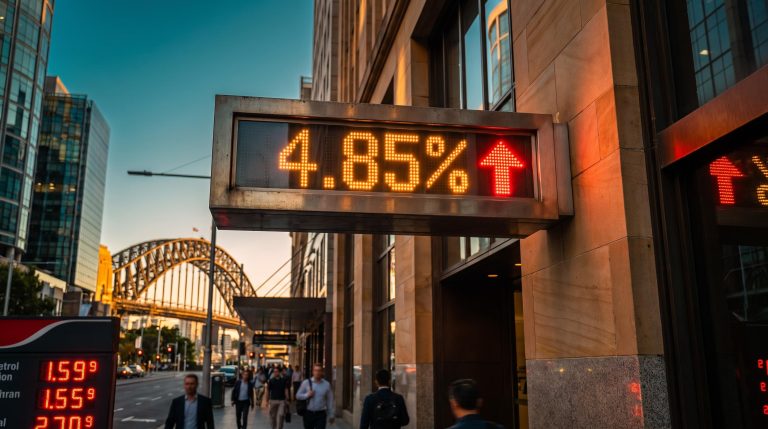
By the end of Wednesday, all four major banks (CBA, NAB, Westpac and ANZ) were calling a November hike. A move would take the cash rate from 4.60% to 4.85%, the fifth increase of the year.
Inflation surprises happen often. This one stood apart because it missed the RBA’s own numbers as well as the market’s.
| Measure | September result | Consensus or RBA reference |
|---|---|---|
| Monthly CPI (original) | +0.8% m/m | Consensus about +0.7% |
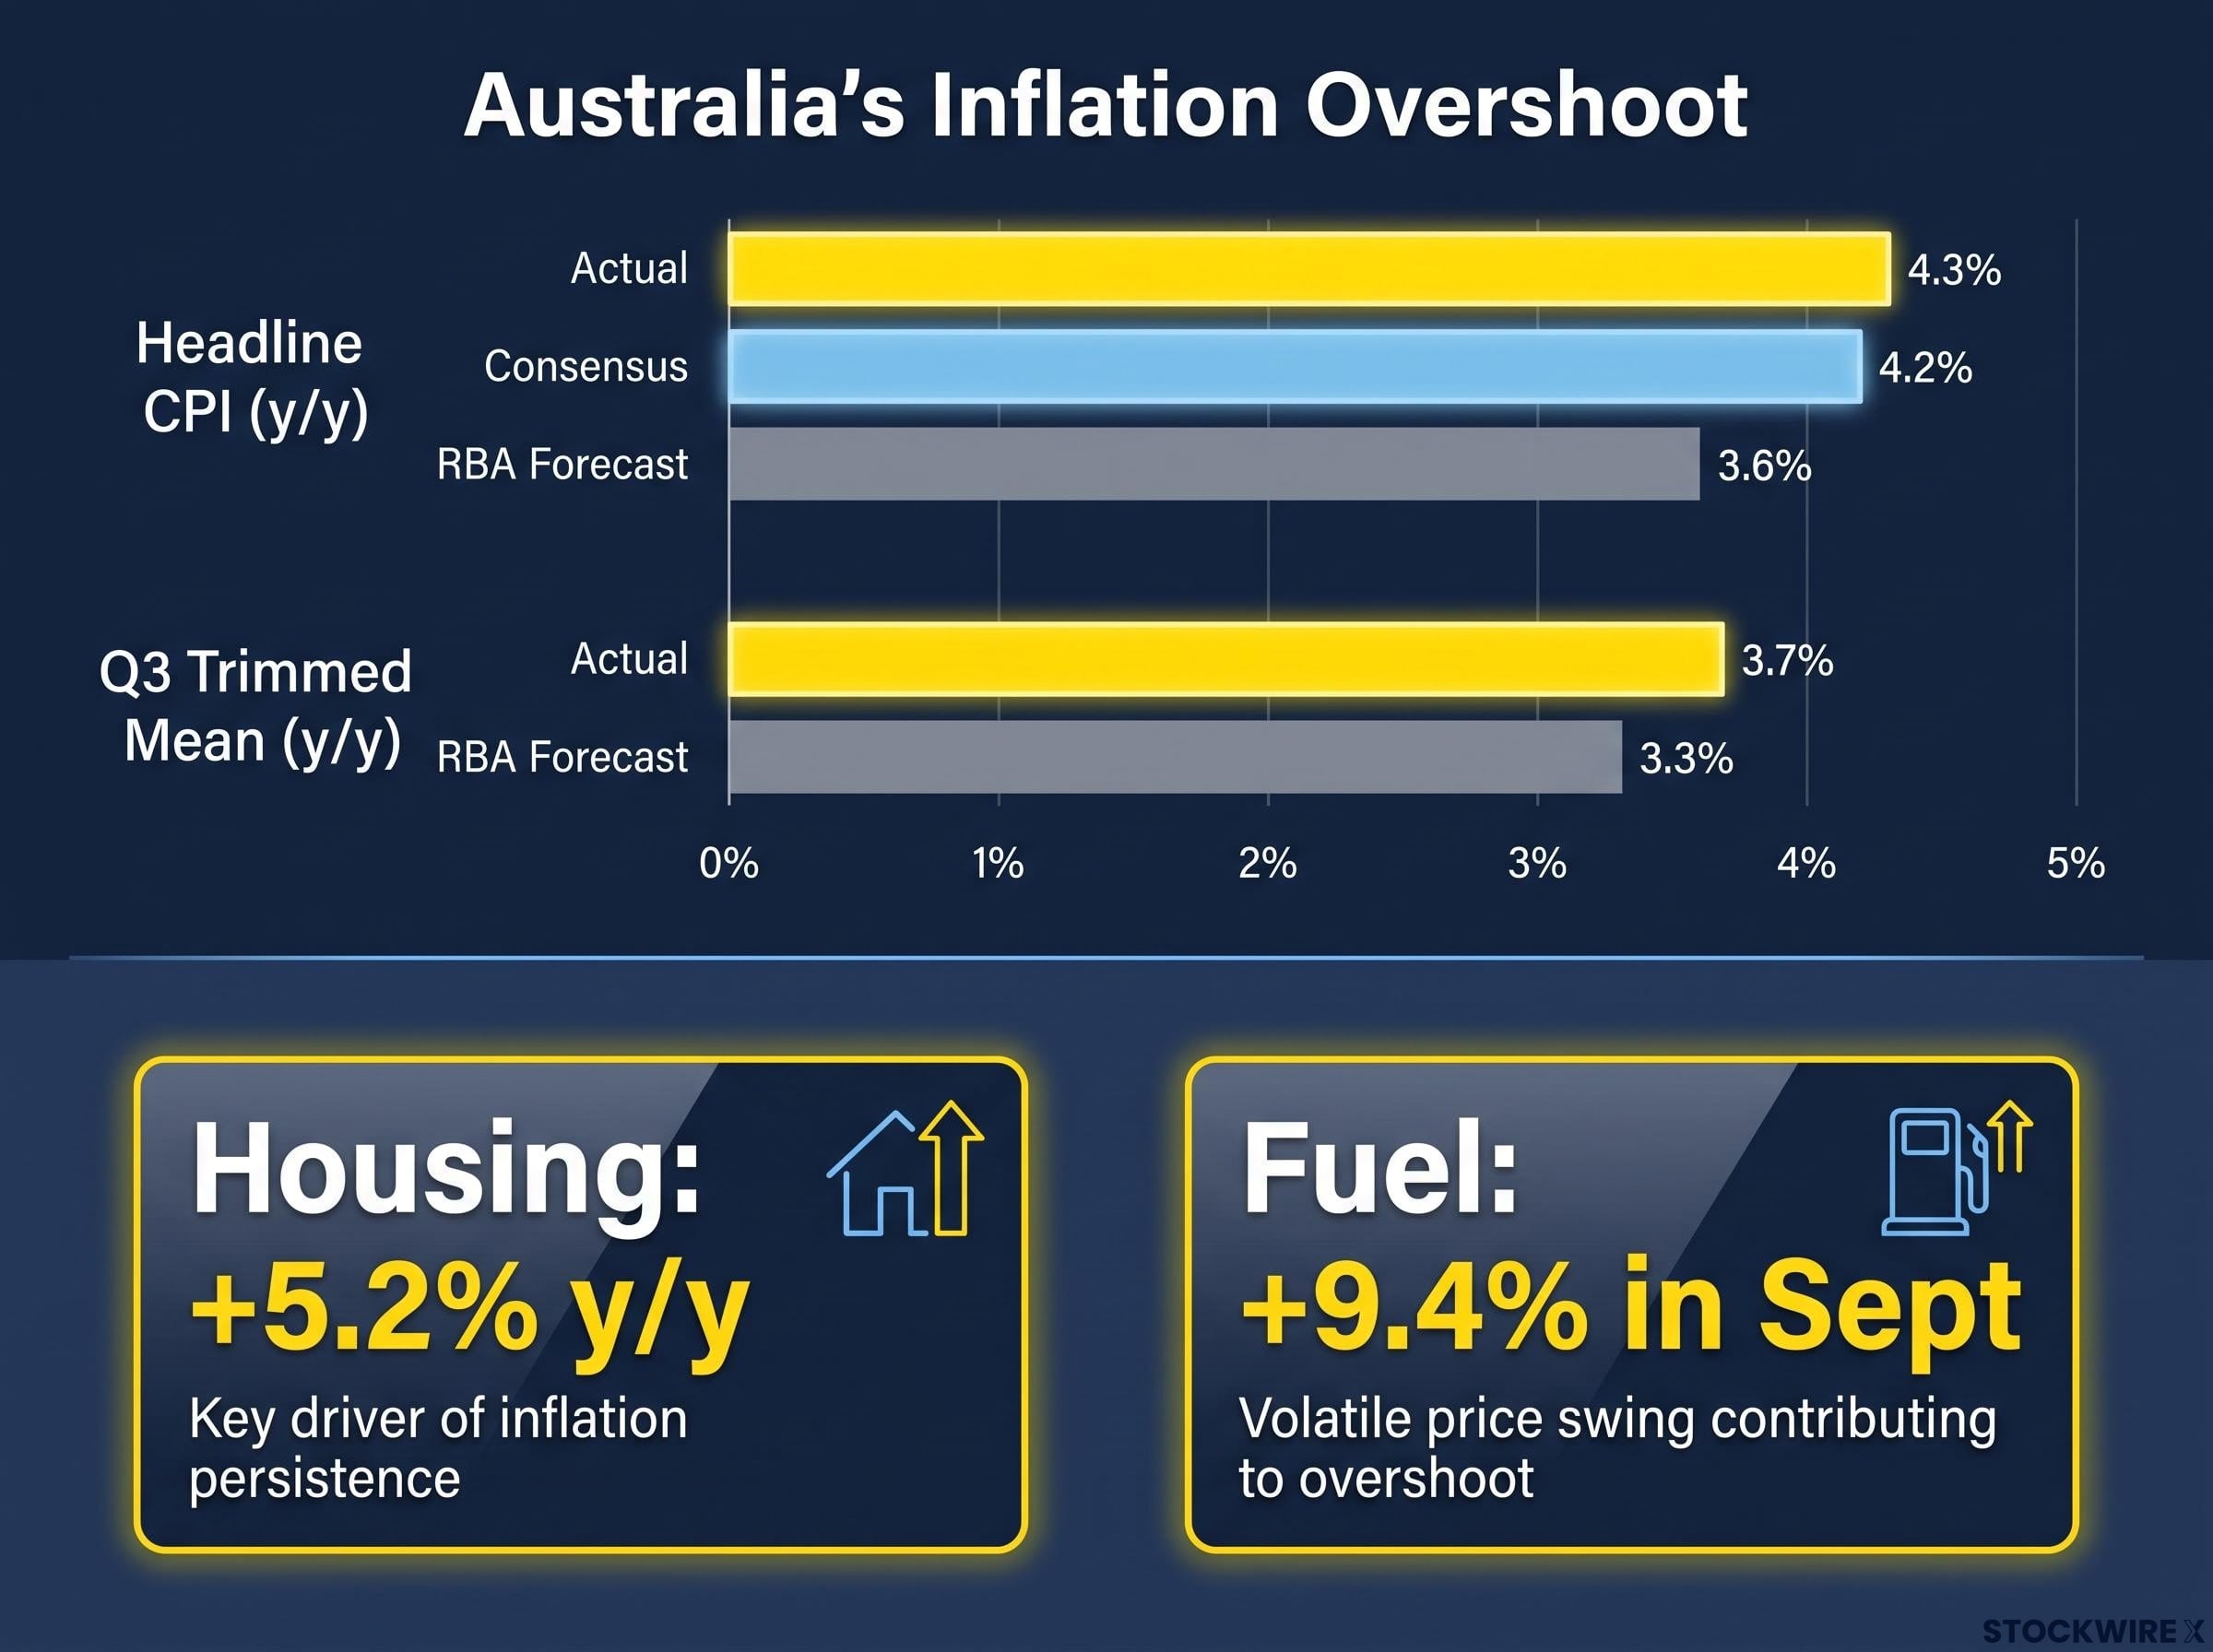
| Headline CPI | 4.3% y/y | Consensus 4.2%; RBA August year-end forecast 3.6% |
| Monthly trimmed mean | 3.6% y/y | Matched consensus |
| Q3 quarterly trimmed mean | +1.0% q/q; 3.7% y/y | RBA August forecast +0.8% q/q; year-end 3.3% |
A trimmed mean strips out the most extreme price moves at both ends to show underlying inflation. The 3.6% and 3.7% figures do not conflict. The first comes from the monthly indicator, and the second comes from the quarterly measure the RBA watches most closely.
Trimmed mean inflation has been the RBA’s policy anchor all year, and earlier hikes were justified by readings above the 2-3% target band even when fuel-driven headline spikes were expected to fade.
BBH said inflation is considerably worse than the RBA judged in August. The main drivers were:
- Housing: up 5.2% y/y, the largest annual contributor
- Fuel: automotive fuel up 9.4% in September
- Services and capacity: Westpac pointed to travel and property rates, alongside fuel
RBA Governor Michele Bullock said inflation reflects:
“persistent capacity pressures”
She also pointed to global cost pressures tied to the Middle East conflict. When inflation overshoots the central bank’s own forecast, the RBA has little room to pause, which is why markets now treat a November move as close to settled.
Cyclical shock or structural problem?
Part of the overshoot is cyclical, meaning it comes from temporary swings in conditions. Fuel and geopolitics fall into that group and could fade. Housing, services, spare capacity and weak productivity are structural, so they are harder to reverse.
A single volatile monthly print does not prove inflation is accelerating across the board. That is why the quarterly trimmed mean carries the weight.
How did the Fed’s hold leave the dollar’s premium intact but not reinforced?
On paper, the Fed’s decision looked hawkish. The vote to hold was 10-2, with Governor Lisa Cook and Cleveland Fed President Beth Hammack dissenting in favour of a hike. Warsh conceded that price stability has not been achieved.
Markets still read it as soft. Warsh gave no December guidance, short-term Treasury yields fell after his press conference, and the dollar failed to extend its gains.
Forward guidance is itself a policy tool, which is why Warsh’s refusal to signal a December move carried weight even though the target range did not change.
| Measure | RBA | Fed |
|---|---|---|
| Policy rate | 4.60% | 3.75%-4.00% |
| Latest action | Hike, 29 September | Hold, 28 October |
| Next-meeting pricing | About 82-90% hike | 78% December hike |
| Guidance | Bullock flags capacity pressures | None on December |
December hike odds on CME FedWatch slipped to 78%, down from about 83-85% straight after the decision. Carol Kong, currency strategist at Commonwealth Bank, said the silence was read as:
“dovish, or not hawkish enough”
FXStreet’s Speechtracker scored Warsh at 5.6/10, below its 6.1/10 average, while its Fed Sentiment Index held at 127.51. Newsquawk tied the dollar’s dip to the lack of a hawkish surprise.
Both readings can hold at once. Two dissents for a hike show the inflation risk is serious, which supports the dollar over the medium term, and ING expects the currency to consolidate near the top of its recent range.
The Fed did not remove support for the dollar. It simply failed to add to it, so the Aussie’s gain owes more to Australian repricing than to US weakness. US September PCE inflation, the Fed’s preferred inflation gauge, is due later Thursday and is the next test.
What are the key AUD/USD levels and drivers to watch next?
Daily technical levels
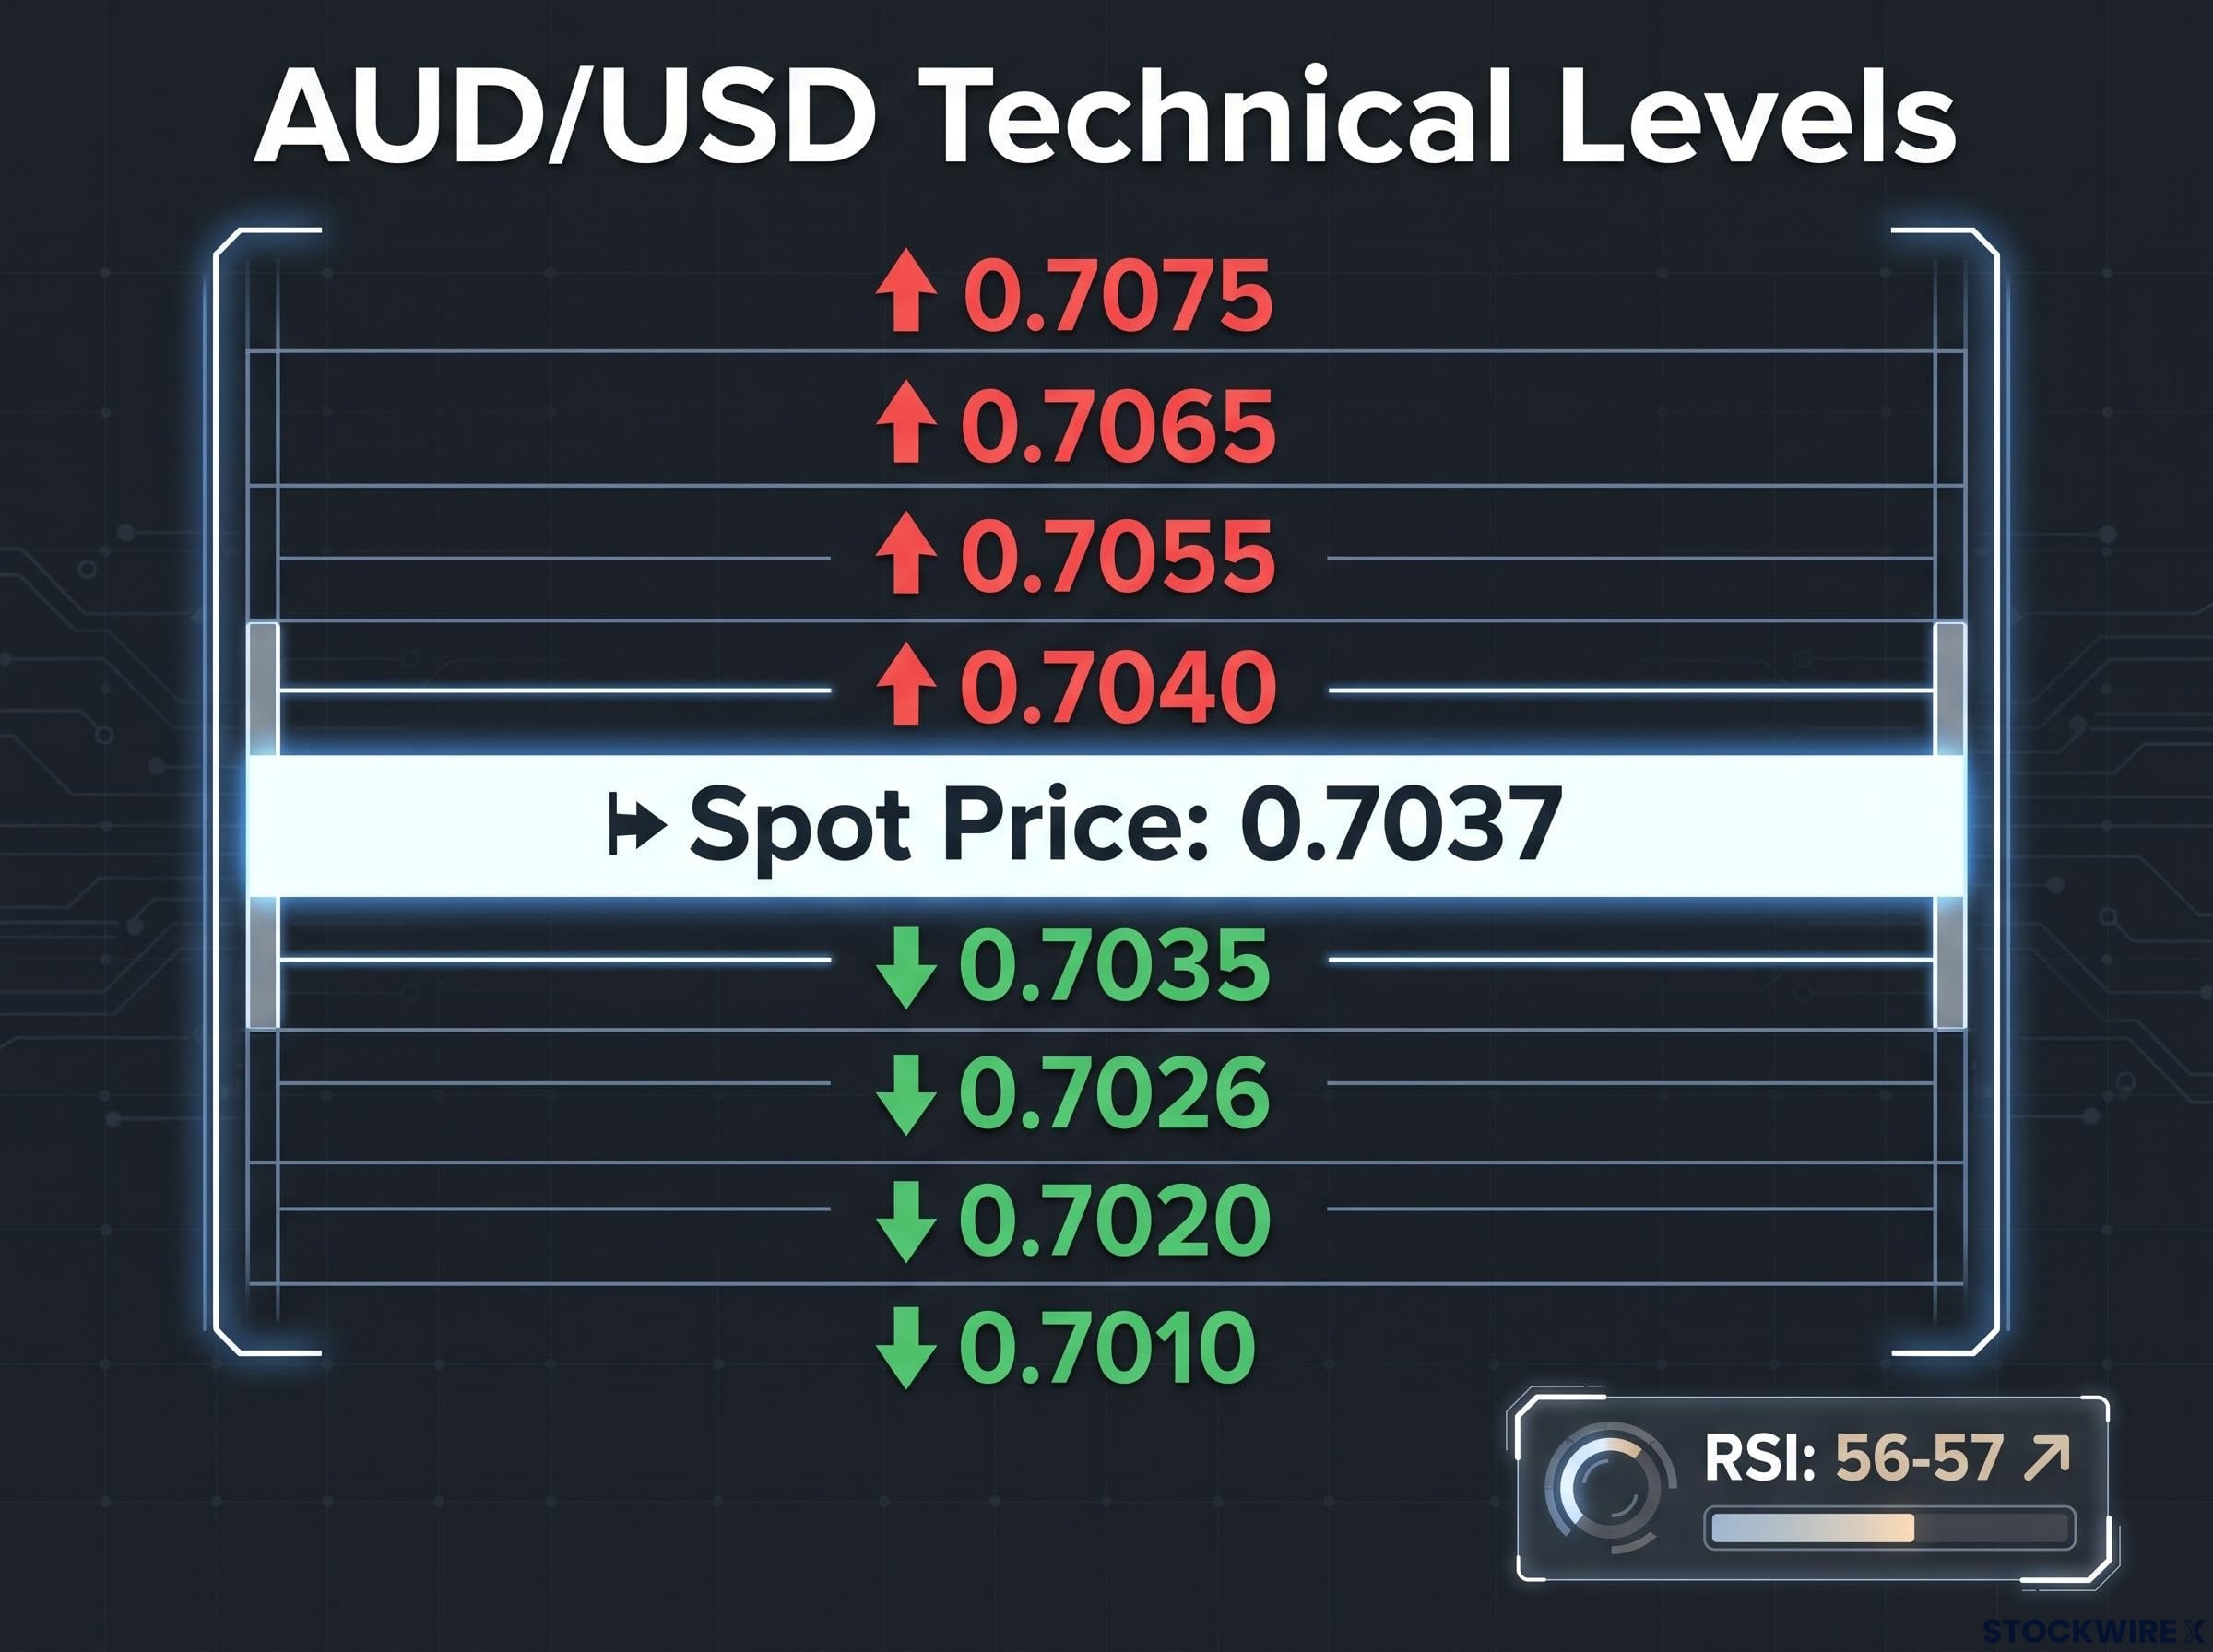
Spot was last around 0.7037, after touching about 0.7055 during Asian hours.
| Level | Type | Source note |
|---|---|---|
| 0.7075 | Resistance | Higher barrier |
| 0.7065 | Resistance | Upper Bollinger band, FXStreet daily |
| 0.7055 | Resistance | Asian-hours high |
| 0.7040 | Resistance | Immediate |
| 0.7035 | Support | FXStreet daily 100-day SMA |
| 0.7026 | Support | 100-period SMA, separate analysis |
| 0.7020 | Support | Trend line |
| 0.7010 | Support | 200-period SMA |
A simple moving average (SMA) is the average closing price over a set number of periods. Sources place it differently because they use different timeframes and tools. Bollinger bands mark a typical trading range around that average.
FXStreet sees a mildly bullish bias, with price above the 100-day SMA. The Relative Strength Index (RSI), which measures momentum on a 0-100 scale, sits near 56-57, positive but not overbought.
What moves the Australian dollar
The chart only shows where price has been. The forces below decide whether those levels hold:
- RBA interest rates
- Chinese demand
- Iron ore prices
- Australia’s trade balance
- Global risk sentiment
Any of these can override the rate story. A weaker China, a risk-off sell-off in equities, a reversal in energy prices or strain on indebted households could all cap gains. The biggest near-term risk is a hike paired with a pause signal, which could trigger a “buy the rumour, sell the fact” reversal, where traders sell once the expected event arrives. In 2022, the Aussie’s rate support was repeatedly blunted by a strong US dollar, China worries and risk aversion.
With a hike already about 82-90% priced, the guidance attached to the 3 November decision matters more to you than the hike itself.
What the hike is worth, and what would change the picture
The Aussie’s lift rests on two things: a November RBA hike that markets now treat as close to certain, and a US dollar premium the Fed left in place but did not strengthen. Most of the good news is already in the price, so further gains need fresh fuel.
Three variables will supply it or take it away:
- The RBA’s 3 November guidance: a signal of more tightening supports the pair, while a pause signal risks a reversal.
- US PCE and December Fed pricing: a hot print could restore the dollar’s momentum.
- China and risk sentiment: these can outweigh the rate gap entirely.
Past performance does not guarantee future results. Financial projections are subject to market conditions and various risk factors. This article is for informational purposes only and should not be considered financial advice. Investors should conduct their own research and consult with financial professionals before making investment decisions.