Why Hyperscaler Capex Could Be $300 Billion Bigger Than Priced
1 hr ago

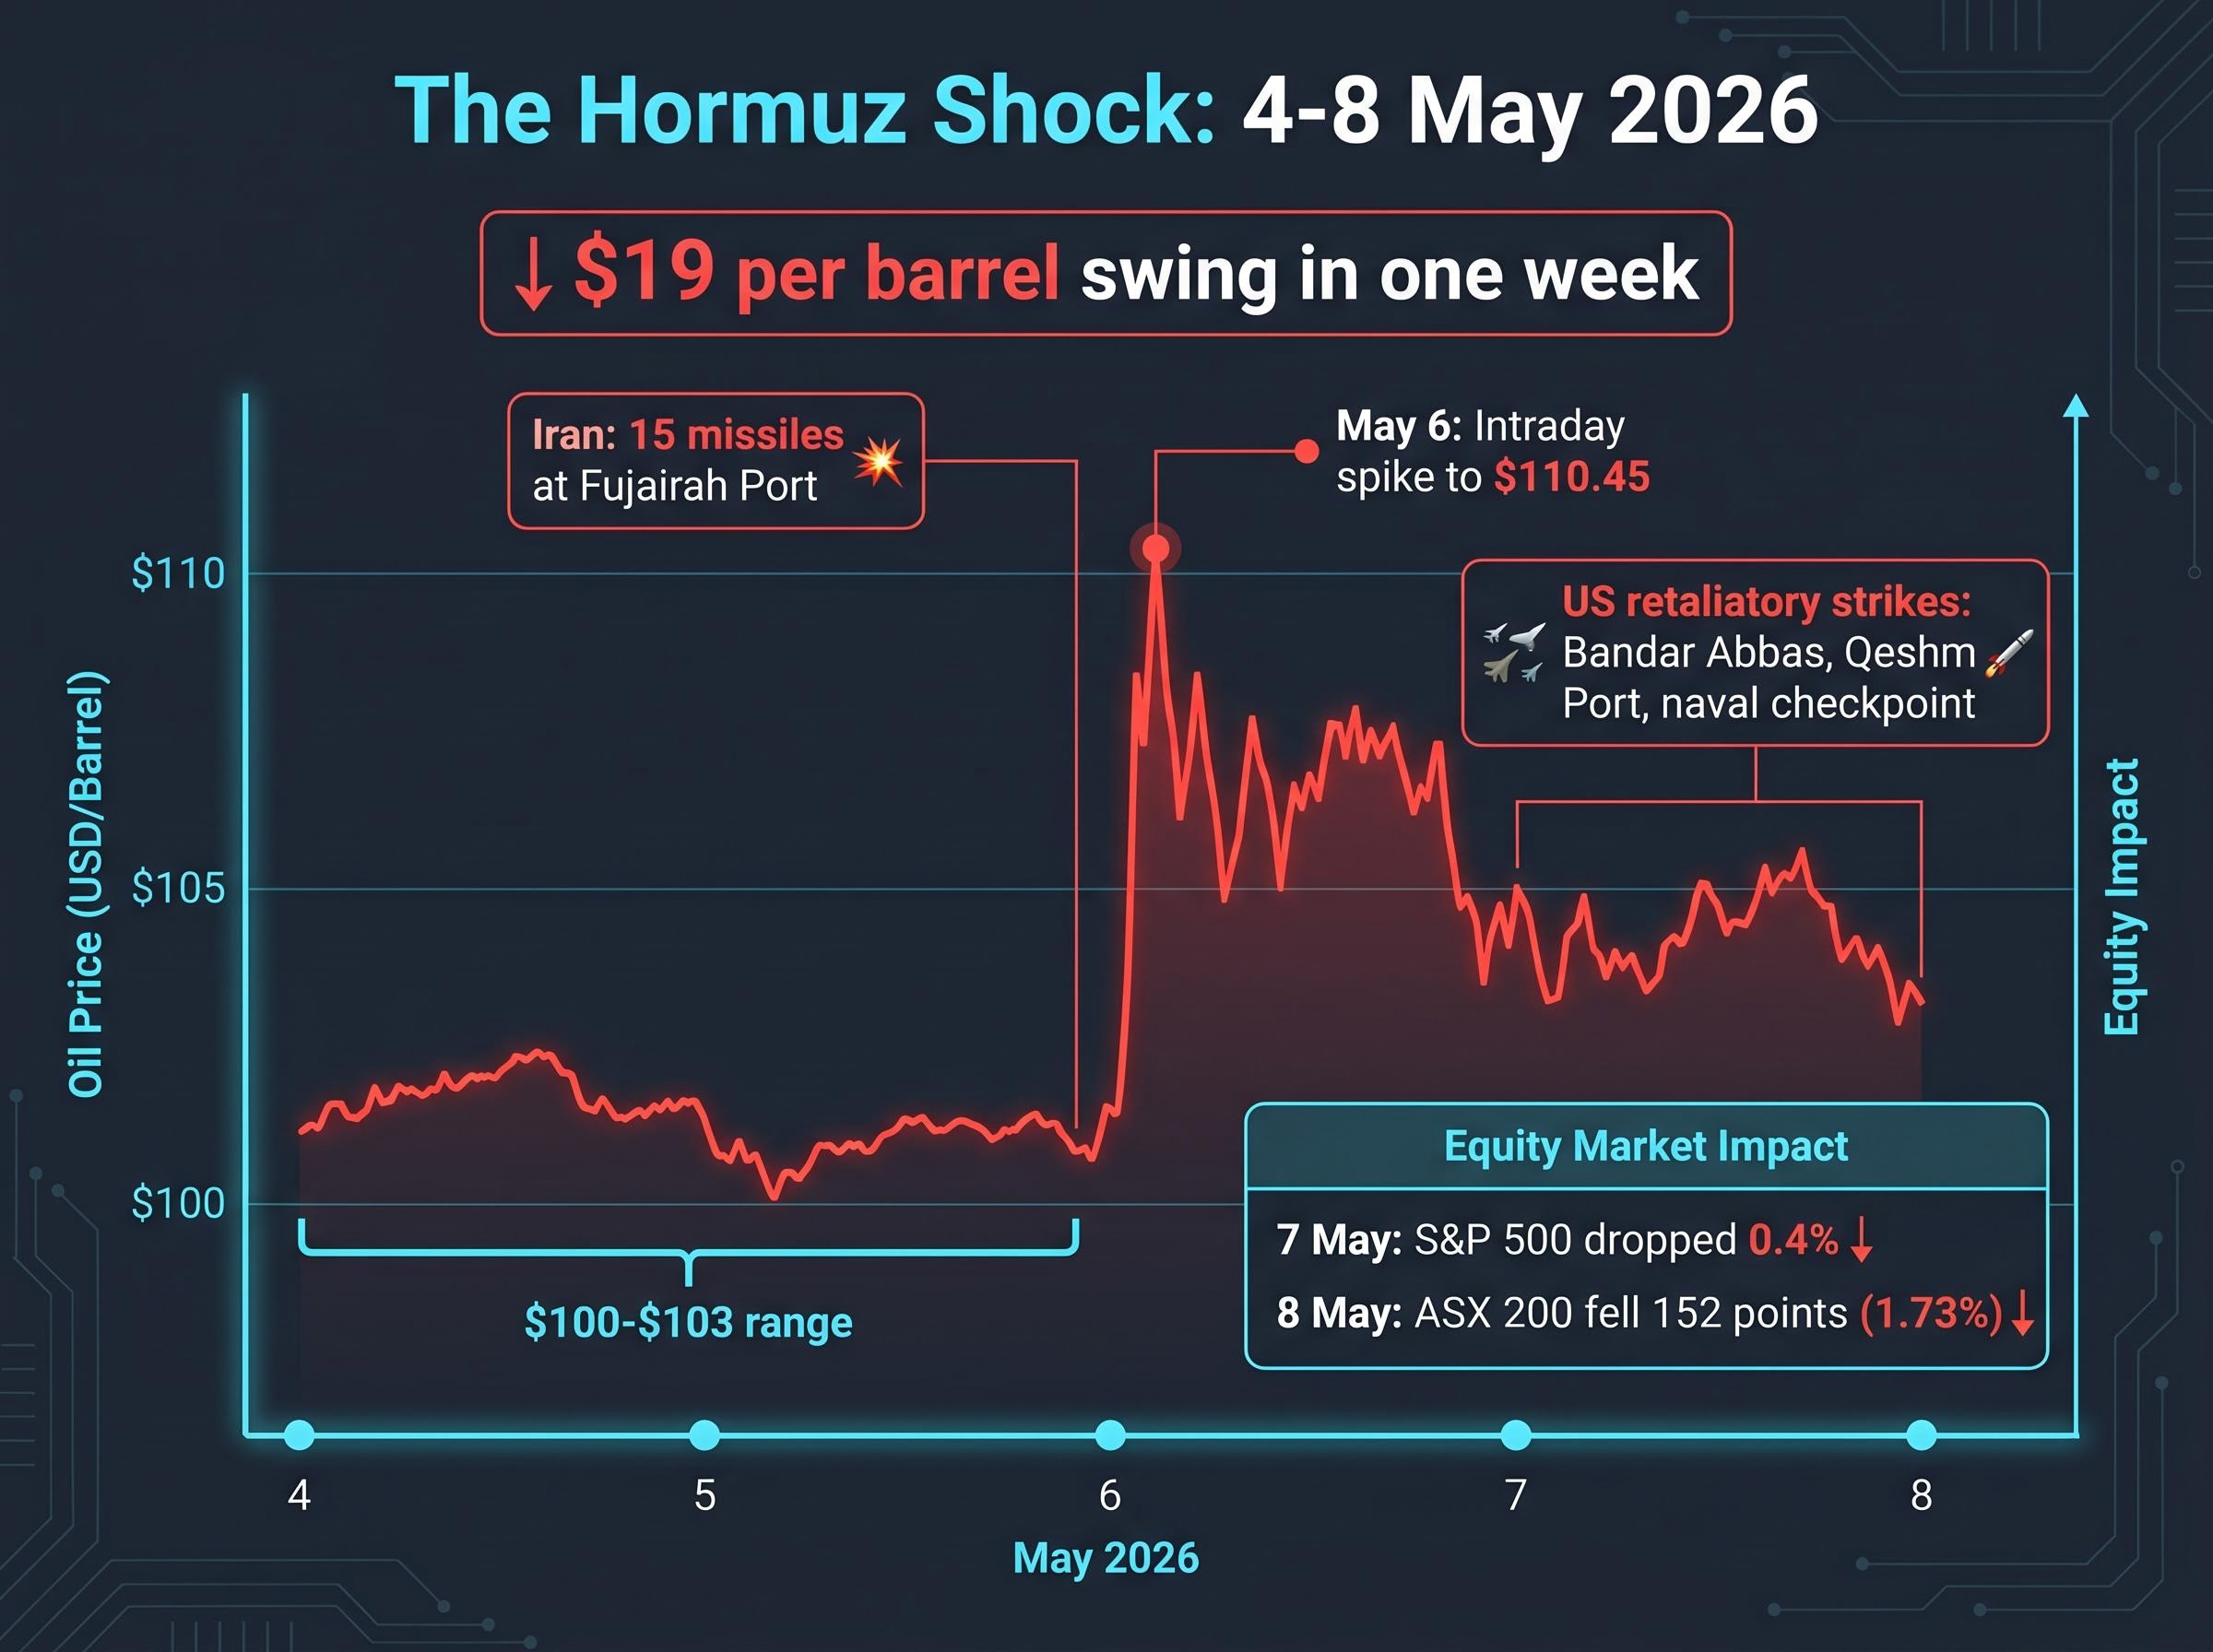
Brent crude swung nearly $19 per barrel within a single trading week in early May 2026, a range that historically takes months to play out. One waterway is responsible.
The Strait of Hormuz carries roughly 20% of the world’s traded oil. US-Iran military exchanges in and around the strait have turned it into the most closely watched chokepoint in global energy markets, generating price volatility now flowing through to consumer prices, corporate earnings, and central bank forecasts worldwide. For any portfolio with energy exposure, commodity-linked equities, or inflation-sensitive fixed income, the Hormuz crisis is not background noise. It is an active repricing event.
What follows explains why the strait generates such outsized price swings, what the current conflict’s mechanics mean for supply, how the world’s largest oil importers are responding, and which signals analysts are watching for signs that the risk premium will fade.
During the week of 4-8 May 2026, Brent crude traded broadly in the $100–$103 range for the week (with a notable intraday move around May 6 to approximately $110.45). In a market where typical weekly volatility is measured in single dollars, a $19 range within five sessions is an anomaly that demands disaggregation.
The defining data point: Brent crude moved nearly $19 per barrel in a single trading week, a range that would normally take months to develop.
The swing was not random. Each intraday spike and reversal mapped to a specific military event within hours of its occurrence. The price action during the week validated that revised outlook in real time.
Tracking the conflict escalation from baseline helps contextualise the week’s price swings: Brent had traded in the $72-$74 range before hostilities began, meaning the $100-plus levels of early May represent a cumulative risk premium built over months of military exchanges, not a single-week phenomenon.
Equity markets registered the shock immediately. ASX 200 futures fell 152 points (approximately 1.73%) on 8 May pre-market trading, while the S&P 500 dropped 0.4% on 7 May.
The chronological trigger chain behind the week’s volatility was compressed and escalatory:
Each event produced measurable price responses within hours. The volatility itself became a signal: markets were not simply reacting to supply headlines but repricing the probability distribution of outcomes in the strait with every military exchange.
The Strait of Hormuz is a narrow waterway between Iran and Oman through which approximately 20% of the world’s traded oil passes daily. There is no near-equivalent alternative route capable of handling that volume at scale. When military activity restricts or threatens passage, the effect on oil markets follows a specific transmission chain.
That risk premium, the portion of the oil price attributable to geopolitical uncertainty rather than supply-demand fundamentals, is what separates Hormuz-driven price moves from ordinary market volatility. It is a distinct, measurable component of crude pricing that persists as long as the threat to passage remains credible.
War risk insurance withdrawal has operated as a third enforcement layer alongside the competing US and Iranian naval operations, with the near-total exit of commercial coverage from Lloyd’s and peer syndicates effectively closing the strait to commercial traffic even when physical passage was technically possible under military escort.
IEA Executive Director Fatih Birol warned that major importers may have approximately six weeks of usable reserves at disrupted supply rates, characterising the situation as among the most severe energy security threats in decades (Bloomberg, 16 April 2026).
A physical crude market buffer of approximately 700-800 million barrels, accumulated over the prior 12 months, is now being drawn down at an accelerated pace. The IEA has framed a potential two-year supply chain recovery timeline even in a best-case resolution scenario. Understanding these mechanics separates signal from noise: every diplomatic headline or military exchange near Hormuz now has a quantifiable pathway to crude pricing.
The same crisis looks different from Tokyo, Beijing, New Delhi, and Seoul, but the scramble is universal. All four of Asia’s largest oil importers are executing emergency responses simultaneously, and the collective scale of their rerouting and reserve actions reveals why a Hormuz disruption is a global supply chain emergency, not a regional problem.
| Country | SPR Action | Rerouting Response | Alternative Suppliers |
|---|---|---|---|
| Japan | ~20 days of extra reserves released (~36 million barrels), ordered by PM Takaichi | Significant Cape of Good Hope rerouting; Inpex boosting Australian LNG swaps | Australian condensate, diversified spot purchasing |
| China | Accelerating strategic reserve site construction and stockpiling | Cape of Good Hope and Malacca Strait rerouting | Russian, US, West African crude |
| India | Declined IEA-coordinated reserve releases | Reliance Industries and IOCL securing alternative cargoes at elevated premiums | US Gulf, Malaysian crude via VLCC charters |
| South Korea | SPR draws underway | 80%+ of Middle East imports reportedly rerouted | UAE and West African suppliers at premium pricing |
Japan’s reserve release, ordered by Prime Minister Takaichi (Reuters, 10 April 2026), is the most clearly verified SPR action among the four. India’s refusal to participate in the IEA-coordinated response stands out as a divergent strategy, with Reliance Industries and IOCL instead securing alternative cargoes independently at elevated premiums.
Despite the different approaches, a common cost theme runs across all four nations. Each is absorbing 10-20% higher import costs driven by longer routing, freight premiums, and spot market tightness. No major supply shortages have materialised through early May due to buffer inventories, but analysts flag Q3 2026 rationing risk if no resolution materialises.
The rerouting and diversification decisions being made now by these importers will reshape tanker demand patterns, freight rates, and non-Gulf supplier revenues for years beyond the immediate conflict.
Oil futures capture the headline risk. The tanker freight market captures something different: how severely the physical market participants, the shipowners, insurers, and operators who move actual barrels, view the disruption.
Cape of Good Hope rerouting has become the default for Persian Gulf crude and LNG shipments, with Suez Canal oil tanker transits falling sharply across most vessel categories. The rerouting adds 20-30 days to Asia-bound crude delivery timelines, creating refinery scheduling disruptions even where physical supply is ultimately secured.
The freight rate data tells the story:
$110,000 per day: The current VLCC daily hire rate, a real-time, market-priced indicator of how seriously physical market participants view the Hormuz disruption.
African bunkering hubs, particularly Cape Town and Durban, are reporting significant traffic increases as rerouted vessels refuel on the longer journey (Reuters, 23 March 2026).
| Metric | Current Level |
|---|---|
| VLCC Gulf-to-China rate | ~$80.69/metric ton |
| Daily VLCC hire rate | ~$110,000/day |
Rising freight rates are not contained within the shipping market. They embed into refined product costs, meaning the tanker market functions as an independent, real-time signal of geopolitical risk that often moves faster than oil futures themselves.
Lloyd’s List VLCC rate benchmarks and war-risk insurance data provide the most granular physical-market read on Hormuz disruption severity, capturing how shipowners, underwriters, and operators price the actual risk of transiting conflict-adjacent waters in ways that crude futures curves alone cannot reflect.
The April 8 ceasefire, mediated by Pakistan, marked the first meaningful de-escalation since hostilities intensified. Subsequent diplomatic activity has been material: the US paused Hormuz operational pressure in response to ceasefire progress (Axios, 5 May 2026), and a 30-day deeper negotiations framework is under active discussion between Washington and Tehran (Al Jazeera, 6 May 2026).
Whether Hormuz passage or nuclear discussions are addressed first remains contested, but talks are live. The question for investors is not predicting the diplomatic outcome; it is knowing which observable data points will move markets first.
The resolution signal checklist:
Analyst timelines span a wide range, reflecting genuine uncertainty:
| Institution | Forecast | Key Assumption |
|---|---|---|
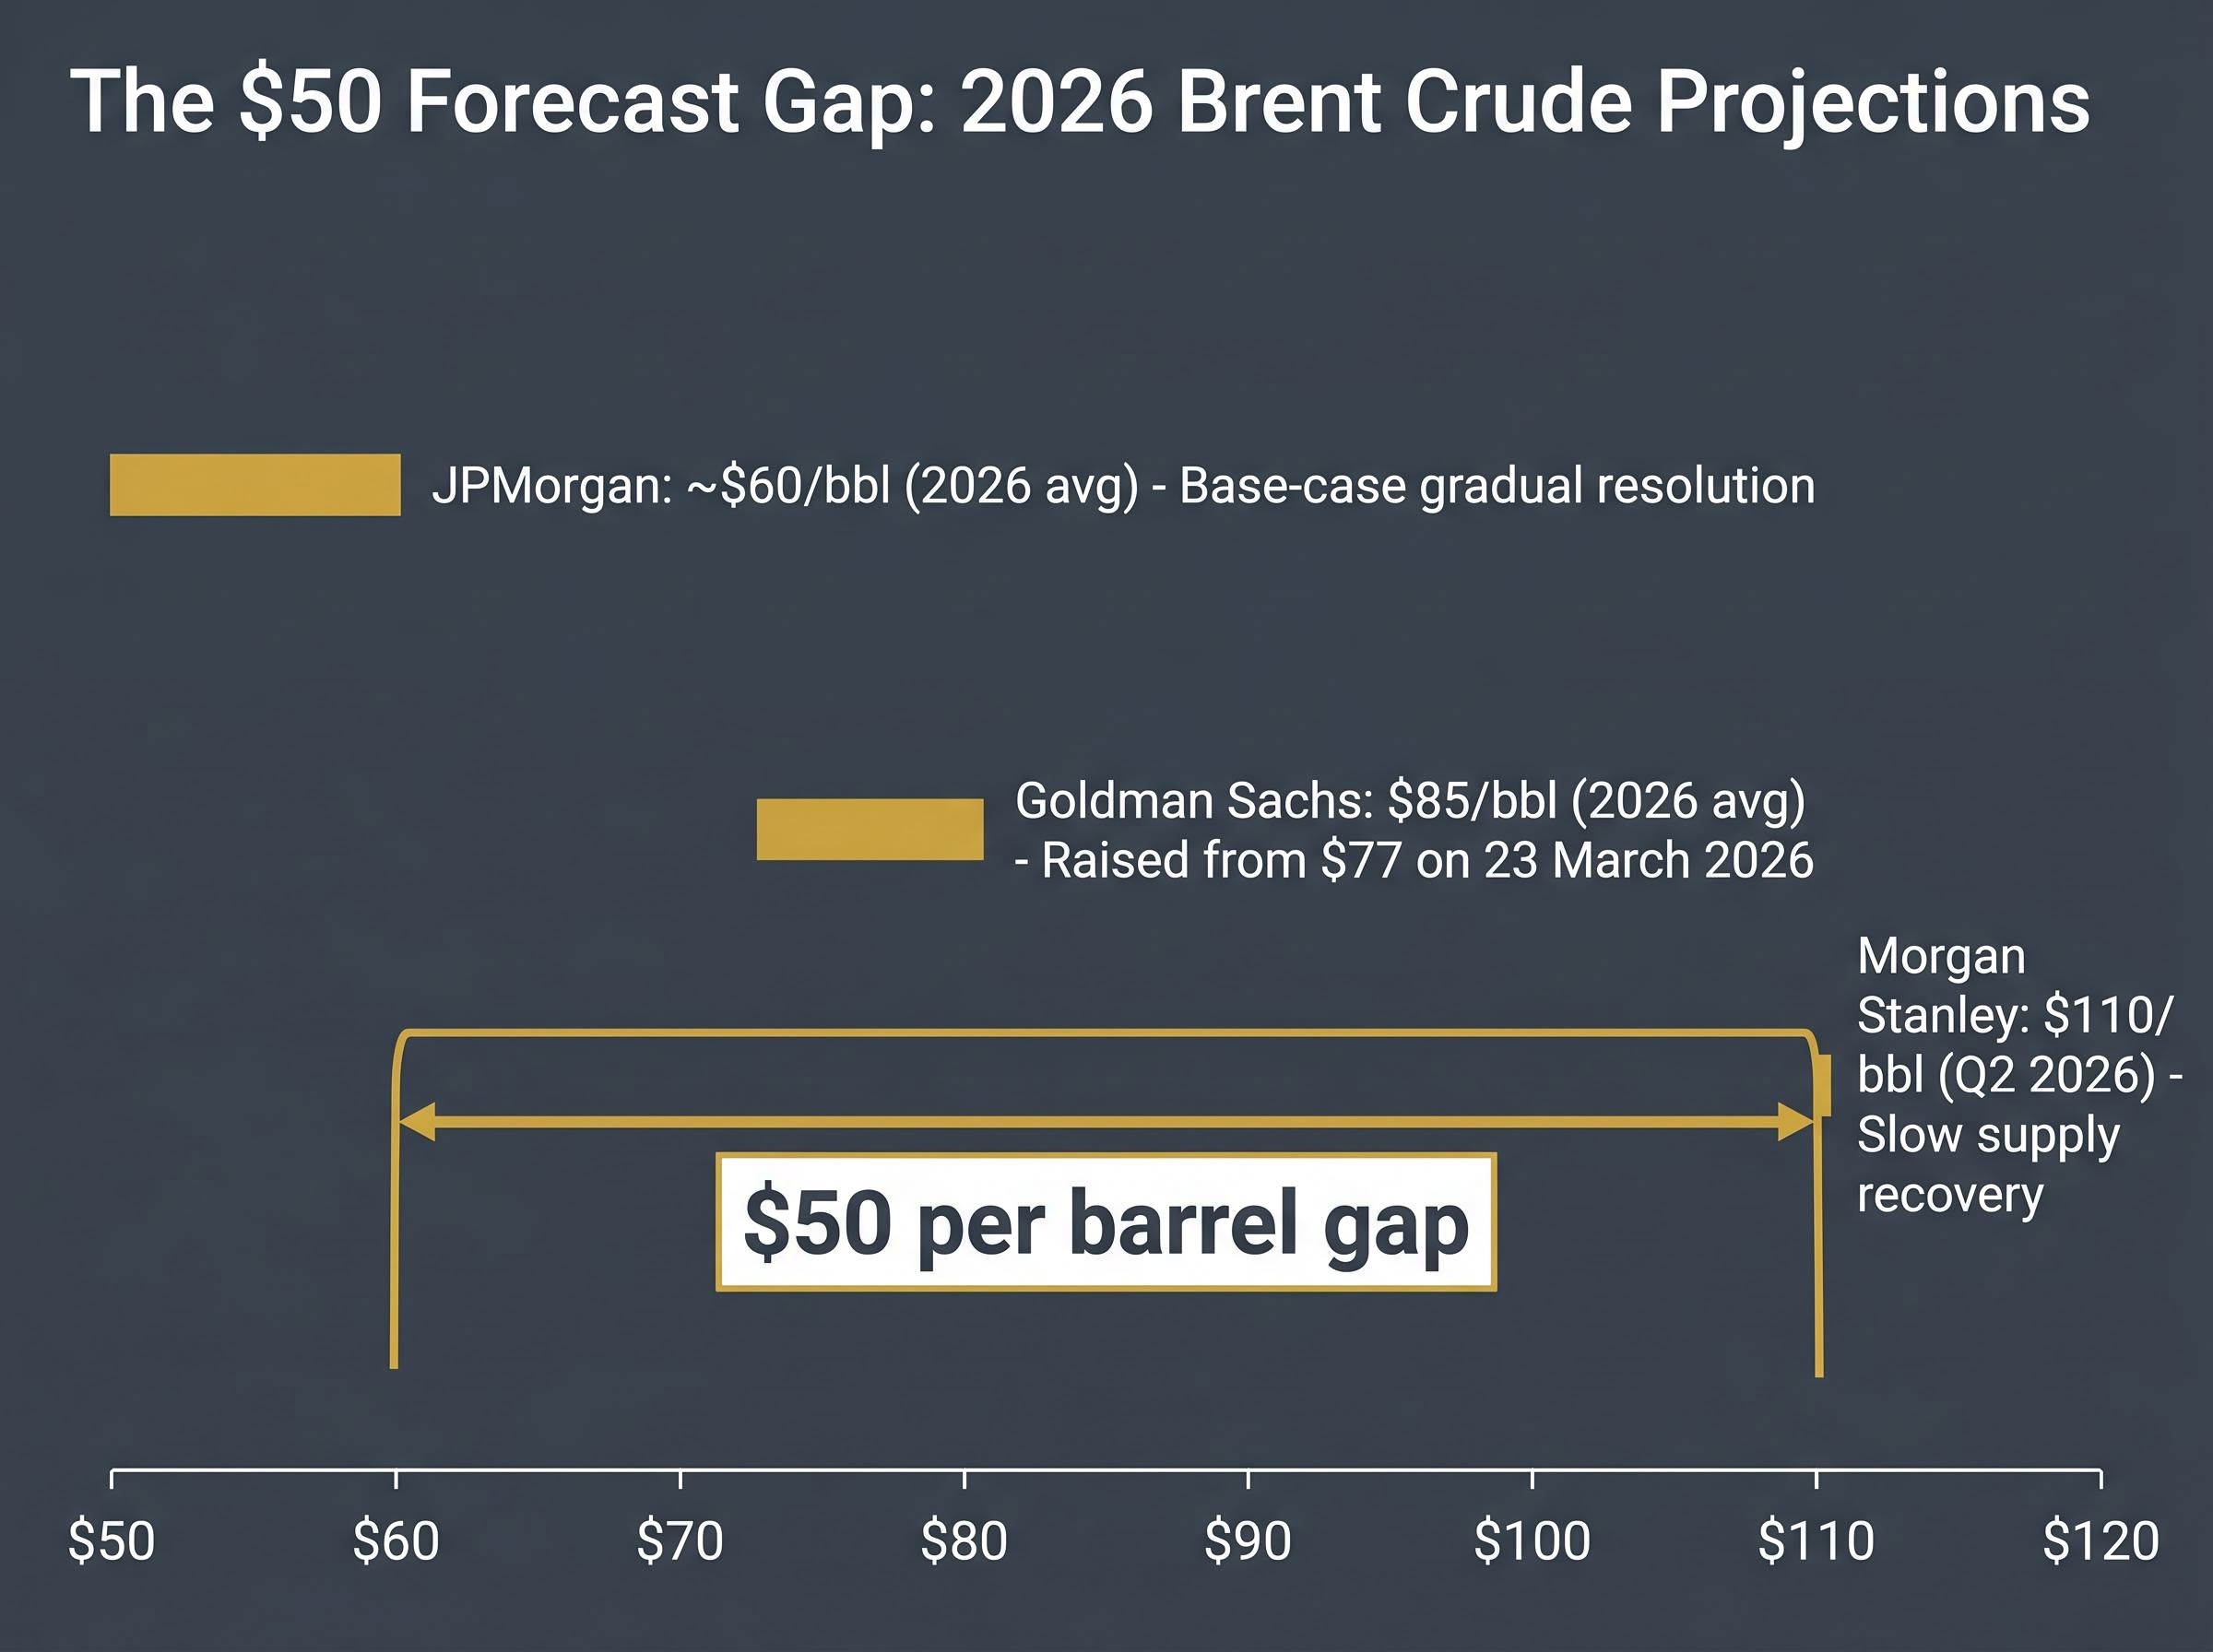
| Goldman Sachs | 2026 avg Brent: $85/bbl | Gradual normalisation; raised from $77 (23 March 2026) |
| Morgan Stanley | Q2 2026 Brent: $110/bbl | Slow supply recovery through mid-2026 |
| JPMorgan | 2026 avg Brent: ~$60/bbl | Base-case gradual resolution |
The $50 per barrel gap between JPMorgan’s and Morgan Stanley’s forecasts quantifies the uncertainty. Canadian oil sands could potentially add approximately 1 million barrels per day by Q4 2026 as a structural supply response, offering partial offset regardless of the diplomatic outcome.
Even if the April 8 ceasefire holds and negotiations succeed, the IEA’s two-year recovery timeline means the Hormuz premium will decompress slowly, not snap back to pre-crisis levels. Full supply chain normalisation requires the unwinding of tanker contract disruptions, insurance market re-rating, and repair of infrastructure damage, none of which respond to a diplomatic announcement.
Three structural changes are already locked in regardless of how the diplomacy resolves:
Tanker insurance re-rating has historically lagged the resumption of physical transit by several weeks, a dynamic confirmed by the Operation Earnest Will precedent from 1987-1988, where US military convoy operations restored shipping confidence before diplomatic resolution, but war risk premiums remained elevated for months after transit volumes normalised.
IMF projects global growth at 2.8% for 2026, down approximately 0.2 percentage points from pre-crisis baseline forecasts, attributed in part to oil supply disruption and elevated energy costs.
Inflation in oil-importing economies is estimated to be running approximately 1.5 percentage points above pre-crisis projections. Whirlpool CEO Marc Bitzer described US appliance market conditions as comparable to the 2008 global financial crisis, with consumer sentiment at approximately 50-year lows, illustrating how elevated energy costs are transmitting into downstream demand destruction.
The near-term risk premium, the portion of crude pricing driven by immediate blockade probability, will fade with a credible resolution. The structural supply chain changes will not. Energy diversification away from Gulf dependence, elevated freight market pricing, and accelerated investment in Canadian and West African production are multi-year themes that have already attracted committed capital.
For portfolios positioned around energy markets, commodity-linked equities, and inflation-sensitive assets, the distinction matters. The Hormuz crisis is not a binary trade on a single diplomatic headline. It is a repricing of how the world sources, ships, and insures its oil, and that repricing will outlast the conflict that triggered it.
For investors wanting to calibrate their portfolio positioning against historical precedent rather than current analyst forecasts alone, our full explainer on how oil shocks have historically affected equity returns examines S&P 500 performance in the 12 months following the 2008, 2011, and 2022 oil price spikes, and includes institutional guidance from Morgan Stanley and JPMorgan on whether reactive positioning has typically helped or hurt retail investors.
This article is for informational purposes only and should not be considered financial advice. Investors should conduct their own research and consult with financial professionals before making investment decisions. Past performance does not guarantee future results. Financial projections referenced are subject to market conditions and various risk factors.
Geopolitical oil risk refers to the portion of crude oil pricing driven by political conflict or military activity rather than supply and demand fundamentals. When military exchanges threaten a chokepoint like the Strait of Hormuz, markets add a risk premium to oil prices that can persist for months even if physical supply is not immediately disrupted.
The Strait of Hormuz carries approximately 20% of the world's traded oil, and there is no near-equivalent alternative route capable of handling that volume at scale. Any military activity that threatens passage forces tankers to reroute via the Cape of Good Hope, adding 20-30 days to delivery timelines and raising freight and spot market premiums.
All four nations are absorbing 10-20% higher import costs and executing emergency responses including strategic reserve releases, rerouting shipments via the Cape of Good Hope, and securing alternative crude supplies from US, Russian, West African, and Australian sources. Japan released approximately 36 million barrels from strategic reserves, while India declined the IEA-coordinated response and sourced alternative cargoes independently.
Key signals include whether the April 8 ceasefire holds through the 30-day negotiation window, whether Lloyd's and peer insurance syndicates re-rate war-risk premiums on Hormuz-transiting vessels, and whether OPEC+ follows its symbolic June quota increase with further supply-supportive decisions. Tanker insurance re-rating and Iranian diplomatic tone are considered the most real-time indicators.
The IEA has framed a potential two-year supply chain recovery timeline even in a best-case resolution scenario, because full normalisation requires unwinding tanker contract disruptions, insurance re-rating, and infrastructure repair. Structural changes including importer diversification away from Gulf suppliers and accelerated investment in Canadian and West African production are expected to persist well beyond any diplomatic agreement.