Why Australia’s Rising Index Is Hiding a Market Under Stress
16 mins ago

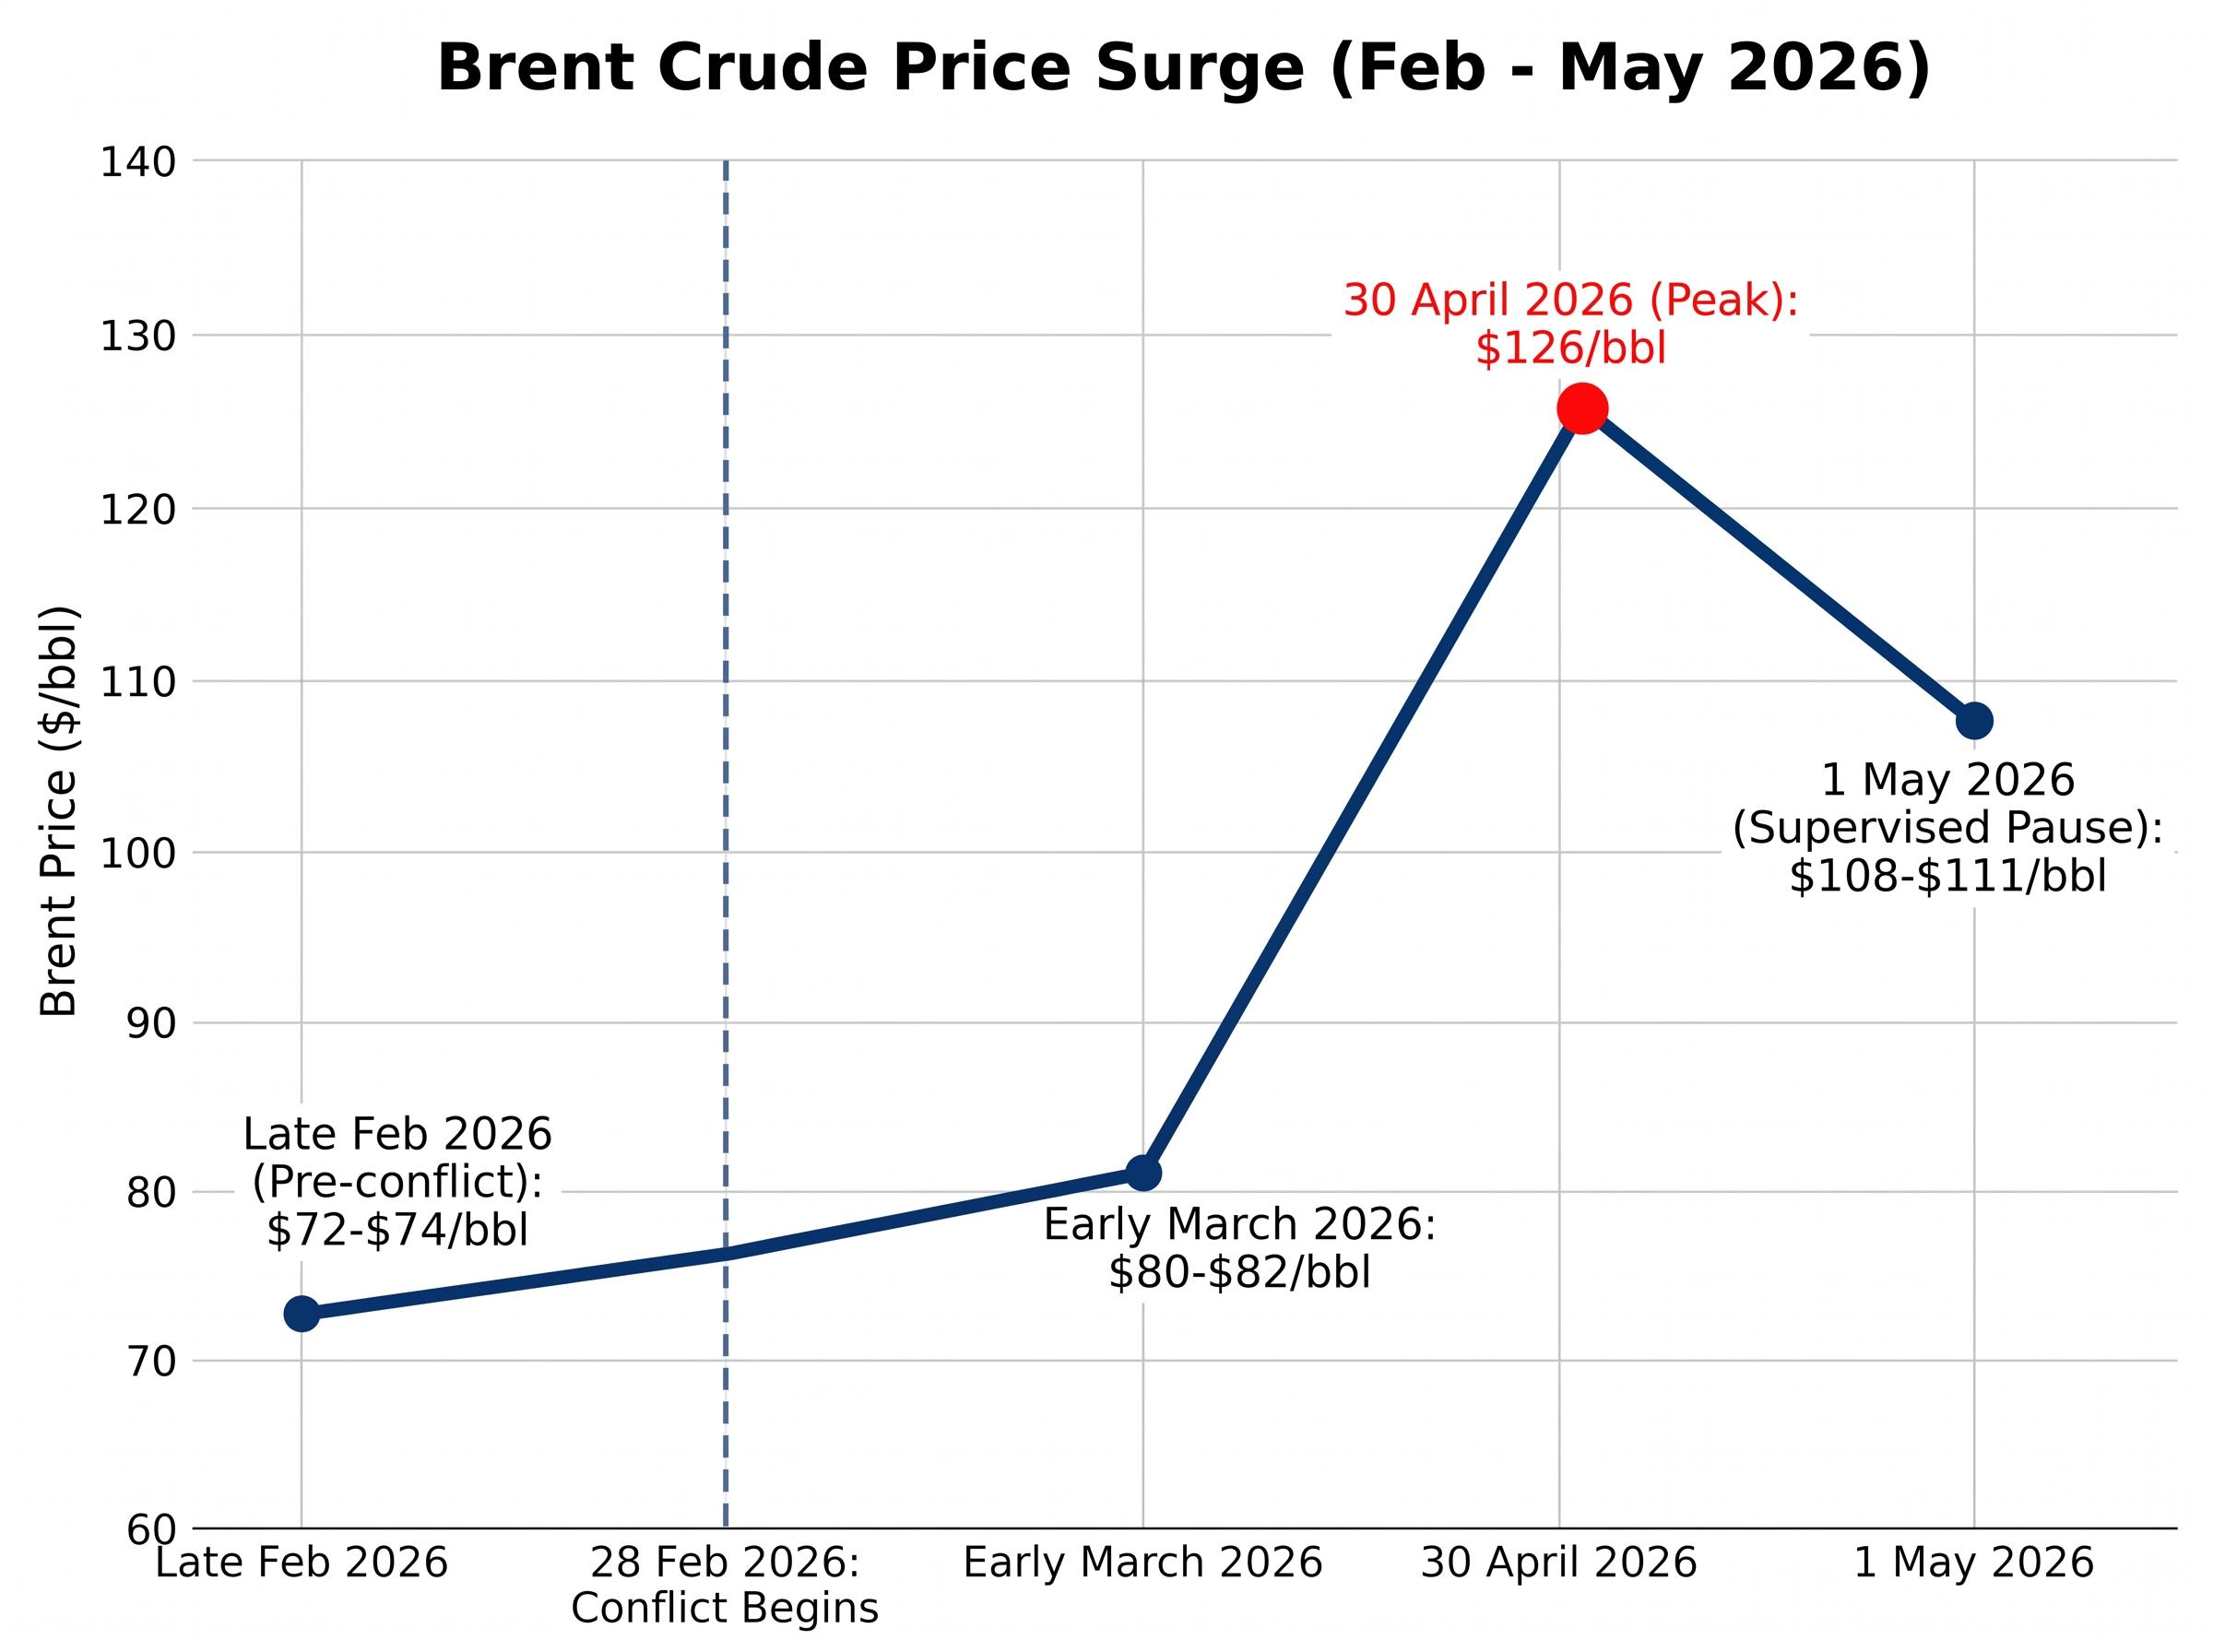
From a pre-conflict baseline of roughly $72-$74 per barrel to a late-April peak of $126, Brent crude has traced one of the most dramatic price arcs in recent memory. The catalyst is a single chokepoint: the Strait of Hormuz, which carries 20% of the world’s oil and gas supply.
The U.S.-Israel military campaign against Iran began on 28 February 2026, and the Strait’s closure immediately transformed a regional conflict into a global energy market event. As of 3 May, prices have pulled back from their peak but remain approximately 46-50% above pre-conflict levels. The Federal Reserve is frozen between competing mandates. Bond markets are flashing inflation warnings. Treasury Secretary Scott Bessent is projecting sharp declines once fighting stops, while Barclays analysts warn that inventories could reach critically depleted levels. The signals are pointing in multiple directions at once.
This analysis cuts through the conflicting signals to explain the market mechanics behind the price spike, what the data says about near-term versus medium-term scenarios, and where the actionable investment implications sit for U.S. investors tracking oil, energy equities, and inflation-sensitive assets.
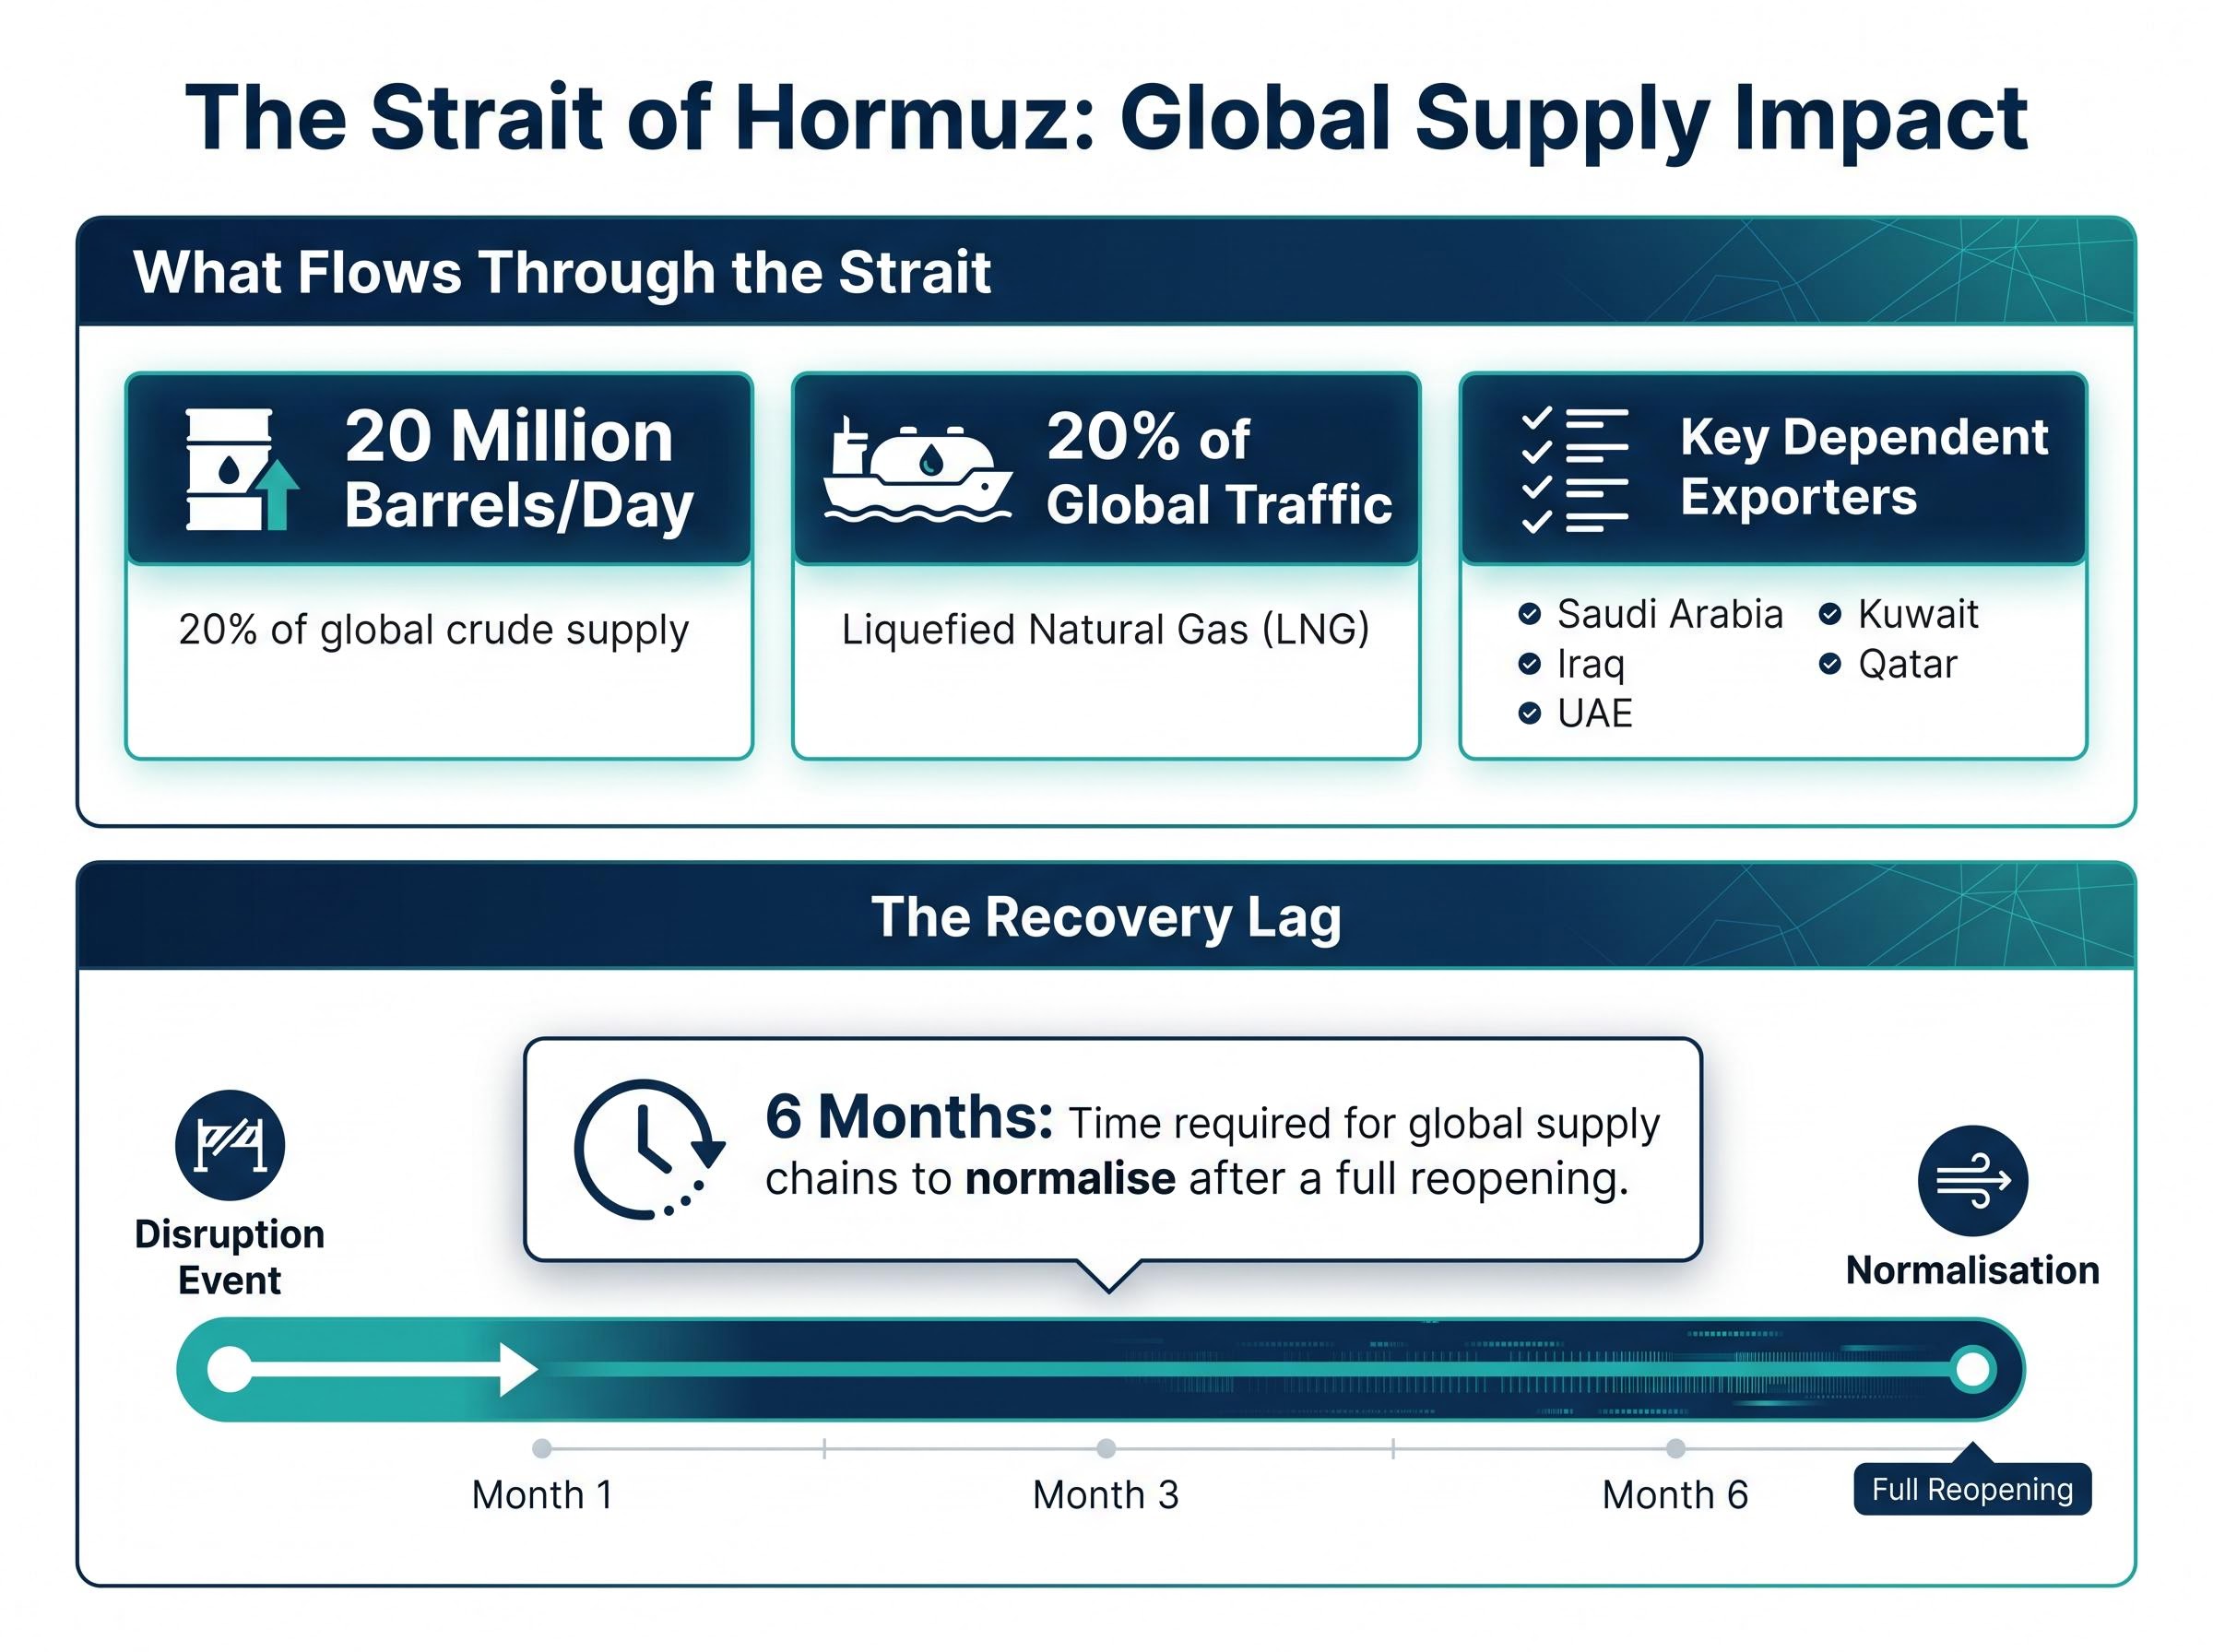
The Strait of Hormuz is narrow, shallow, and irreplaceable. Approximately 20 million barrels per day of seaborne crude oil passes through it, and no alternative route can absorb that volume in the near term.
The EIA Strait of Hormuz transit data puts the throughput figure at approximately 20.9 million barrels per day in the first half of 2025, equivalent to roughly 20% of global petroleum liquids consumption, establishing the chokepoint’s irreplaceable role in pre-conflict supply architecture.
What flows through the Strait:
As of early May 2026, no major alternative rerouting has been operationalised. The current arrangement is a “supervised pause” requiring Iranian coordination, not a genuine reopening. Bombing operations were suspended roughly four weeks before 3 May, but no conflict resolution agreement is imminent, and tanker operators are treating the pause as provisional rather than permanent.
Even if the Strait reopened tomorrow, the disruption would not end for months. Tankers need to be repositioned. Insurance contracts need to be reinstated. Refinery feedstock inventories across Asia and Europe need to be restocked from depleted levels.
Minneapolis Fed President Neel Kashkari cited a corporate executive who estimated that a full reopening would require approximately six months for global supply chains to normalise. That figure is not a political prediction; it is a logistics reality driven by the physical infrastructure of global oil distribution. For investors pricing the duration of this energy shock, six months is the number that matters most.
The price arc from late February to early May is best understood as four distinct phases, each representing a different market reaction to the conflict’s escalation and the supply response that followed.
Brent crude reached approximately $126 per barrel on 30 April 2026, its highest level since the conflict began and one of the sharpest supply-driven spikes in recent oil market history.
The Brent crude price spike above $125 on 30 April closed at $111.88 as traders simultaneously priced diplomatic breakthrough scenarios and a supply disruption the IEA described as having no modern parallel in scale or duration, producing one of the most volatile single-session swings in recent oil market history.
| Date/Period | Brent Price | WTI Price | Key Event |
|---|---|---|---|
| Late February 2026 (pre-conflict) | ~$72-$74/bbl | N/A | Pre-conflict baseline |
| Early March 2026 | $80-$82/bbl | N/A | Initial 10-13% post-conflict surge |
| Late April peak | ~$126/bbl (30 April) | ~$113/bbl (29 April) | Renewed closure announcements |
| 1 May 2026 | ~$108-$111/bbl | ~$102/bbl | Partial pullback; supervised pause in effect |
The supply-side response has been significant but insufficient to contain the shock. The U.S. released 172 million barrels from the Strategic Petroleum Reserve (SPR) in March 2026, followed by loan exchanges of up to 92.5 million barrels in April and May. OPEC+ agreed to boost output by 206,000 barrels per day for May, its third quota increase since the closure began.
The UAE’s exit from OPEC, effective 1 May 2026, adds approximately 1 million barrels per day of long-term production flexibility but provides no short-term relief. According to JPMorgan analysis, the exit also erodes OPEC+ discipline, complicating the cartel’s ability to coordinate supply responses going forward.
The gap between the late-April peak and the 1 May close tells investors something important: the market has already partially priced in a resolution scenario. The remaining 46-50% premium above pre-conflict levels represents the market’s current estimate of ongoing supply risk.
The price movements traced above did not happen in a vacuum. They followed a specific physical sequence that determines where prices go next.
The supply shock operates through a three-stage inventory depletion dynamic:
The global supply deficit mechanics driving the current shock are more severe than the headline price number implies: Goldman Sachs projected a 9.6 million barrels per day deficit as of late April, Iran faces a 12-22 day storage capacity limit that could cause irreversible well damage if shut-ins are forced, and the UAE’s OPEC exit permanently restructures cartel coordination rather than simply releasing spare capacity.
According to Barclays (1 May 2026), further disruptions could push fuel inventories to critically depleted levels, a threshold that would likely trigger a sharp secondary price spike above the late-April highs.
U.S. crude exports reached 6.44 million barrels per day in late April 2026, with record stock draws reported in the last week of the month. This confirms that domestic production is partially offsetting the global shortfall, but it does not resolve the gap left by 20 million barrels per day of disrupted Hormuz flows. The exports are a pressure release valve, not a replacement.
The Barclays inventory warning is the near-term risk signal investors should watch most closely. If inventories reach the threshold the bank identifies, the current pullback from $126 reverses, and prices move back toward or beyond the April peaks.
Two authoritative but contradictory views now define the range of outcomes for energy investors. Understanding the conditions that would validate each one is more useful than picking a side.
| Scenario | Brent Price Target | Key Assumption | Key Risk |
|---|---|---|---|
| Goldman Sachs / consensus resolution | $90/bbl (Q4 2026) | Strait reopens; supply chains begin normalising | Reopening delayed; inventory depletion accelerates |
| Bessent post-conflict | Below $72 (pre-conflict) over time | Rapid resolution; UAE capacity fills gap; U.S. net beneficiary | Six-month normalisation lag; inflation already embedded |
Goldman Sachs raised its Q4 2026 Brent forecast to $90 per barrel (WTI $83) on 26 April 2026, citing Middle East output losses and expected inventory deficits. A separate note lowered Q2 2026 Brent to $90 and WTI to $87. This is the moderate-resolution scenario, not a return to panic-peak pricing.
Treasury Secretary Bessent, speaking on Fox News on 3-4 May 2026, offered a far more bullish post-conflict view: futures markets are already anticipating lower energy costs later in the year, the U.S. naval blockade limits Iran’s ability to extract tolls, and the U.S. is a net beneficiary given its export capacity. The $160 WTI outlier scenario that circulated in April did not materialise.
Three conditions will determine which scenario unfolds:
The energy shock is not just a commodity story. It is a monetary policy constraint problem, and for U.S. investors, the Fed’s paralysis is itself an investable condition.
Bond markets are already pricing the inflation pass-through. The 5-year TIPS breakeven stood at 2.67% on 1 May 2026, above the 10-year TIPS breakeven of 2.48%. That inverted short-term/long-term spread signals that bond markets expect near-term inflation to exceed longer-run averages, consistent with an energy-driven price shock working its way through three transmission channels:
Chicago Fed President Austan Goolsbee reported headline PCE inflation at 3.5% year-over-year as of March 2026, already well above the Fed’s 2% target before the full energy shock has passed through. Analysts project U.S. inflation could exceed 4% by end-2026 if energy prices remain at current levels.
Not all the macro signals point in the same direction: disinflationary counter-forces including Chinese manufacturing export capacity and potential AI-driven productivity gains are operating beneath the headline CPI and PCE numbers, complicating any straightforward projection from current energy prices to end-2026 inflation outcomes.
The Federal Open Market Committee (FOMC) held the benchmark rate at 3.5%-3.75% at its most recent meeting, but the internal fractures are visible. Kashkari, along with the Cleveland Fed and Dallas Fed presidents, opposed the statement language, while Governor Miran dissented in favour of a rate cut.
Minneapolis Fed President Neel Kashkari stated on 3 May 2026 that he could not confirm a rate cut is coming and that rates may need to move higher, underscoring the Fed’s inability to provide clear forward guidance under current conditions.
Jerome Powell’s term as Fed Chair ends in late May 2026. Kevin Warsh, expected to assume the chairmanship, indicated a preference for a more accommodative posture during his confirmation process. However, that preference may be immediately constrained by the current inflation environment and the existing FOMC composition that has already demonstrated hawkish dissent.
For investors positioning in rate-sensitive assets, the leadership transition adds an additional uncertainty variable to an already paralysed institution.
The supply shock has created a specific set of investment opportunities, but each carries an asymmetric resolution risk that needs to be sized into positioning.
| Name/Ticker | Type | Primary Exposure | Resolution Risk |
|---|---|---|---|
| Cheniere Energy (LNG) | Individual stock | LNG exports; direct beneficiary of redirected global LNG demand | High: sharp reversal if Hormuz LNG flows resume |
| EQT Corp (EQT) | Individual stock | Leading U.S. natural gas producer | High: natural gas premium narrows on resolution |
| Kinder Morgan (KMI) | Individual stock | Pipeline and midstream infrastructure | Moderate: infrastructure demand persists post-resolution |
| Vanguard Energy ETF (VDE) | Sector ETF | Broad U.S. energy sector | Lower: diversified exposure dampens single-name reversal |
| Energy Select Sector SPDR (XLE) | Sector ETF | Large-cap S&P 500 energy companies | Lower: diversified; large-cap resilience in drawdowns |
U.S. crude exports at 6.44 million barrels per day confirm that domestic producers are capturing redirected global demand, consistent with Bessent’s framing of the U.S. as a net beneficiary. The constraint on U.S. upside is not output capacity but shipping and loading infrastructure.
The distinction between single-name exposure and broad sector ETFs matters here. Individual producers like Cheniere and EQT offer higher upside during sustained disruption but carry sharper reversal risk if the Strait reopens faster than the Goldman consensus implies. ETFs like VDE and XLE offer diversified exposure with lower single-name drawdown risk.
The sector rotation within U.S. equities has been sharp and asymmetric: energy stocks surged 15-20% through April while consumer discretionary fell 5-10%, a bifurcation driven by oil-cost inflation squeezing household purchasing power even as upstream producers capture the price premium.
For inflation-hedging positioning, investors are working with a three-layer framework:
Brent at $108-$111 and WTI at approximately $102 represent a volatile middle ground, not a stable plateau. Prices remain 46-50% above the pre-conflict baseline despite pulling back from the April peak. The current level sits between two competing forces: the Barclays inventory depletion risk pointing up and the Goldman $90 resolution scenario pointing down.
Three signals will tell investors when the scenario has shifted:
A corporate executive cited by Fed President Kashkari estimated that even an immediate, full reopening of the Strait of Hormuz would require approximately six months for global supply chains to normalise, a timeline that anchors the medium-term outlook regardless of near-term diplomatic developments.
Investors who treat the current price pullback as a resolved story risk being caught by either a secondary spike (if inventory depletion crosses the Barclays threshold) or a sharp reversal (if rapid diplomatic resolution compresses the Goldman timeline). Monitoring the right signals is how to stay positioned correctly through either outcome.
This article is for informational purposes only and should not be considered financial advice. Investors should conduct their own research and consult with financial professionals before making investment decisions. Past performance does not guarantee future results. Financial projections cited in this analysis are subject to market conditions and various risk factors.
The Strait of Hormuz is a narrow waterway through which approximately 20 million barrels of crude oil per day pass, representing around 20% of global petroleum supply. Its closure due to the U.S.-Israel military campaign against Iran in 2026 triggered one of the sharpest oil price spikes in recent memory.
Brent crude surged from a pre-conflict baseline of roughly $72-$74 per barrel to a late-April 2026 peak of approximately $126 per barrel, a rise of around 70%, before pulling back to $108-$111 by early May, still 46-50% above pre-conflict levels.
Minneapolis Fed President Neel Kashkari cited a corporate executive who estimated approximately six months for global supply chains to fully normalise after a reopening, due to the time required to reposition tankers, reinstate insurance contracts, and restock refinery feedstock inventories.
Investors are positioning in individual names such as Cheniere Energy (LNG), EQT Corp (EQT), and Kinder Morgan (KMI), as well as diversified sector ETFs including the Vanguard Energy ETF (VDE) and Energy Select Sector SPDR (XLE), with ETFs offering lower single-name reversal risk.
Headline PCE inflation reached 3.5% year-over-year as of March 2026, well above the Fed's 2% target, with analysts projecting it could exceed 4% by end-2026 if energy prices remain elevated; the FOMC has held rates at 3.5%-3.75% but faces internal divisions, with some members signalling rates may need to move higher.