
How to Analyse Any Stock Using Tesla’s Bull and Bear Case
4 mins ago

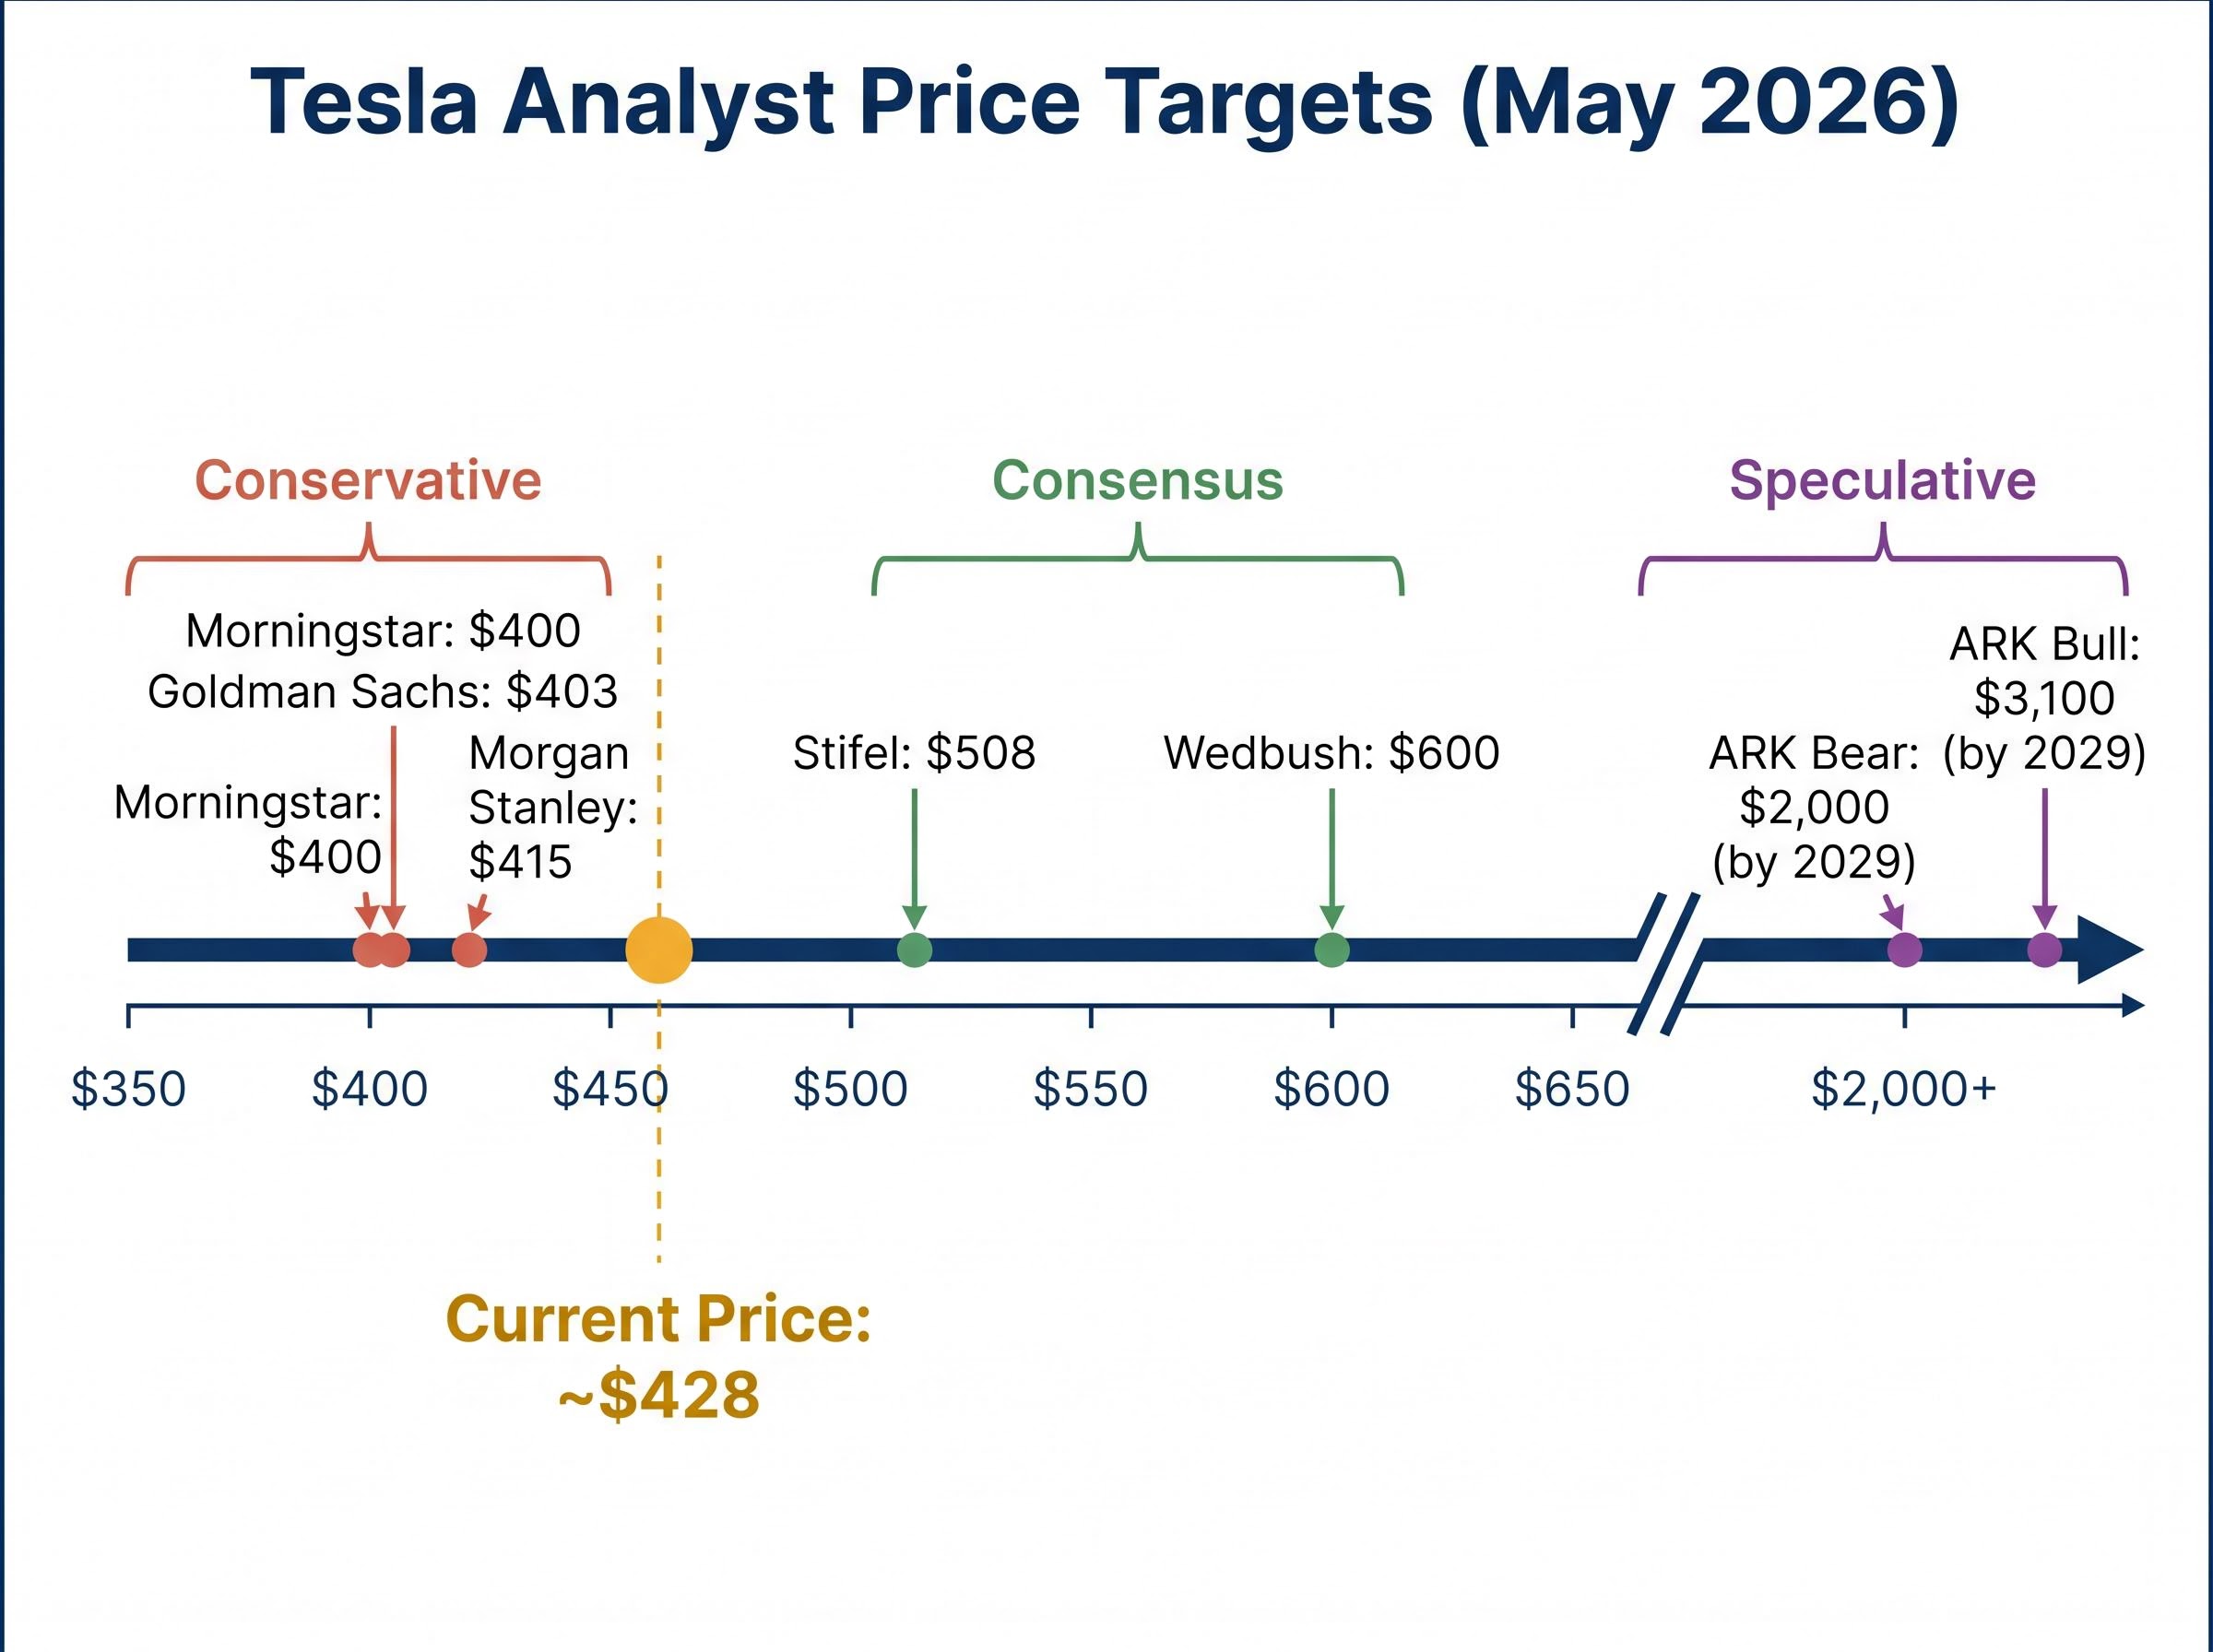
At roughly $428 per share in early May 2026, Tesla trades at a valuation that assumes a future most investors cannot agree on. The stock is not priced for what the company earns today. It is priced for what it might become.
Tesla’s Q1 2026 results beat expectations across the board: revenue of $22.4 billion, gross margin of 21.1%, and earnings per share of $0.40 against a $0.35 consensus. Yet Wall Street price targets for the same stock range from $403 to $600 among mainstream analysts, and into the thousands for the most optimistic outliers. That spread is not a disagreement about one quarter. It is a disagreement about whether Tesla becomes an AI and robotics platform or remains, fundamentally, a car company. This guide uses Tesla’s specific numbers to teach a broadly applicable stock valuation analysis framework: how to build bull and bear case scenarios for a company in transition, how to connect those scenarios to return outcomes, and why the price paid at entry determines which of those outcomes is survivable.
The frustration is familiar. One analyst sets a $403 price target. Another sets $600. A third publishes a speculative model pointing toward $3,100 by 2029. The instinct is to assume someone is wrong. The more useful instinct is to recognise that all three might be internally consistent, because they are valuing different versions of the same company.
Standard price-to-earnings or revenue-multiple valuation works cleanly when a company’s business model is stable. Apply a reasonable multiple to predictable earnings and the output falls within a narrow band. When the model itself is the variable, the output range explodes.
On the 22 April 2026 earnings call, Elon Musk explicitly repositioned Tesla as an AI and robotics enterprise. That framing is the source of the valuation spread, not analytical error.
Musk has described the Optimus humanoid robot as potentially “the largest product ever brought to market.”
Valuation at a transitional company is really a probability-weighted forecast about which version of the company will exist in 10 years. The analyst camps reflect this:
Investors who apply automotive-industry valuation frameworks to Tesla will consistently underprice the bull case and overprice the bear case. Understanding why the model matters before running the numbers is what separates disciplined scenario analysis from guesswork.
Three inputs drive almost all of the difference between a $400 outcome and a $600 outcome. Understanding what each one does is the foundation for any forward-looking valuation.
The first is the revenue growth rate, which determines how large the company becomes. The second is the net profit margin, which determines how much of that revenue converts to earnings. The third is the valuation multiple applied to those earnings, which reflects how much investors are willing to pay per dollar of profit.
These three inputs behave very differently depending on the type of company being valued.
| Input | Stable Company | Transitional Company | Why It Matters |
|---|---|---|---|
| Revenue growth rate | Predictable, narrow range (e.g., 3-8%) | Wide range depending on new business success (e.g., 6-35%) | Small changes compound dramatically over a 10-year horizon |
| Net profit margin | Stable, established by mature operations | Could expand sharply (software/AI monetisation) or compress (capex-heavy transition) | Determines whether revenue growth translates into earnings growth |
| Valuation multiple | Anchored to sector peers (e.g., 15-20x) | Depends entirely on which sector the company belongs to in future | A tech multiple versus an auto multiple can double or halve the implied share price |
The concept tying these inputs together is the discounted cash flow (DCF) model, which estimates a stock’s fair value by calculating the present value of its future earnings. In plain terms, the logic works in three steps:
A February 2026 DCF analysis from TiKR used explicit assumptions of 15.4% revenue growth and 13% operating margins by 2028 to generate its target. Tesla’s actual Q1 2026 gross margin came in at 21.1%, and the company’s chief financial officer confirmed 2026 capital expenditure is projected to exceed $25 billion, a figure that directly compresses free cash flow and affects DCF outputs. Forward analyst EPS estimates project more than 5x growth from current levels, but the assumptions underneath those projections vary enormously.
Most retail investors skip straight to price targets without examining the assumptions that produce them. The framework above provides the vocabulary to interrogate any analyst’s model.
The bull case is not vague optimism. It is a specific, testable set of bets. Under bullish assumptions, revenue grows at 20-35% annually, net margins expand to 20-30% (driven by software and autonomy monetisation), and the market assigns a valuation multiple of 25-35x earnings, reflecting a technology platform rather than an automaker.
| Assumption | Low End | High End | Midpoint |
|---|---|---|---|
| Revenue growth (annual) | 20% | 35% | ~27% |
| Net profit margin | 20% | 30% | ~25% |
| Valuation multiple (earnings) | 25x | 35x | ~30x |
| Projected annualised return (10-year) | ~11% | ~35% | ~20% |
Each assumption connects to a concrete operational catalyst. Autonomous vehicle miles driven nearly doubled year-over-year in Q1 2026. The robotaxi programme is operational in Austin, with Dallas and Houston added to the expansion map. Cybercab production is ramping. Optimus V3 has a production target of late July to early August 2025, with commercial third-party deployment projected for 2027. Tesla’s Fremont factory is being converted from Model S/X production to Optimus manufacturing, and the proprietary AI5 chip is in its final design phase.
Wedbush’s Dan Ives has projected a $2-3 trillion market capitalisation for Tesla in his 2026 bull case, supported by a $600 price target. This outcome is estimated at roughly 5-10% likelihood of full materialisation, making the return range meaningful but far from certain.
Investors who track whether these milestones are being hit or missed have a real-time feedback mechanism for updating their scenario weights.
Musk has a documented pattern of ambitious timelines that slip materially. In 2016, he claimed Tesla vehicles had the hardware necessary for full self-driving. In 2019, he projected one million robotaxis on the road. In 2021, he promised near-term Optimus deployment. Each timeline shifted significantly.
Tesla has not filed the required California DMV/CPUC permits for commercial autonomous vehicle operations, creating a gap between stated ambition and regulatory readiness.
Competitive pressure adds further uncertainty. Waymo has operated commercial driverless rides in multiple US cities for several years and holds a significant real-world data advantage. In humanoid robotics, Figure AI, Boston Dynamics, and well-capitalised firms including Microsoft, Google, and Amazon are active participants. The bull case requires Tesla to outpace all of them.
The bear case is not a pessimistic prediction. It is a diagnostic tool that exposes exactly how much of today’s $428 share price is autonomous-future premium.
Under bear case assumptions, Tesla grows revenue at 6-12% annually, maintains net margins of 8-14%, and trades at 18-22x earnings, reflecting a premium electric vehicle company without meaningful AI or robotics revenue.
| Variable | Bull Case | Bear Case |
|---|---|---|
| Revenue growth (annual) | 20-35% | 6-12% |
| Net profit margin | 20-30% | 8-14% |
| Valuation multiple | 25-35x | 18-22x |
| Projected return profile | 11-35% annualised | Negative at current price |
Under these assumptions, every projected return outcome at the current share price is negative. Bear case modelling pointed toward fair value in the $375-$380 range, already below the $428.35 May close. Morningstar assigns a $400 fair value with a 3-star (fairly valued) rating. Goldman Sachs holds at $403.
At $428 per share, the bear case generates negative returns. Investors at this price are already paying for a future that has not arrived.
The automotive-only baseline is reinforced by competitive and operational realities. BYD has surpassed Tesla in global EV volume. Margins have declined from peak levels as price wars persist. 2026 capital expenditure exceeding $25 billion generates substantial negative free cash flow, limiting the company’s near-term financial flexibility.
The bear case is the price of being wrong. Knowing exactly what is embedded in today’s share price tells investors whether they are being compensated for the risk they are accepting.
Scenario analysis is only half the work. The price paid transforms a sound analytical framework into either a good investment or a regrettable one.
Consider Tesla’s own price history. Investors who bought near $100 per share a few years before this analysis are looking at a fundamentally different return profile than those who entered near $450, even with identical forward assumptions. The late 2025 highs reached the $450-$480 range. The stock has since consolidated to $428.35. Forward analyst EPS estimates project more than 5x growth from current levels, but a significant portion of that expectation is already reflected in today’s price.
A bearish “death cross” technical pattern (50-day moving average at approximately $376.5, below the 200-day moving average at approximately $420.1) reinforces that the market is uncertain, not confirmed bullish.
The concept that matters here is “margin of safety”: buying below an estimated fair value to provide a buffer against being wrong about the scenario. A technically correct bull case analysis can still produce a poor investment outcome if the entry price already prices in most of the upside.
The price paid at entry is one of the most consequential variables in any investment, independent of whether the investment thesis proves correct.
Three steps can impose discipline on the entry decision:
The methodology built through Tesla’s numbers is transferable. Any company undergoing a business model transformation, whether an EV company pivoting to energy, a software company expanding into hardware, or an industrial firm moving toward automation, presents the same analytical challenge: the future identity of the company is the variable.
ARK Investment Management’s Monte Carlo simulation approach (bear $2,000, bull $3,100 for Tesla by 2029) illustrates formalised multi-scenario probability weighting. Analyst EPS estimates for Tesla declined more than 90% from peak before forward recovery projections began, demonstrating how earnings-based multiples can mislead during transition periods. Q1 2026 was a genuine beat ($22.4 billion revenue, 16% year-over-year growth), yet it did not resolve the long-term scenario uncertainty.
The skills built in this guide, scenario construction, assumption testing, and entry price discipline, are directly transferable. Tesla is the illustration; the methodology is the asset.
A five-step reusable framework captures the process:
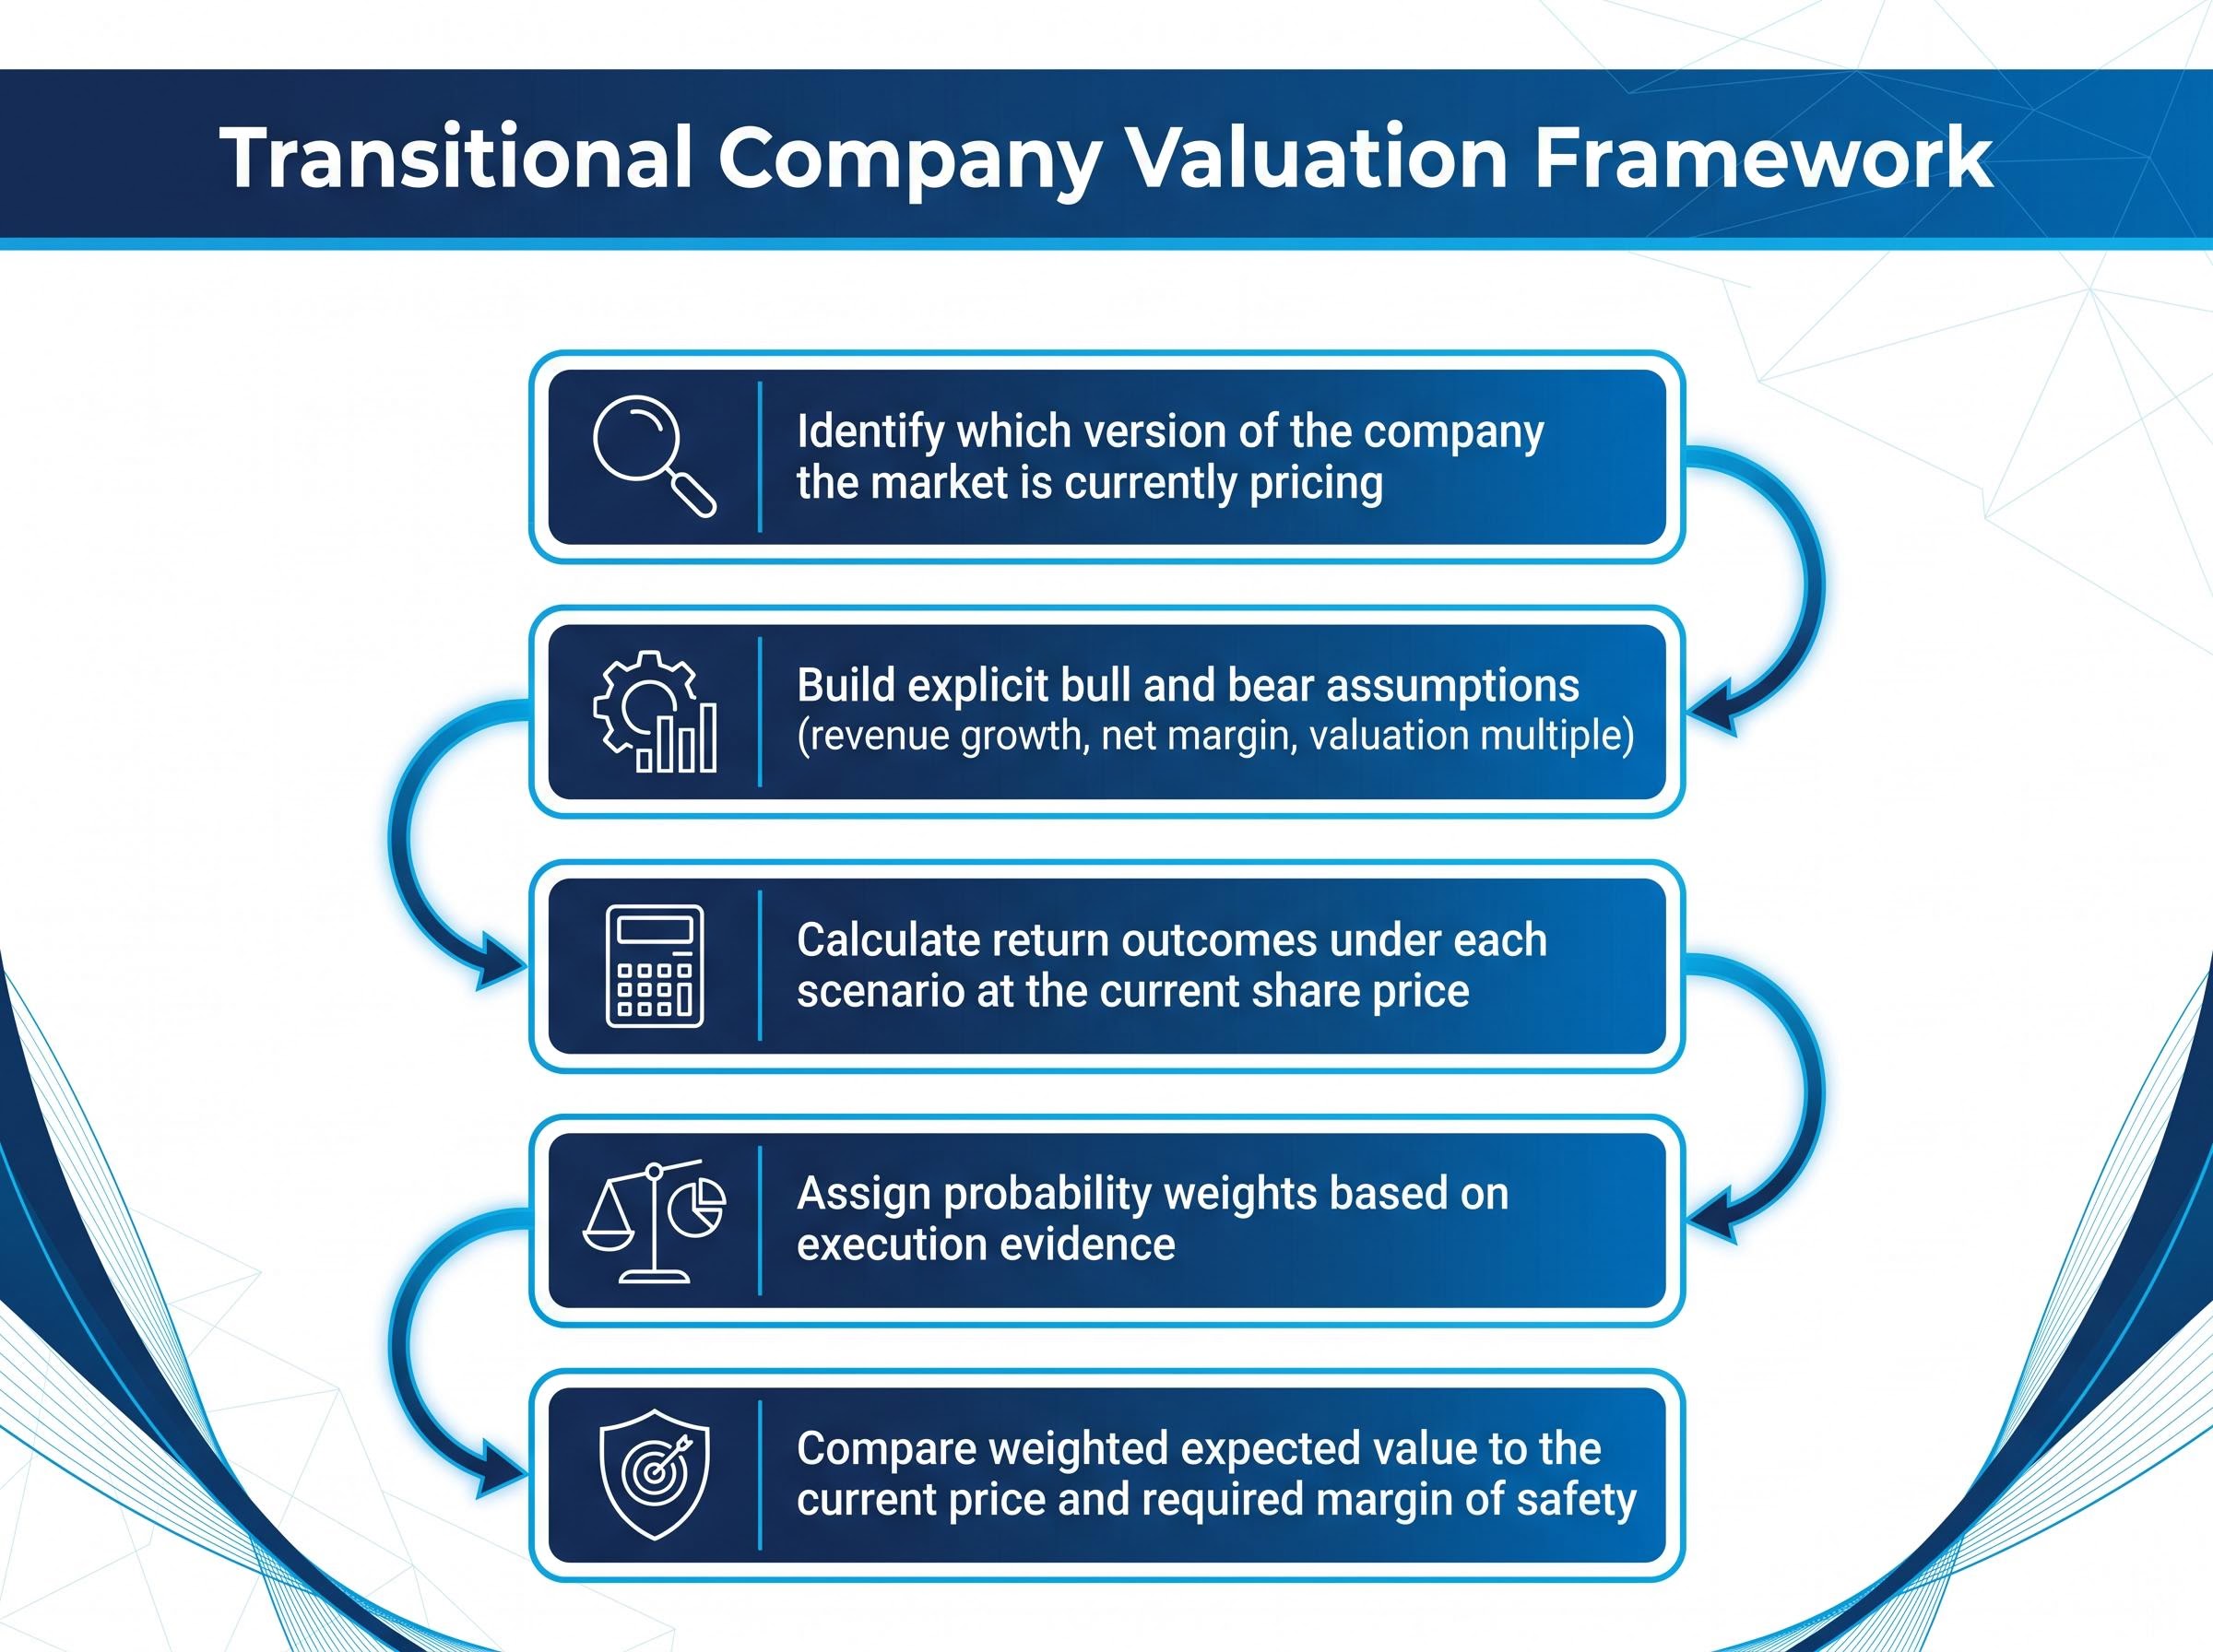
Every transition-company analysis ultimately reduces to a single question: what does this company need to become, and am I being paid enough to bet on that transformation at today’s price?
For Tesla, the gap between the $403 bear-case consensus and the $600 bull-case target reflects a market that has already paid for partial transformation. The answer to that question depends not on which analyst is right, but on whether the entry price provides enough room for the investor to survive being wrong.
When a company is in transition, the most important analytical task is not predicting which scenario wins. It is understanding the price at which an investor is adequately compensated for being wrong.
Tesla’s Q1 2026 results were a genuine beat. Revenue grew 16% year-over-year. Margins held. EPS exceeded consensus. None of that resolved the fundamental valuation question, because near-term earnings cannot substitute for scenario-based thinking in transitional companies.
The indicators that should shift scenario probability weights over time are specific and trackable: robotaxi permit filings, Optimus unit production data, gross margin trajectory, and competitive responses from Waymo and humanoid robotics firms. These are the real-world updates that matter.
Investors who build their own bull and bear scenario tables for any high-conviction, high-uncertainty holding in their portfolio, using the three-input framework introduced here, will find themselves making decisions from a position of analytical clarity rather than reactive conviction.
This article is for informational purposes only and should not be considered financial advice. Investors should conduct their own research and consult with financial professionals before making investment decisions. Past performance does not guarantee future results. Financial projections are subject to market conditions and various risk factors.
—
Scenario-based stock valuation analysis is a method of estimating a company's fair value by building explicit bull and bear case assumptions across three core inputs: revenue growth rate, net profit margin, and valuation multiple, then calculating return outcomes under each scenario at the current share price.
You define specific assumptions for revenue growth, net profit margin, and valuation multiple under each scenario; for Tesla, the bull case assumes 20-35% annual revenue growth and 25-35x earnings multiples reflecting a tech platform, while the bear case assumes 6-12% growth and 18-22x multiples reflecting a premium automaker.
The wide range, from Goldman Sachs at $403 to Wedbush at $600 and ARK Investment Management projecting up to $3,100 by 2029, reflects fundamental disagreement about whether Tesla becomes an AI and robotics platform or remains primarily a car company, not differences in near-term earnings analysis.
A margin of safety means buying a stock below its estimated fair value to create a buffer against being wrong about the investment thesis; at Tesla's current price of around $428, the bear case fair value of $375-$380 suggests limited margin of safety for investors relying on automotive-only assumptions.
The three most important inputs are revenue growth rate, net profit margin, and valuation multiple; small changes in any one of these compound significantly over a 10-year forecast horizon, and the valuation multiple alone can double or halve an implied share price depending on whether the company is classified as a tech firm or an automaker.