
US publicly held debt crossed 100% of GDP at the end of March 2026, moving from 99.5% to 100.2% in six months. Headlines framed it as a crisis threshold not seen since 1946. The number dominated financial commentary for a week. But the ratio that sparked the alarm cannot, on its own, tell anyone whether the US government can pay its bills.
The 100% milestone is real. Gross federal debt, however, has been above 100% for years (approximately 120% in 2024). What changed is which line on which chart crossed which round number. For readers trying to separate signal from noise, the question is not whether the US debt to GDP ratio crossed a psychologically resonant threshold. The question is whether debt-to-GDP is even the right metric to watch.
This piece explains the conceptual flaw built into debt-to-GDP comparisons, introduces the more meaningful measure of interest payments as a share of tax revenue, and provides a clearer framework for assessing US fiscal health using data that reflects how governments actually pay their obligations.
The 100% milestone is real, but it is not what you think
The data is straightforward. Debt held by the public moved from 99.5% of GDP in September 2025 to 100.2% at the end of March 2026, per Office of Management and Budget (OMB) and Bureau of Economic Analysis (BEA) data via FRED. The last time this measure sustained above 100% was 1946, following the financing of the Second World War.
But the figure that crossed the threshold is not the only federal debt measure, and the distinction matters:
- Debt held by the public: Treasury securities owned by external investors, including individuals, institutions, foreign governments, and the Federal Reserve. This is the measure most economists prefer for sustainability analysis.
- Gross federal debt: Includes intragovernmental holdings such as the Social Security trust fund. This figure was already approximately 120% of GDP in 2024.
The ratio has hovered near 100% since 2020, when pandemic spending and the accompanying economic contraction pushed it above that level. The March 2026 reading represents an incremental notch, not a structural break.
Richard Rubin, writing in the Wall Street Journal on 30 April 2026, described the crossing as “a symbol of fiscal pressure facing the United States.” That framing captures the media narrative this article examines: symbolically resonant, analytically incomplete.
When big ASX news breaks, our subscribers know first
The conceptual flaw in using GDP as the denominator for debt
The ratio places a stock of accumulated obligations (debt) over an annual flow of economic activity (GDP). That comparison carries an intuitive appeal, but it contains a structural mismatch that weakens its analytical usefulness. The flaw becomes visible when the components are examined separately.
What GDP actually measures
GDP captures the total market value of goods and services produced in a year. Its four components are consumer spending, private investment, government outlays, and net exports. None of these represent money the government collects or commands for debt repayment. GDP measures the economy’s output, not the government’s income.
GDP release interpretation matters here because GDP is a lagging, heavily revised measure: US advance estimates carry average absolute revisions of approximately 0.6 percentage points, meaning the denominator in the debt-to-GDP ratio is itself a moving and imprecise figure that compounds the analytical limitations of the ratio.
What governments actually use to pay their obligations
Governments service debt from tax receipts and other government revenues. The mortgage analogy is instructive here: judging whether a household can afford its mortgage by comparing the loan balance to the total economic output of the neighbourhood tells you nothing about affordability. Comparing the loan balance to the household’s income does. Economists describe this mismatch between an accumulated stock (debt) and an annual flow (GDP) as a “stock-flow mismatch,” a term readers can use to locate the deeper academic literature on the subject.
The implication is direct. Tax revenue, not GDP, is the denominator that answers the question investors and policymakers actually care about: can the government meet its obligations from its income?
The metric that actually measures affordability
If debt-to-GDP is the wrong framing, the natural follow-up is: what is the right one? The measure gaining traction among fiscal analysts and institutions like the International Monetary Fund is simpler and more operationally relevant: interest payments as a share of tax revenue.
The logic is intuitive. This ratio shows how much of every dollar the government collects is already committed to servicing debt before any policy choice is made. It translates abstract debt levels into a concrete affordability question.
Federal interest payments represented approximately 18.5% of total US tax receipts in fiscal year 2025, per US Treasury data. Net interest expense reached approximately $623 billion year-to-date as of March 2026, representing roughly 17% of total federal spending. The 10-year Treasury yield stood at approximately 4.35% as of 5 May 2026, compared with a long-run average of 5.9% (from 31 December 1969 through 5 May 2026), according to FactSet.
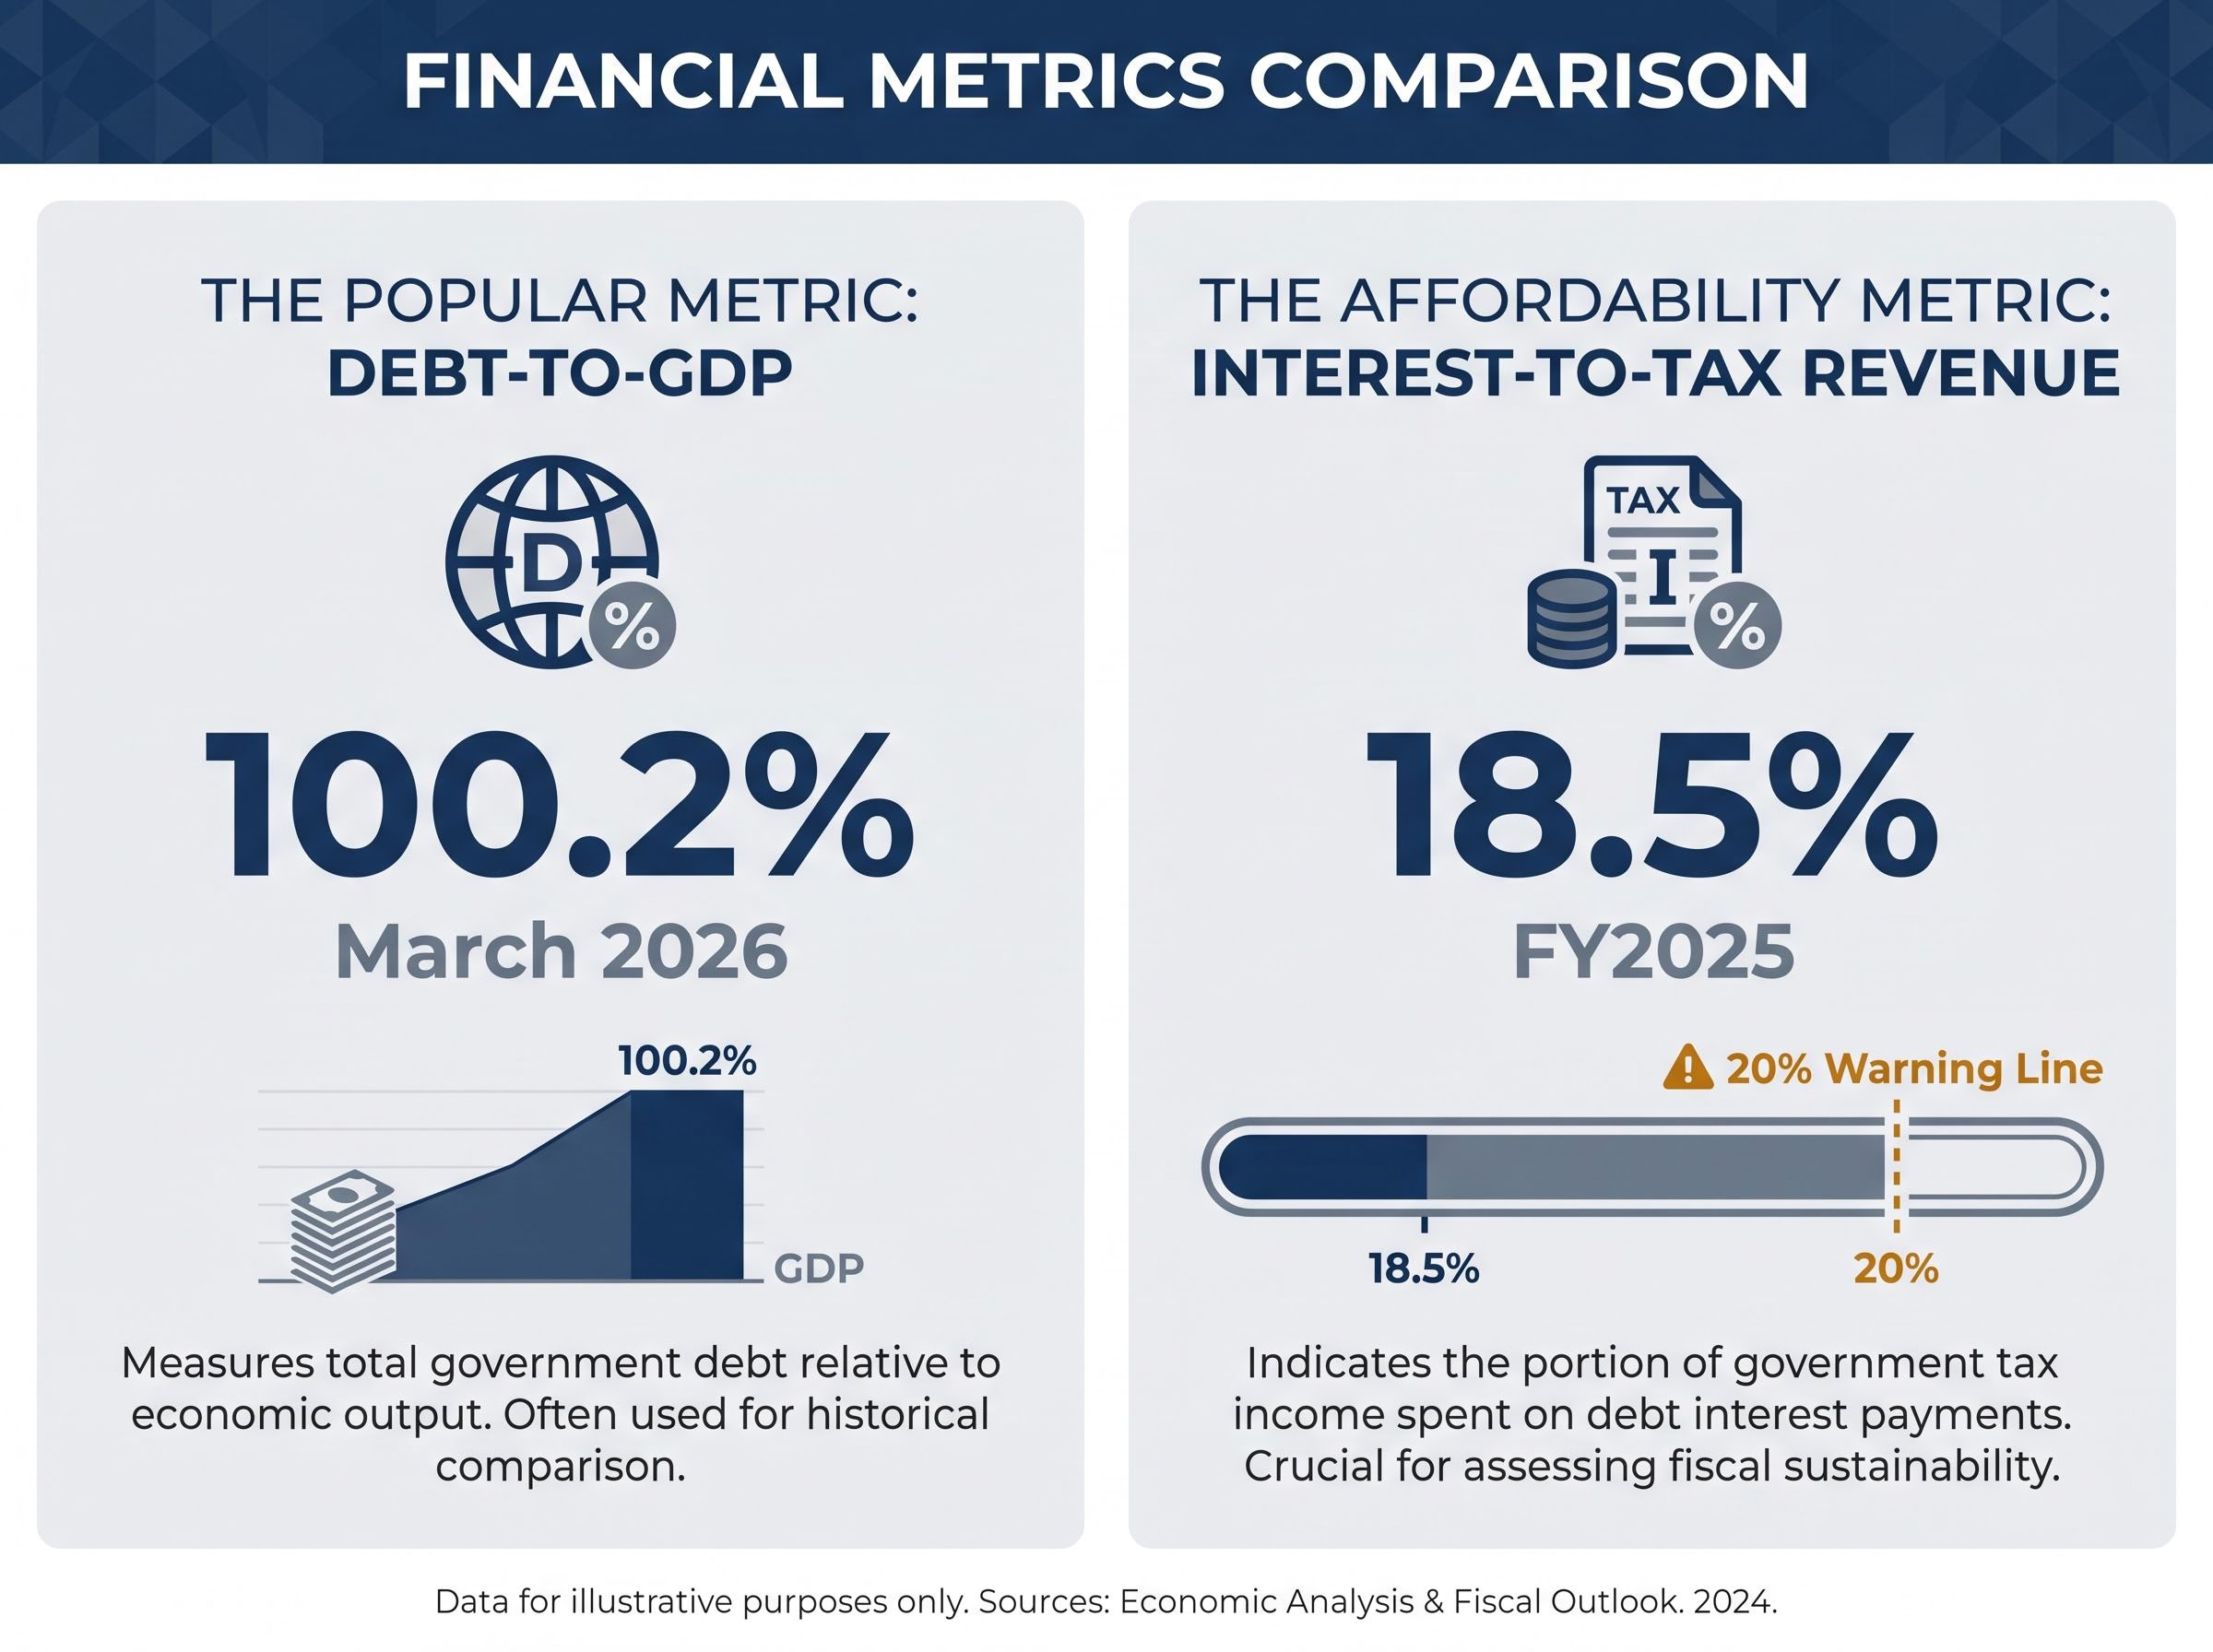
At 18.5% of revenue, the government retains more than five times the tax income needed to cover its interest obligations. The headroom is substantial, even if the trend line warrants attention.
Many analysts flag 20% of revenue as a warning-level threshold. The current reading sits below it, though the trajectory is upward as lower-rate pandemic-era debt matures and refinances at current yields.
| Metric | Current US Reading | What It Measures | Analytical Limitation |
|---|---|---|---|
| Debt-to-GDP | 100.2% (debt held by public) | Accumulated debt relative to annual economic output | GDP is not government revenue; stock-flow mismatch |
| Interest payments as share of tax revenue | ~18.5% (FY2025) | Share of government income consumed by debt service | Does not capture future rate or revenue changes |
What history and peer countries actually show
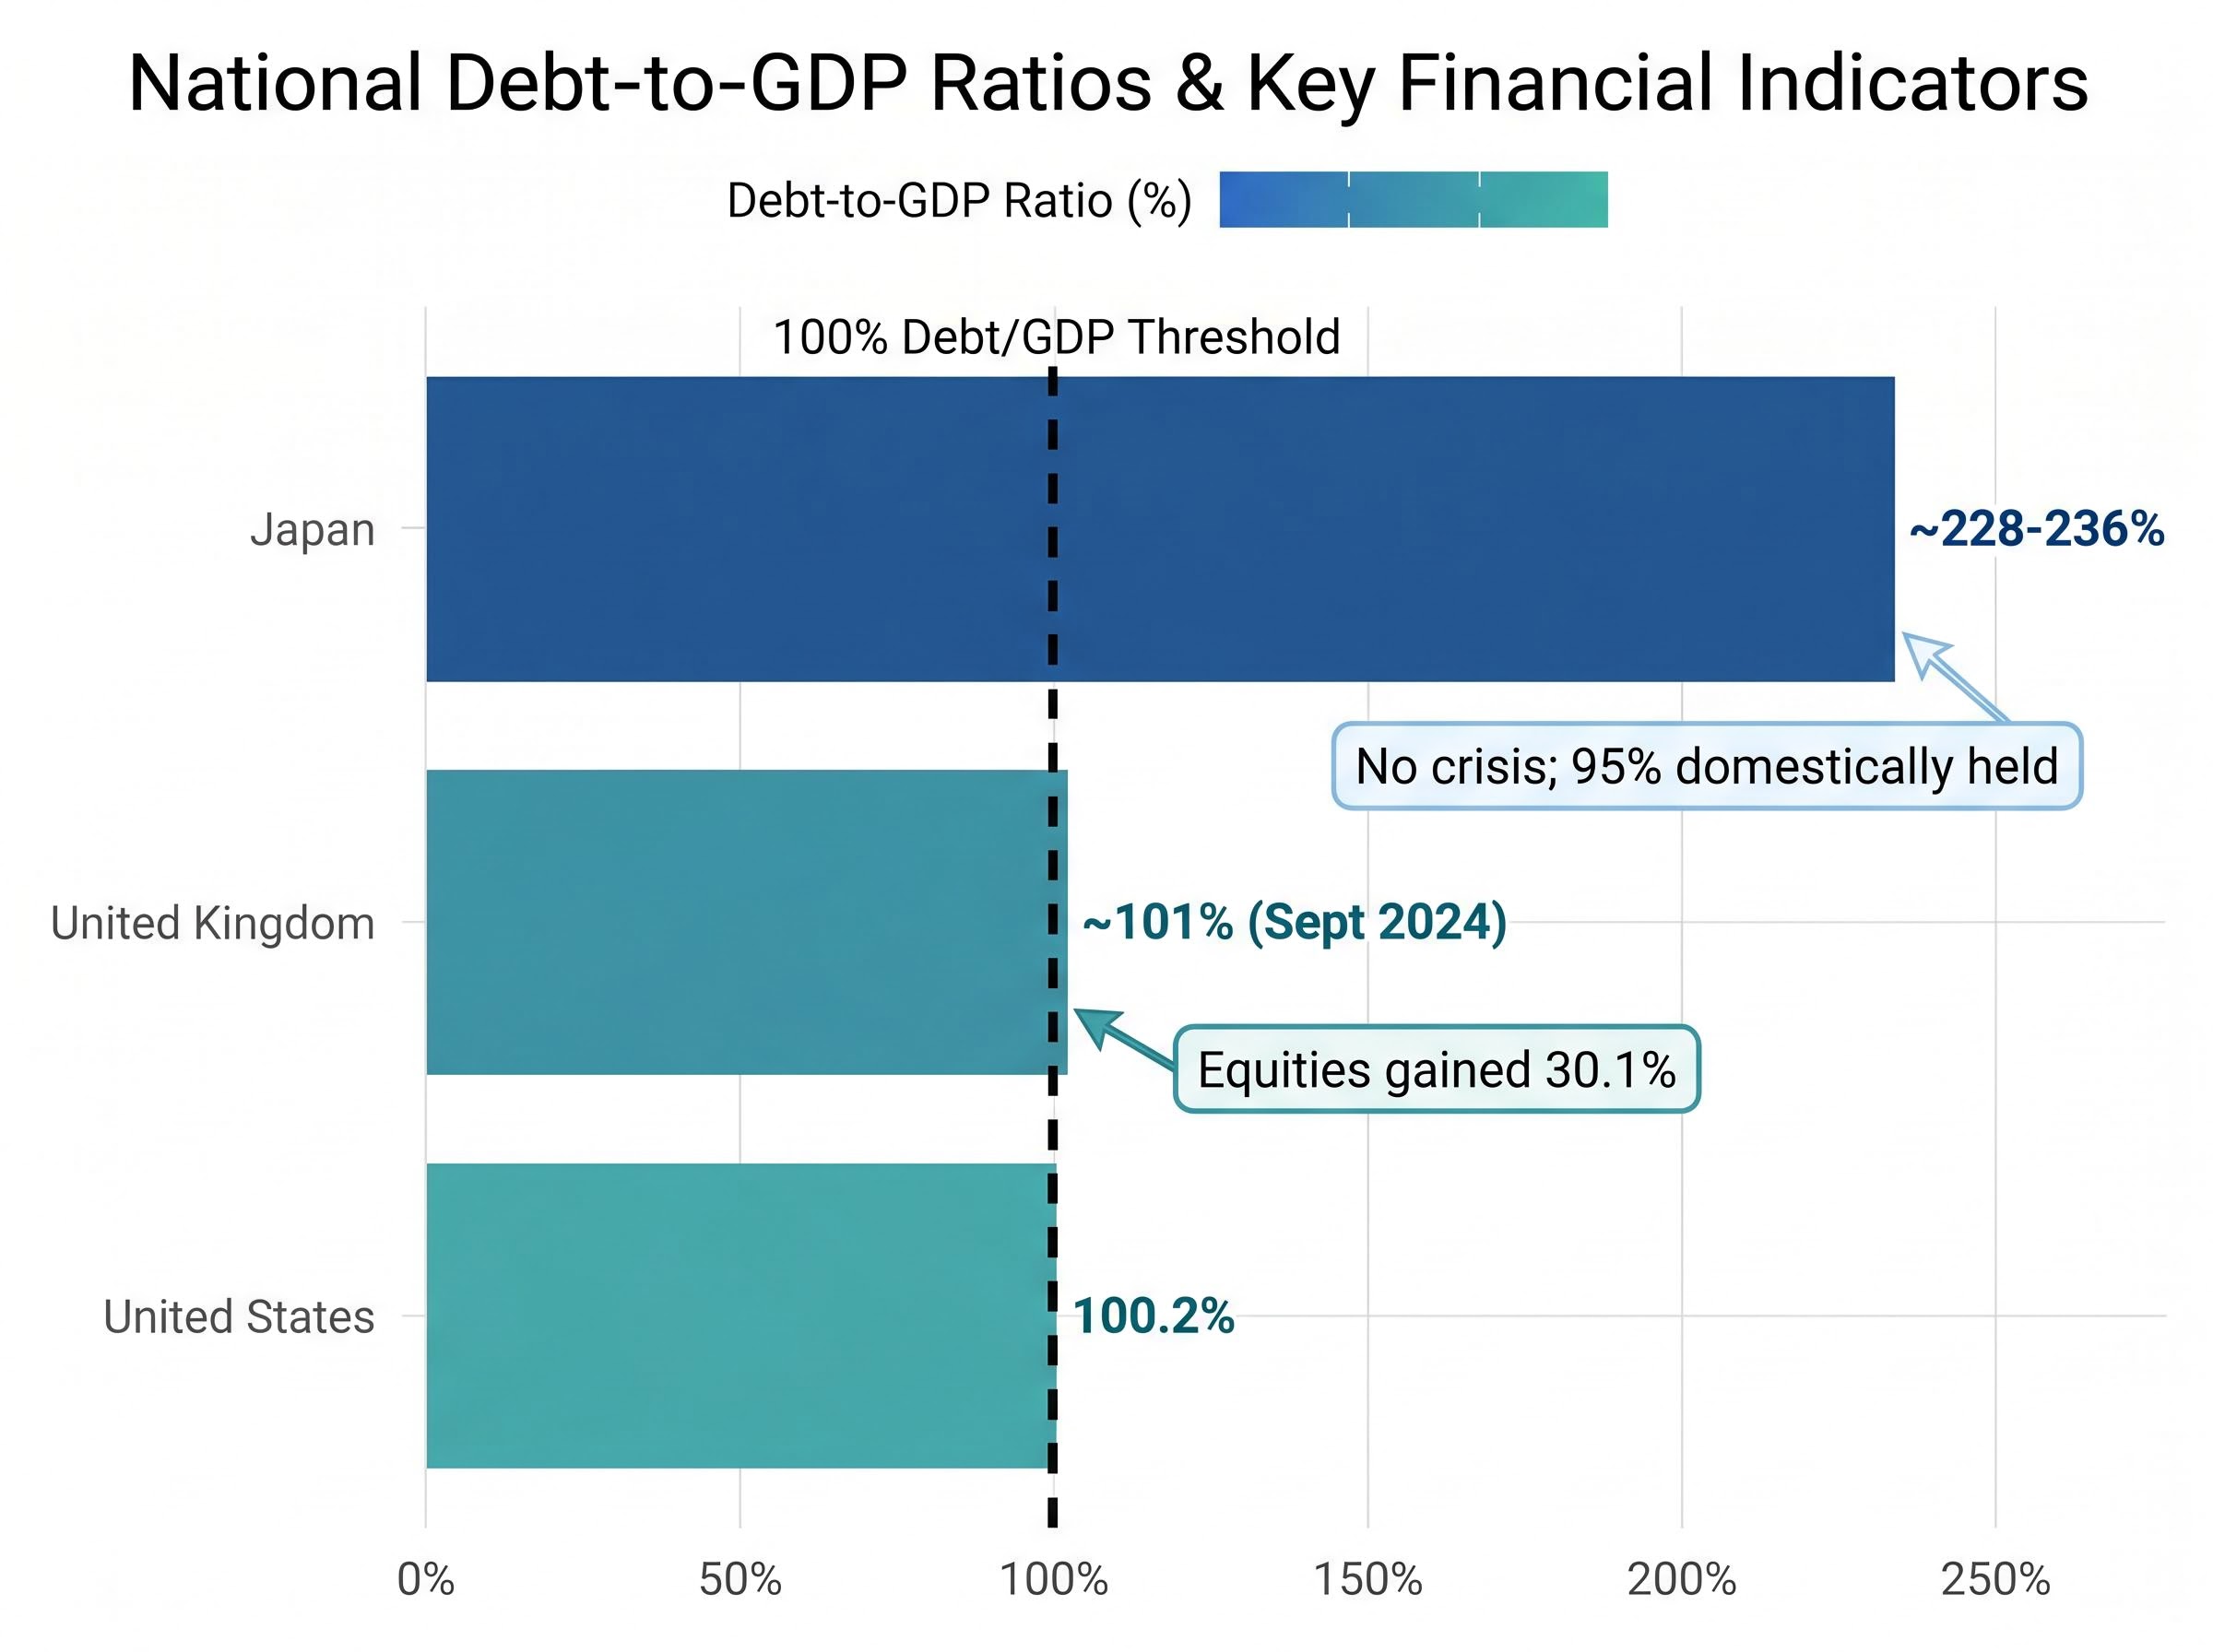
If 100% debt-to-GDP were a reliable crisis signal, the historical and international record would show consistent distress at or above that level. It does not.
The United Kingdom saw its debt-to-GDP ratio exceed 100% in September 2024. UK equities, measured by the MSCI UK IMI (net dividends), gained 30.1% from 30 September 2024 through 5 May 2026, according to FactSet, outpacing global stocks over the same period. UK GDP expanded in both 2024 and 2025.
Japan has maintained government debt above 100% of GDP since the mid-1990s and surpassed 200% from 2020 onward, per IMF data covering 1979-2024. No sovereign debt crisis has followed, a result driven by approximately 95% domestic ownership of government bonds and controlled interest rates maintained by the Bank of Japan.
Japan’s domestic bond ownership structure, with approximately 95% of government securities held domestically, is the core reason a debt ratio above 200% of GDP has not produced a sovereign funding crisis, but that same structure creates a different set of constraints: the Bank of Japan’s ability to control interest rates depends on continuing to absorb supply that foreign investors will not, a trade-off the Ministry of Finance’s 2026 intervention campaign has brought into sharper focus.
The United States itself provides a precedent. After the post-war peak of approximately 106% in 1946, the ratio fell not through aggressive debt repayment but through GDP growth outpacing debt accumulation. Economic expansion drove the denominator higher.
One further historical parallel deserves attention. Interest-to-revenue ratios comparable to today’s 18.5% were observed in 1991-1992. During that period, the S&P 500 returned 40.4% (from 31 December 1990 through 31 December 1992), while average annual US GDP growth was 1.7%.
These comparisons are not a claim that high debt carries no risk. They are evidence that the ratio itself does not mechanically produce crisis.
| Country | Debt-to-GDP (approx.) | Time above 100% | Observed Outcome |
|---|---|---|---|
| United States | 100.2% (public debt) | Since 2020 (near or above) | Continued economic expansion; no sovereign crisis |
| United Kingdom | ~101% (IMF estimate) | Since September 2024 | Equity gains of 30.1%; GDP growth in 2024 and 2025 |
| Japan | ~228-236% (IMF estimate) | Since mid-1990s | No sovereign debt crisis; 95% domestically held |
When does the debt trajectory actually become a problem?
The most theoretically grounded test for debt sustainability is the r-g framework: the real interest rate on government debt (r) minus the real GDP growth rate (g).
When the real interest rate exceeds the real growth rate, debt dynamics become self-reinforcing. Interest costs compound faster than the economy grows, requiring primary surpluses (budget surpluses excluding interest payments) to prevent the debt ratio from rising indefinitely. When growth exceeds rates, debt naturally stabilises even with modest primary deficits.
The US has operated with a near-zero or negative r-g differential for much of the post-2008 period, supporting the view that current debt levels remain manageable. The 10-year Treasury yield at approximately 4.35% sits well below the long-run average of 5.9%, keeping borrowing costs contained.
The legitimate concern is directional. The Congressional Budget Office (CBO) projects debt held by the public reaching approximately 120% of GDP by 2036 under current law, per its February 2026 Budget and Economic Outlook. CBO long-run scenarios assume the r-g differential turns positive over coming decades as interest rates normalise.
Treasury yield thresholds carry more immediate fiscal consequence than debt-to-GDP ratios precisely because they directly determine the interest costs the government faces when refinancing maturing debt, and BofA’s Michael Hartnett has identified 5% on the 30-year as the level at which those refinancing costs begin compounding across mortgages, corporate borrowing, and the federal deficit simultaneously.
The CBO projects debt held by the public at approximately 120% of GDP by 2036 under current law, with further increases if fiscal policy does not adjust.
Three conditions would indicate genuine fiscal stress:
- A positive r-g differential (real interest rate above real growth rate) sustained over multiple years, making debt dynamics self-reinforcing
- The interest-to-revenue ratio crossing and sustaining above 20% with no corrective policy action
- A loss of Treasury market demand reflected in anomalous yield increases disconnected from monetary policy expectations
It is worth noting that the Reinhart-Rogoff 90% threshold, once widely cited as a hard limit above which growth falls sharply, was subsequently found to rest on a spreadsheet error and has not held up in updated empirical datasets.
The distinction matters: the article’s argument is that the 100% threshold is not analytically meaningful, not that rising interest costs are costless. Fiscal crowding, where a rising share of revenue consumed by interest payments reduces discretionary spending capacity, is real. Reduced countercyclical capacity in future recessions is a genuine constraint. The timeline for these pressures is measured in decades, not quarters.
The next major ASX story will hit our subscribers first
The debt number to watch, and why markets are not alarmed yet
If financial markets genuinely priced in the fiscal distress that debt-to-GDP commentary implies, US Treasury yields would be materially higher and demand for government securities meaningfully weaker. Neither condition holds.
The 10-year Treasury yield at approximately 4.35% as of 5 May 2026 sits 1.55 percentage points below the long-run average of 5.9% (from 31 December 1969 through 5 May 2026), per FactSet. Investors are not pricing a fiscal crisis premium into US borrowing costs.
Current yield vs. long-run average: The 10-year Treasury at 4.35% compared with a long-run average of 5.9% suggests markets see no imminent fiscal stress in the world’s benchmark sovereign bond.
Treasury auction demand has remained robust through early 2026, with bid-to-cover ratios at or above historical averages. Foreign holdings of US Treasuries remain substantial at roughly one-quarter of publicly held debt, with no evidence of large-scale selling.
For readers seeking a practical monitoring framework, three data points carry the most signal:
- Track the interest-to-revenue ratio. Currently approximately 18.5%. If this crosses and sustains above 20%, the fiscal trajectory warrants reassessment.
- Watch Treasury yield spreads relative to historical averages. Sustained moves above the long-run average of 5.9%, disconnected from monetary policy shifts, would signal changing market perception of US credit risk.
- Monitor auction bid-to-cover ratios. Deteriorating demand at Treasury auctions would be an early signal of eroding confidence that precedes yield increases.
CBO long-run scenarios projecting 120% by 2036 and higher by mid-century without policy change represent genuine long-run pressures. The timeline, however, is decades, not quarters, and policy adjustment remains available across multiple levers.
What the debt milestone actually tells investors
The 100% debt-to-GDP milestone is a psychologically resonant number built on a conceptually limited comparison. It measures accumulated obligations against annual economic output, not against the revenue the government actually uses to service those obligations. On the metric that captures affordability, interest payments at approximately 18.5% of tax revenue, the government retains more than five times the income needed to cover its debt service costs.
That does not mean the trajectory is costless. As lower-rate pandemic-era debt matures and refinances at current yields, the interest-to-revenue ratio will continue rising. Fiscal crowding, where debt service consumes an expanding share of the budget, carries distributional consequences regardless of whether a formal crisis materialises. The CBO’s long-term projections make the directional pressure clear.
Readers who want to track these figures directly can find the most reliable forward-looking data at three primary sources:
- CBO Budget and Economic Outlook (February 2026): https://www.cbo.gov/publication/62105
- Treasury Fiscal Data: https://fiscaldata.treasury.gov/americas-finance-guide/national-debt
- FRED Debt-to-GDP series: https://fred.stlouisfed.org/series/GFDEGDQ188S
A reader who finishes this piece can evaluate the next fiscal headline with a more precise framework than the one most financial commentary applies. The ratio that crossed 100% is a symbol. The number that measures whether the government can pay its bills is 18.5%, and it has not crossed its warning threshold yet.
Investors exploring how GDP-denominated ratios are applied beyond fiscal analysis will find our full explainer on equity valuation metrics tied to GDP, which examines the Buffett Indicator at 223.6%, its historical relationship to subsequent market returns, and the convergence of three independent frameworks that are simultaneously signalling caution for US equities in 2026.
This article is for informational purposes only and should not be considered financial advice. Investors should conduct their own research and consult with financial professionals before making investment decisions. Past performance does not guarantee future results. Financial projections are subject to market conditions and various risk factors.