How to Analyse Any Stock Using Tesla’s Bull and Bear Case
2 mins ago

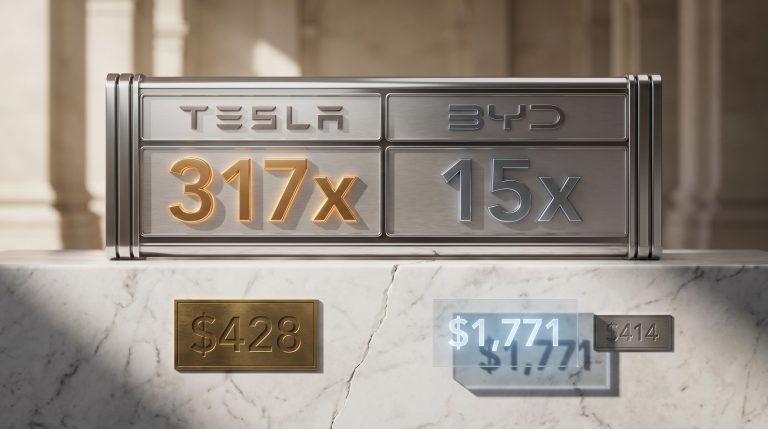
Tesla trades at 185 to 217 times forward earnings. The consensus 12-month analyst price target sits below the current share price. That contradiction is not a data error. It is a window into how stock valuation analysis actually works for companies whose future looks nothing like their present.
Tesla’s Q1 2026 earnings beat, with revenue of $22.4 billion and gross margin of 21.7% against a 17% consensus estimate, reignited debate about whether the company’s AI and robotics pivot is real or aspirational. The gap between what bulls and bears believe about Tesla’s future has never been wider or more measurable. GLJ Research prices the stock at $180. ARK Invest prices it at $2,600. That distance is not sentiment. It is competing valuation methodology built on competing assumptions about revenue growth, margin expansion, and exit multiples. What follows uses Tesla’s Q1 2026 data as a teaching case for how professional investors construct bull and bear scenarios, why the price paid at entry is one of the most consequential variables in any investment, and how to apply this framework to any company undergoing a major strategic transition.
Start with the obvious question: how should an investor value a company that is simultaneously a car manufacturer, an autonomous driving platform, and a humanoid robotics venture? The standard toolkit was not built for this.
Grasping how stock prices form through the continuous interaction of competing bids and offers is the foundation for understanding why a company can trade at 185 times forward earnings while analysts simultaneously publish price targets below the current level: the price reflects the marginal buyer’s probability-weighted view of the future, not any consensus estimate of present value.
Ford and GM trade at 6 to 10 times EV/EBITDA. Applying that range to Tesla would imply the market is wildly irrational. But the market is not valuing Tesla as a car company. At a consensus EPS estimate of approximately $2.56 for 2026, most of Tesla’s market capitalisation represents option value on future business lines rather than current earnings power.
The three most common valuation methods each break down in a specific way for transitional companies:
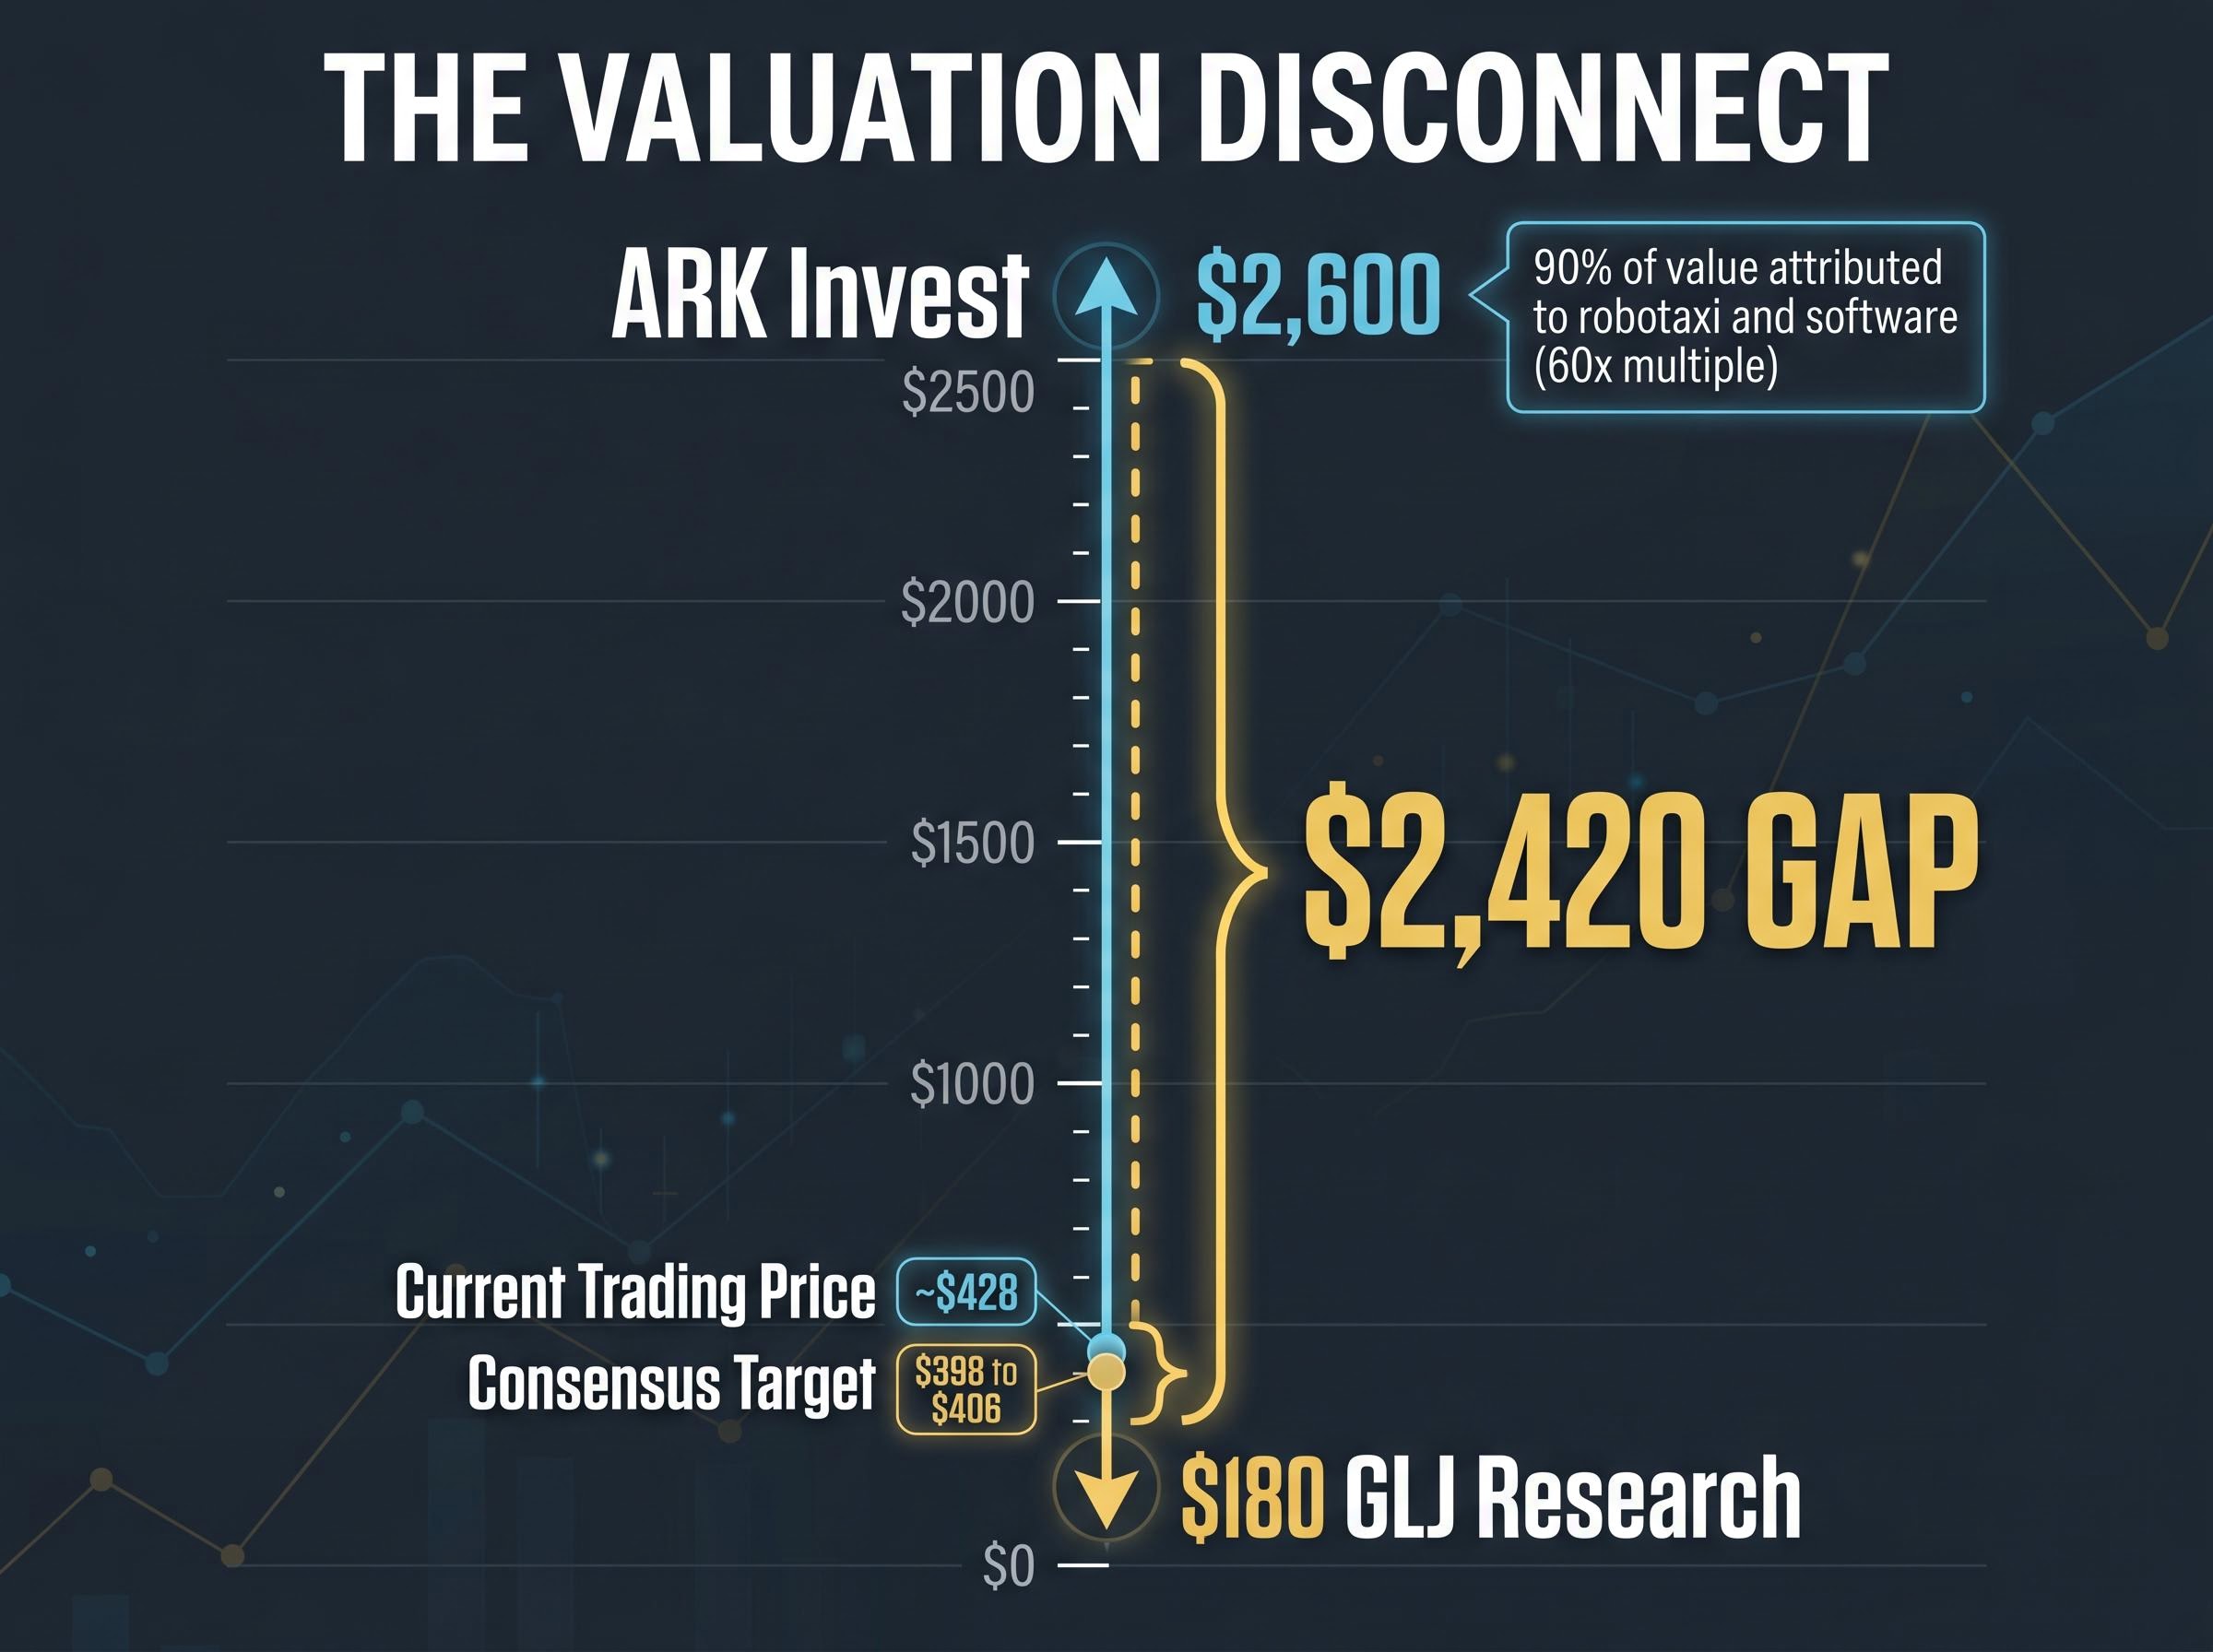
The stakes of disagreement: ARK Invest values Tesla at $2,600 per share. GLJ Research values it at $180. That $2,420 gap is not opinion. It is two models, built on different assumptions, arriving at different numbers. The disagreement is structural, not emotional.
Understanding where these tools fail is the prerequisite to using better ones. A reader who grasps this limitation stops anchoring on a single price target and starts asking which assumptions drive the number.
Rather than forcing a single projection onto an unknowable future, scenario-based valuation builds three independent versions of that future and assigns each a probability. The framework exists because companies like Tesla demand it.
Each scenario, bull, base, and bear, requires its own independent set of assumptions across three inputs: revenue growth rate, net profit margin, and valuation multiple. The scenarios do not share inputs. A bull case with 20 to 35% revenue growth operates on different margin and multiple logic than a bear case with 6 to 12% growth. NYU Stern’s Aswath Damodaran has written extensively on why probabilistic scenario analysis produces more defensible valuations than standard DCF for high-uncertainty firms, precisely because it forces the analyst to specify what they believe rather than hiding assumptions inside a single discount rate.
Damodaran’s probabilistic valuation framework at NYU Stern establishes that scenario analysis produces more defensible outputs than single-point DCF for high-uncertainty firms precisely because it forces the analyst to make explicit probability assignments rather than embedding assumptions inside a single discount rate.
| Input | Bull Case | Base Case | Bear Case |
|---|---|---|---|
| Revenue growth | 20-35% | 12-20% | 6-12% |
| Net profit margin | 20-30% | 14-20% | 8-14% |
| Valuation multiple | 25-35x earnings | 22-25x earnings | 18-22x earnings |
In practice, firms like Morgan Stanley apply this logic at the segment level, weighting automotive at 10 times 2027 EBITDA, robotaxi at 50 times free cash flow, and Optimus at 80 times. ARK Invest takes the framework further, attributing approximately 90% of Tesla’s value to robotaxi and software using a 60 times terminal multiple.
To build a scenario model, follow five steps:
The probability weights are where the analyst’s judgement enters most visibly. Assigning 5% to the bull case produces a very different weighted value than assigning 30%. This is a feature, not a flaw; it makes the analyst’s beliefs explicit and auditable.
Probability weight updates should not be arbitrary revisions made after share price moves; they should be triggered by observable operational milestones, such as auto gross margin clearing a defined threshold, Cyber Cab receiving a specific regulatory approval, or Optimus production hitting a targeted unit count, so that each quarterly earnings release either strengthens or weakens the case for each scenario in a documented, auditable way.
The bull case is specific. It requires a chain of operational milestones to materialise in sequence, on schedule, and at commercial scale.
For ARK Invest’s $2,600 target to hold, investors need to believe that:
ARK Invest’s $2,600 target (updated 30 April 2026) attributes approximately 90% of Tesla’s value to robotaxi and software, using a 60 times terminal multiple on the robotaxi scenario. It represents the outer bound of published bull-case structures.
Q1 2026 delivered partial evidence in support of this thesis. Autonomous vehicle miles nearly doubled. Cyber Cab production started at Giga Texas in April 2026, priced under $30,000 per unit, with expansion to seven new cities planned during 2026. Optimus V3 production is targeting late July or early August 2026 at Fremont, with external commercial availability projected for 2027.
The partial evidence coexists with a delivery record that demands scrutiny. In 2016, Tesla claimed its hardware was capable of full self-driving. In 2019, Elon Musk forecast one million robotaxis on the road by 2020. In 2021, he promised Optimus deployment by 2022. These are not character judgements; they are quantified execution risk. Tesla’s CFO indicated that 2026 capital expenditures are expected to surpass $25 billion, generating negative free cash flow during the transition period. The bull case annualised return range runs approximately 11 to 35% over a 10-year horizon, with an estimated 5 to 10% probability of full materialisation.
Investors who understand exactly what the bull case demands can size their position accordingly rather than treating it as a directional hunch.
The bear case does not require pessimism. It requires arithmetic.
Under bear assumptions, Tesla is an above-average electric vehicle manufacturer with no meaningful AI or robotics revenue contribution. Revenue growth runs at 6 to 12% (midpoint 9%). Net margins compress to 8 to 14% under pricing pressure from BYD, which surpassed Tesla as the world’s largest EV producer by volume, and other Chinese OEMs. The valuation multiple contracts to 18 to 22 times earnings, reflecting the market’s reassessment of the company as a hardware business rather than a software platform.
At a share price near $375, every projected return outcome under the bear case is negative.
That is the number the rest of the analysis organises around. The consensus 12-month analyst price target of approximately $398 to $406 already sits below the current trading price of roughly $428, signalling limited near-term upside even in the base case.
The same bear case assumptions applied to different entry prices produce dramatically different return profiles.
| Metric | Entry at $100 | Entry at $375 | Entry at $428 |
|---|---|---|---|
| Bear case 10-year annualised return | Positive | Negative | Negative |
| Bull case 10-year annualised return | Strongly positive | Positive (11-35%) | Moderate positive |
| Implied break-even difficulty | Low | High | Highest |
Tesla shares were available at approximately $100 a few years prior. A buyer at that price faces entirely different return math than a buyer near $428, even using identical scenario assumptions. The bear case for the $100 buyer may still produce positive returns. The bear case for the $428 buyer produces losses.
This is not a Tesla-specific observation. It is a transferable principle for any high-multiple stock: the higher the entry price, the more of the bull case must materialise simply to break even, and the less of the bear case the investor can absorb before permanent capital loss.
Three characteristics signal that a company is appropriate for scenario-based valuation rather than standard DCF:
Goldman Sachs exemplifies the conservative practitioner application: a neutral rating with a $405 target, weighting 70% on the automotive segment and explicitly warning on execution risk in the autonomous and AI divisions. That is the framework in action, with different probability weights than ARK Invest applied to the same company.
Competitive moat assessment is a required input, not an optional qualitative overlay. Figure AI reached a $39 billion valuation after its September 2025 Series C. Apptronik raised over $935 million in Series A funding. Waymo has been operating commercial driverless ride-hailing for several years with substantial real-world driving data. Each of these data points should directly inform the probability weights assigned to Tesla’s Optimus and robotaxi scenarios.
Before assigning probability weights to any transitional company’s scenarios, run this checklist:
Practical US data sources for each input:
Tesla is not obviously overvalued or undervalued at $428. It is priced for a specific probabilistic outcome. The Q1 2026 beat (revenue $22.4 billion, EPS $0.40 versus $0.35 consensus, gross margin 21.7% versus 17% estimate) confirmed that the core business is not collapsing. Forward analyst EPS estimates project earnings growing more than 5 times from current levels, which is the embedded assumption the market is pricing at 185 to 217 times forward P/E. The base case, partial execution on autonomous driving and robotics while the core automotive business continues, sits between the two scenario extremes.
The broader growth stock valuation environment in early 2026 adds important context to any single-company scenario model: Morningstar data shows growth equities trading at a 21% discount to fair value as of late March 2026, a level that has occurred less than 5% of the time since 2011, meaning the macro backdrop is itself a variable in any entry price assessment.
The principle: The price paid at entry determines how much of the future must materialise to justify the investment. At a low entry price, an investor can be wrong about the bull case and still earn acceptable returns. At a high entry price, the investor needs most of the bull case to arrive on schedule simply to break even.
This is not a Tesla rule. It is a valuation rule. Run the scenario framework on one company currently in a portfolio or under research, using the five data inputs identified above. Identify where break-even sits under each scenario. The answer to that question is more useful than any single price target.
This article is for informational purposes only and should not be considered financial advice. Investors should conduct their own research and consult with financial professionals before making investment decisions. Past performance does not guarantee future results. Financial projections are subject to market conditions and various risk factors.
Scenario-based stock valuation analysis builds three independent versions of a company's future, a bull case, a base case, and a bear case, each with its own revenue growth, margin, and multiple assumptions, then assigns probabilities to each to produce a weighted intrinsic value estimate.
Traditional tools like discounted cash flow and price-to-earnings multiples struggle with transitional companies because their future outcome distribution is wide and bimodal, meaning a large portion of the market capitalisation reflects unproven business lines rather than current earnings power.
The higher the price paid at entry, the more of the bull case must materialise simply to break even; for example, Tesla's bear case produces positive returns for a buyer at $100 but negative returns for a buyer at $375 or $428, using identical scenario assumptions.
The bull case requires full autonomous driving at commercial scale, a Cyber Cab robotaxi network expanding across multiple cities, meaningful third-party Optimus revenue, and sustained margin expansion as software revenue displaces lower-margin automotive sales.
Investors can use SEC EDGAR for financial filings, Yahoo Finance and GuruFocus for forward P/E and consensus EPS data, MarketBeat for analyst price target ranges, and company investor relations pages for earnings call transcripts and shareholder letters.