
Why an 11% Yield Fund Left Investors $20,000 Behind
13 hrs ago
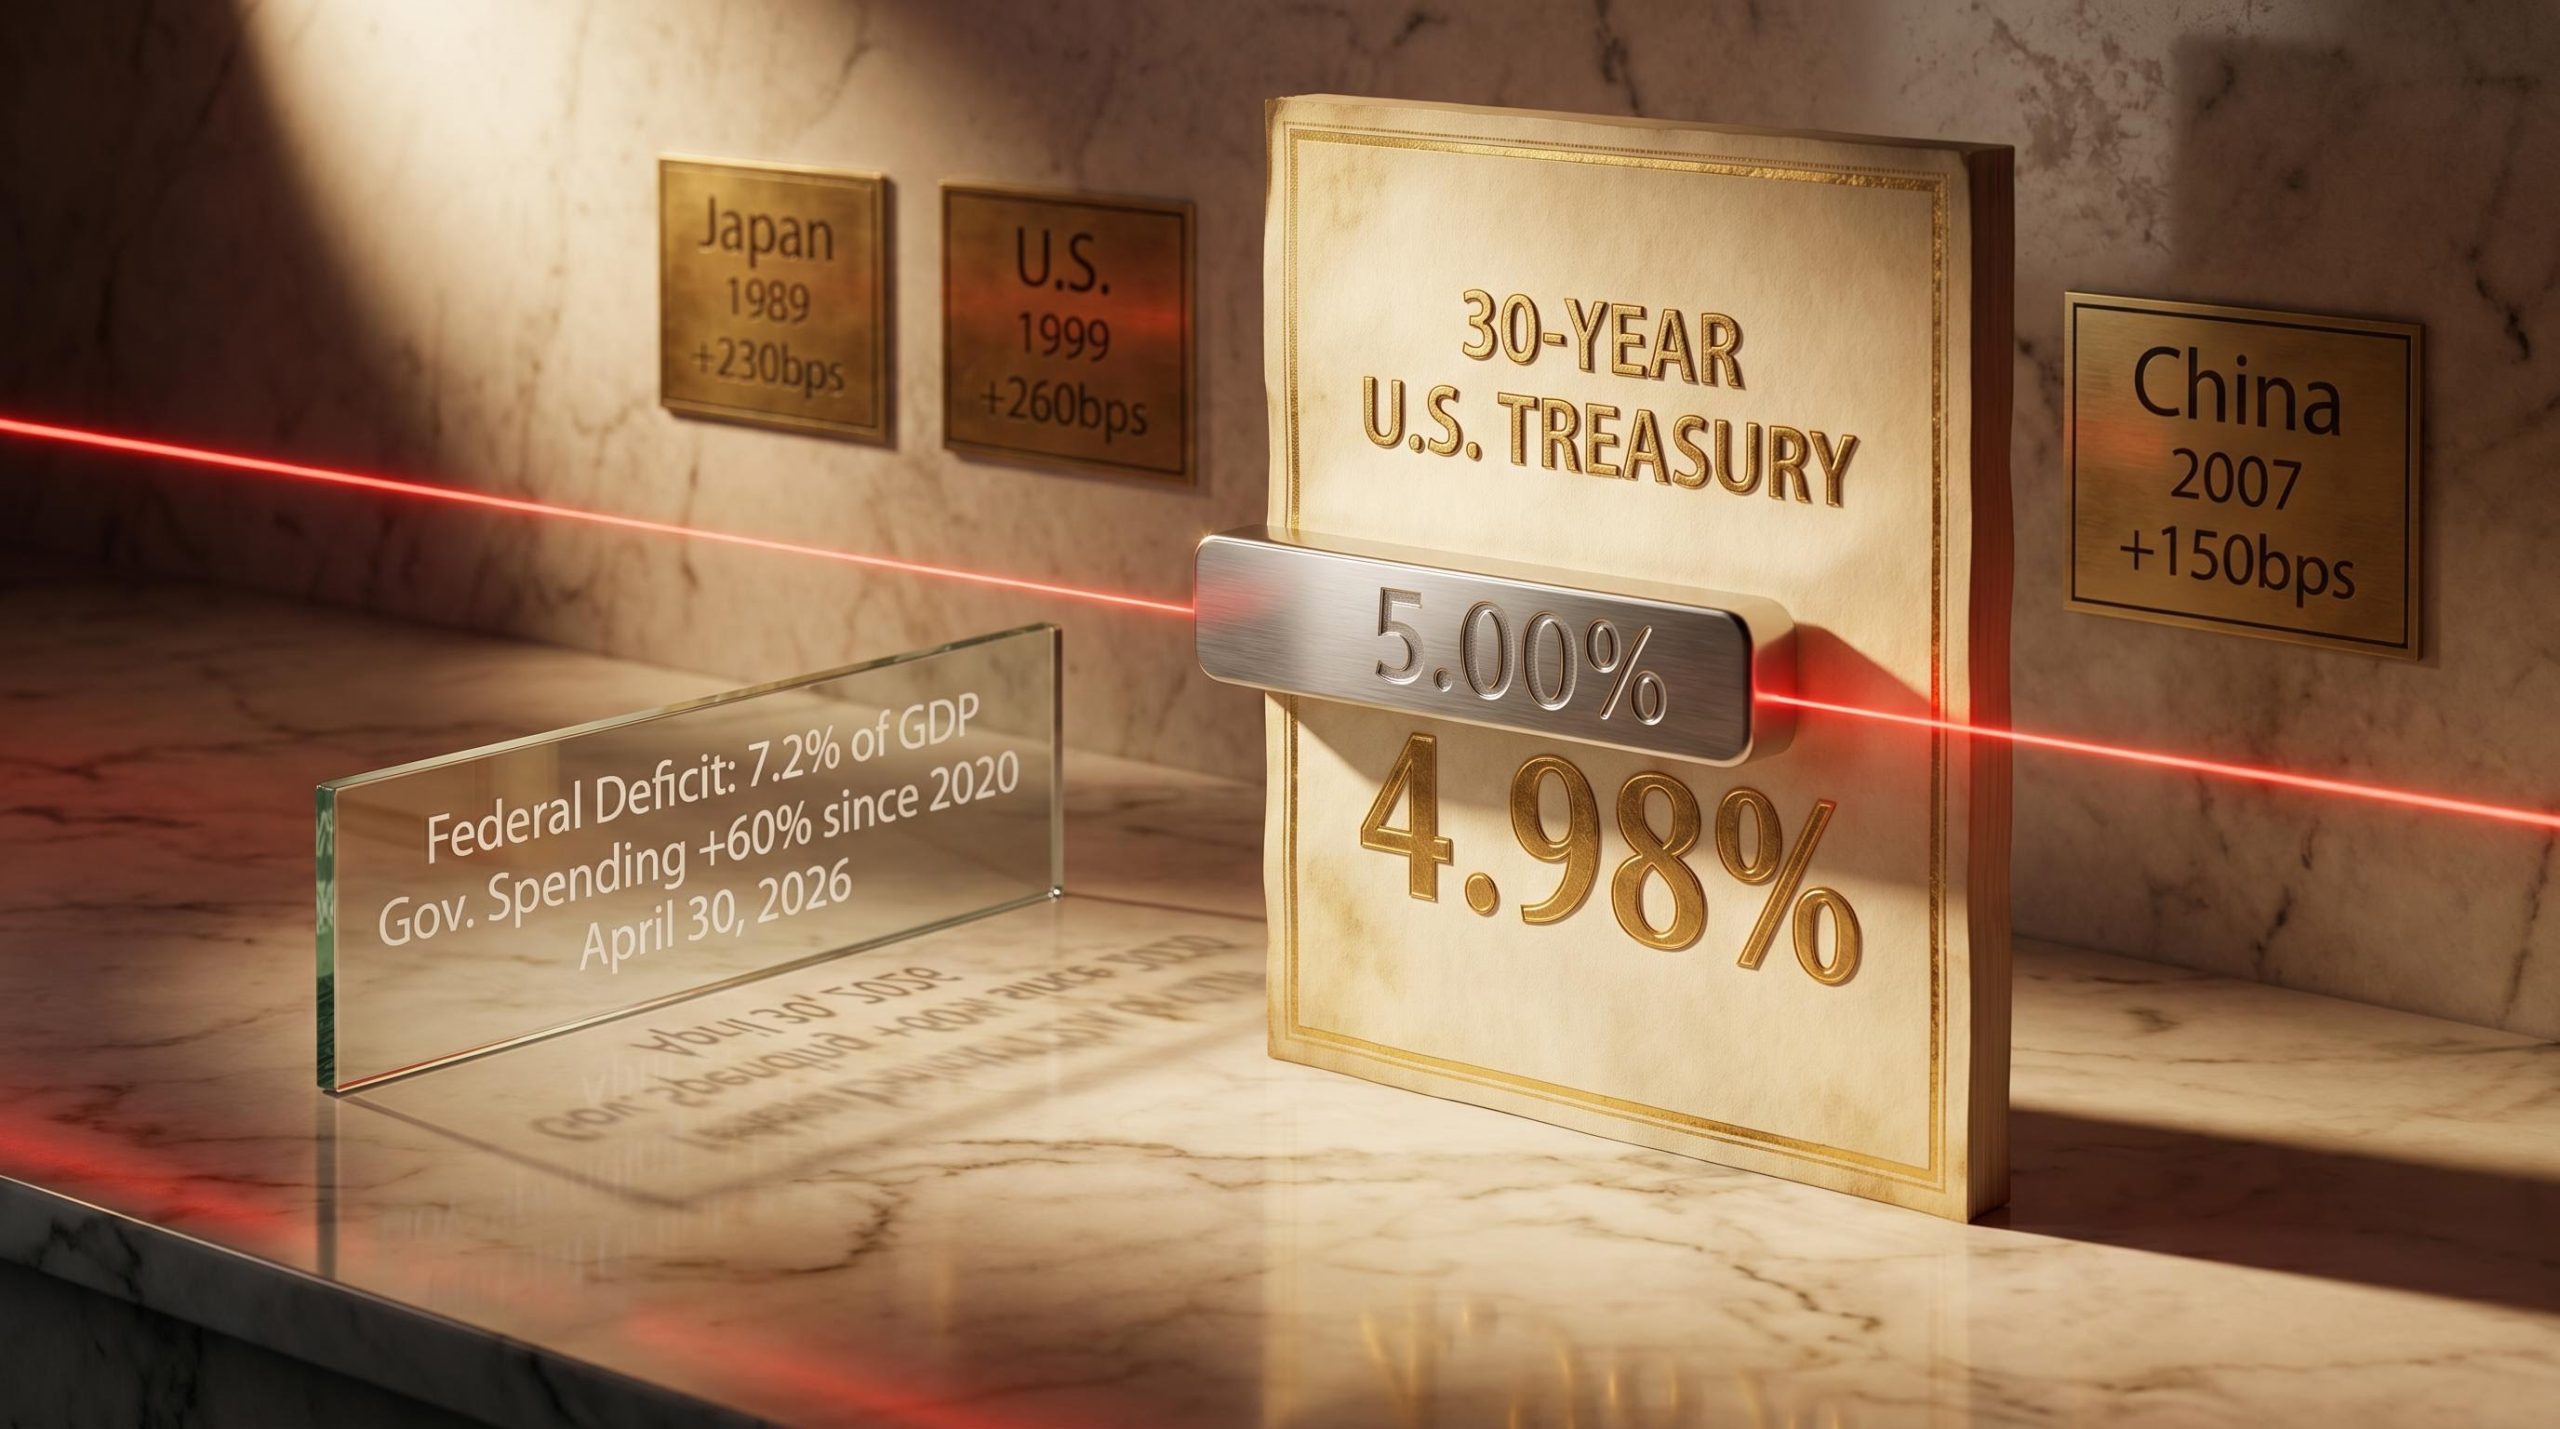
The 30-year U.S. Treasury yield closed at approximately 4.98% on 30 April 2026, stopping just a single basis point short of 5%, a level that Bank of America chief investment strategist Michael Hartnett has identified as a potential tripwire for broad market deterioration. With the federal deficit running at roughly 7.2% of GDP and government expenditure up approximately 60% since 2020, the fiscal arithmetic behind the yield’s rise is not abstract. It is mechanical, compounding, and aimed squarely at the threshold that has historically marked the end of major economic boom cycles. What follows is an examination of why 5% matters, how fiscal expansion is driving yields toward it, what history says about what comes next, and which asset classes sit most directly in the path of a breach.
The 30-year Treasury yield is not a number that moves in isolation. It is the benchmark rate that underpins 30-year fixed mortgage lending, long-duration corporate debt pricing, and the government’s own cost of financing its obligations. When this yield moves, the downstream effects are immediate and measurable.
At 5%, the practical consequences sharpen:
The long-term average for the 30-year yield sits at approximately 4.74%. The current level of 4.98% represents a meaningful elevation above that average, though not yet a historic breach.
The yield reached an intraday high of approximately 4.989% on 30 April, its closest confirmed approach to the threshold.
The 10-year Treasury crossing 5% in October 2023 produced an immediate tightening in mortgage spreads and a repricing of corporate credit risk, demonstrating that the 5% level functions as a practical threshold for borrowing cost transmission across the real economy, not merely a symbolic round number.
Hartnett’s analytical framework traces the yield pressure back to its origin: maximum government fiscal outlays. In his thesis, a combination of deglobalisation, wealth inequality, and populist political pressures drives governments toward spending levels that fuel rapid nominal GDP growth. That spending does not come free. It floods the bond market with supply while simultaneously running hot nominal growth, creating structural headwinds for fixed income and the dollar.
The mechanism works in three steps:
Federal Reserve research on debt and long-term rates has documented a measurable positive relationship between rising federal deficits and long-end Treasury yields, with term premia expanding as bond supply increases relative to the absorptive capacity of the market.
This is the cycle that brings yields toward 5%. It is not a single policy mistake; it is the cumulative effect of sustained fiscal expansion meeting a bond market that must absorb the result.
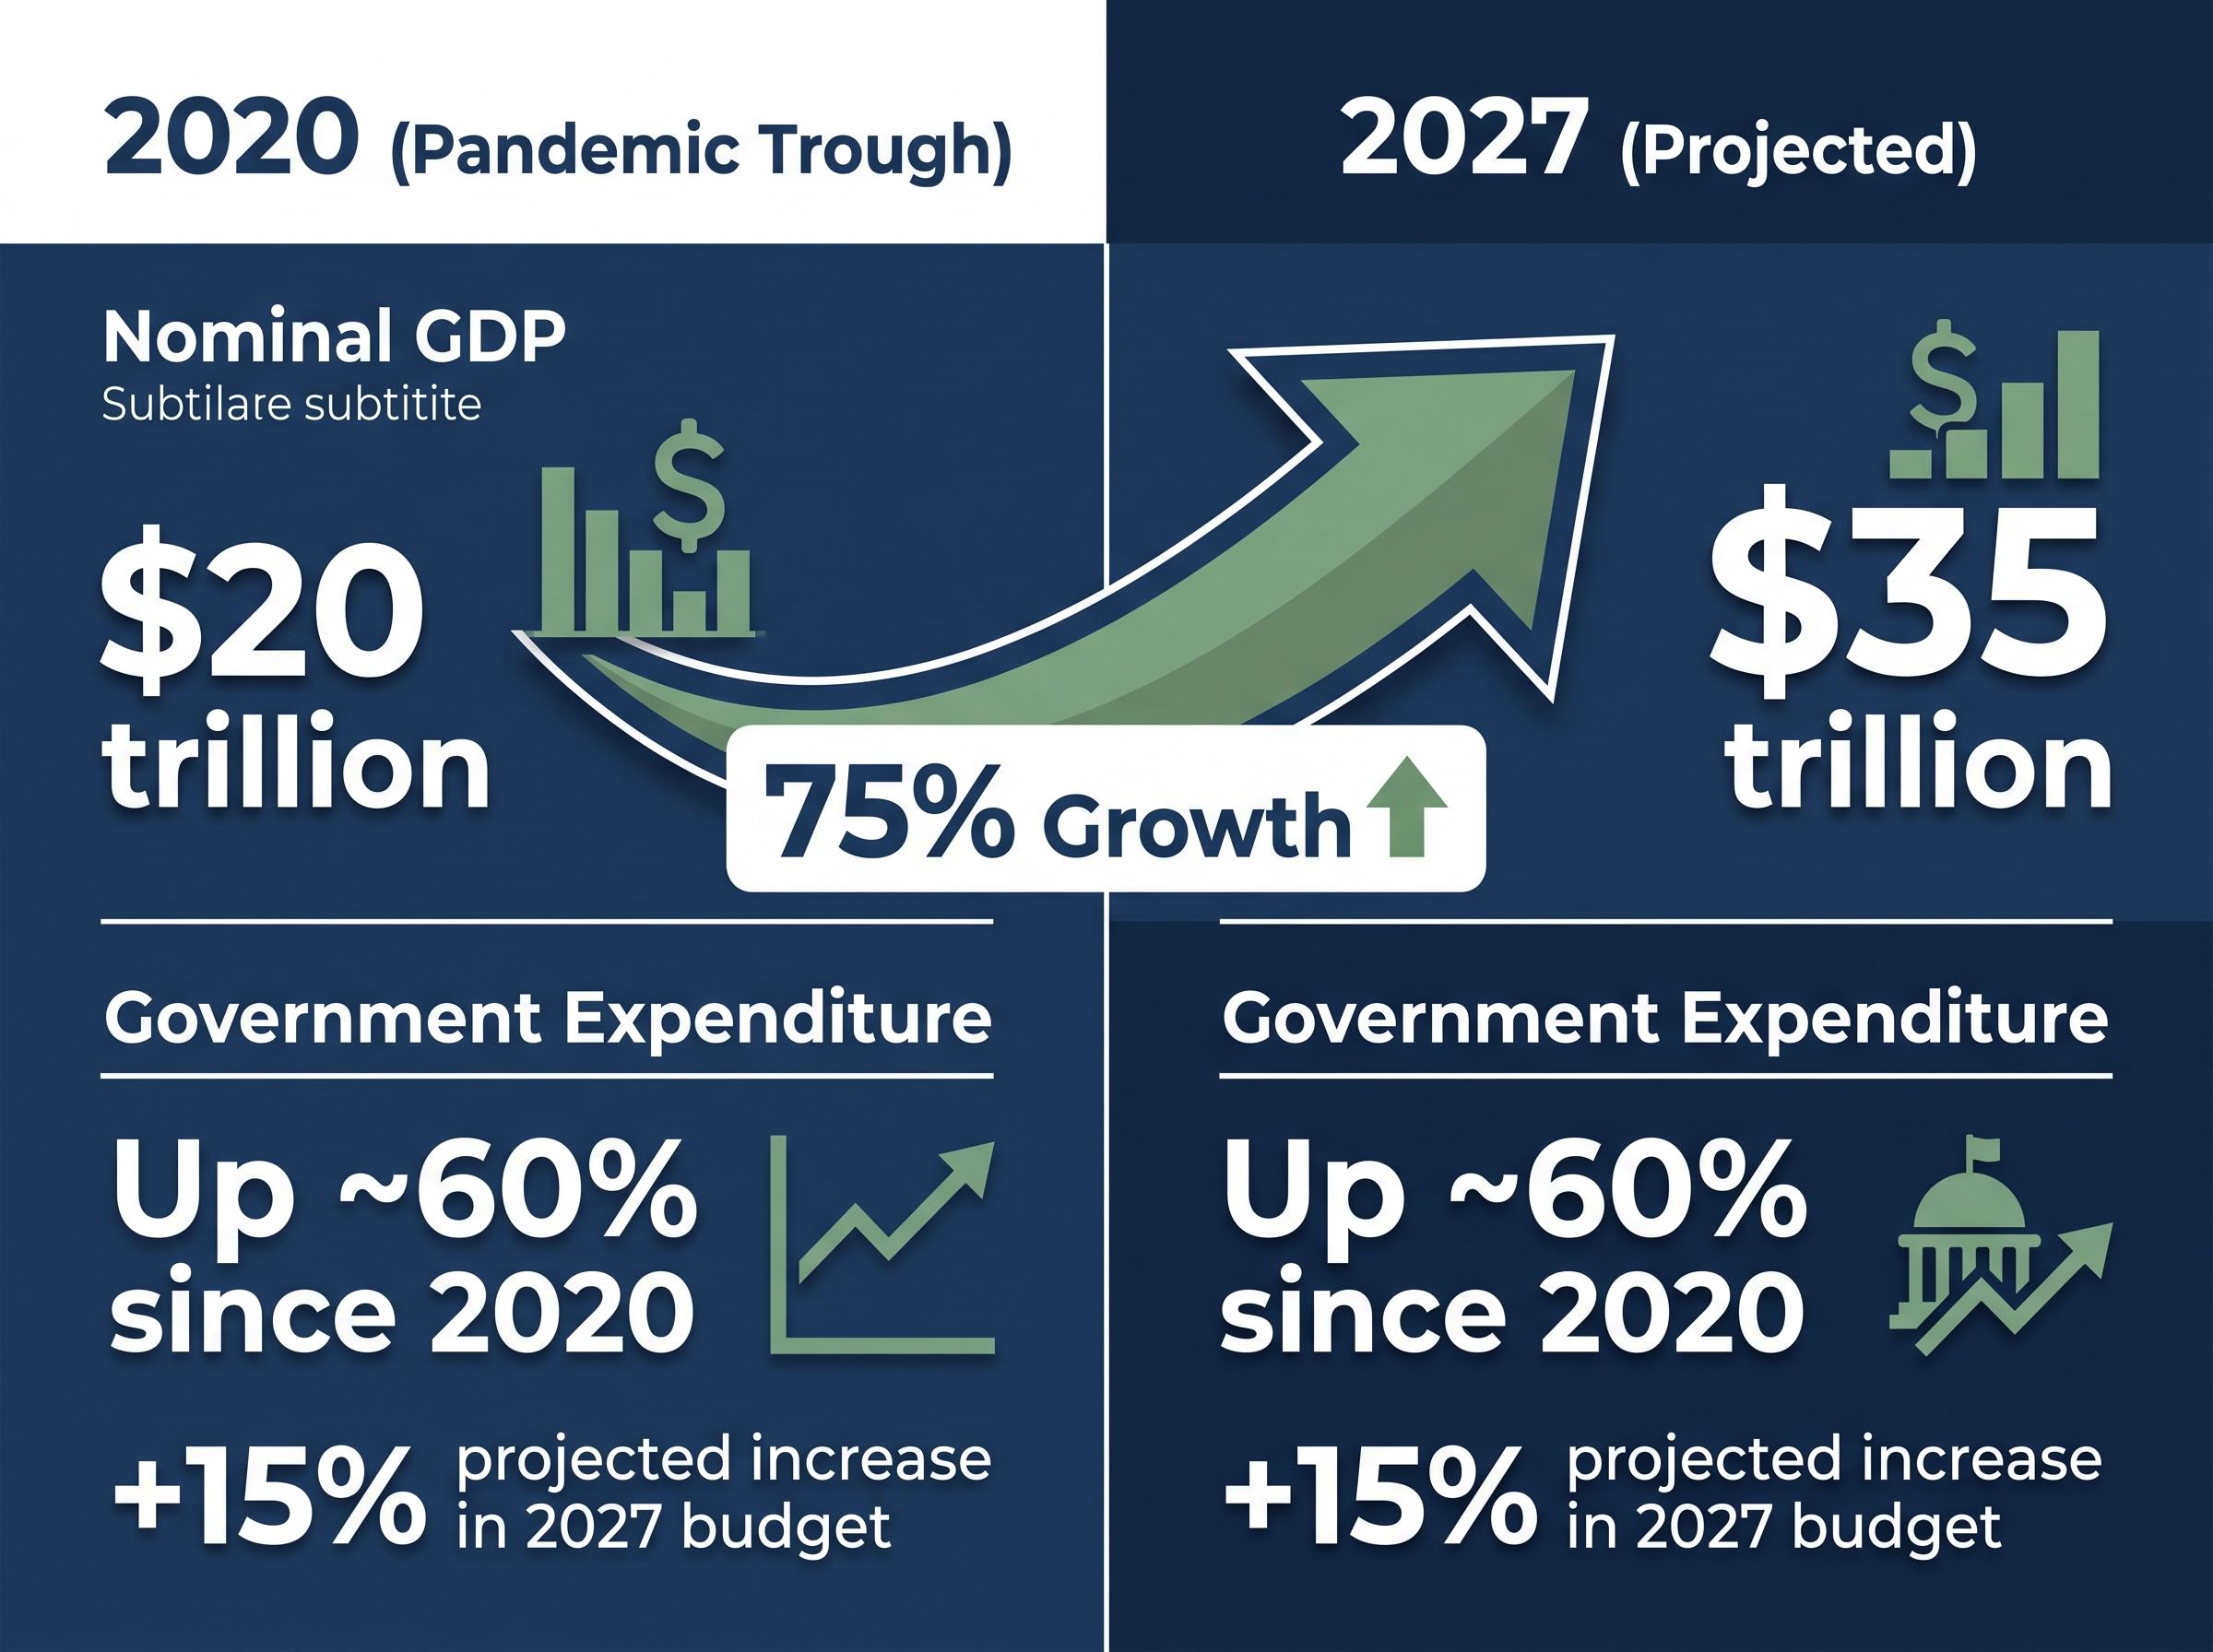
U.S. government expenditure has risen approximately 60% since 2020, with a further projected increase of roughly 15% in the proposed fiscal year 2027 budget. Nominal GDP is estimated to grow 75% from approximately $20 trillion at the 2020 pandemic trough to a projected $35 trillion by 2027.
The fiscal expansion driving nominal GDP higher does not exist in isolation from the household balance sheet: the consumer debt trajectory, with credit card balances reaching a record $1.28 trillion and the personal savings rate falling to 4.0% in February 2026, shows that the spending base underpinning nominal GDP growth is increasingly debt-financed rather than income-driven.
The political dimension compounds the fiscal one. The Trump administration’s inflation approval rating stands at 29%, barely above the Biden-era historical low of 28%. That proximity creates a political incentive to manage or resist further yield rises, though the fiscal dynamics pulling in the opposite direction show no signs of easing.
Hartnett anchors his warning in three historical episodes where abrupt bond yield spikes coincided with the end of major economic expansion cycles. Taken individually, each case has its own context. Taken together, the directional pattern carries weight.
In 1989, Japanese Government Bond yields surged 230 basis points, marking the peak of Japan’s asset bubble and the beginning of what became a multi-decade economic stagnation. The magnitude of the yield move reflected a bond market that had lost confidence in the sustainability of the expansion.
A decade later, U.S. Treasury yields climbed 260 basis points in 1999, signalling the end of the dot-com boom. The yield spike preceded the Nasdaq’s collapse by months, acting as a leading indicator that equity markets largely ignored until it was too late.
In 2007, Chinese bond yields rose 150 basis points, coinciding with the end of China’s prior growth cycle and the broader onset of the global financial crisis.
| Country | Year | Yield spike (bps) | Economic cycle ended |
|---|---|---|---|
| Japan | 1989 | 230 | Asset bubble and multi-decade stagnation |
| United States | 1999 | 260 | Dot-com boom |
| China | 2007 | 150 | Prior growth cycle, preceding global financial crisis |
Current conditions are not identical to any single episode. The U.S. fiscal profile, the role of the dollar as global reserve currency, and the structure of the bond market differ from each precedent. The directional pattern, however, is consistent: in each case, the bond market signalled the end of the cycle before equities priced it in.
Equity market complacency in this environment is not an abstract concern: the S&P 500 reached an all-time high of 7,173.91 on 27 April 2026 even as the Strait of Hormuz remained closed and Brent crude traded above $112 per barrel, replicating the pattern Hartnett’s historical precedents describe, where bond markets signal the end of a cycle months before equities reprice the risk.
Short-term interest rates are set directly by the Federal Reserve. The long end of the yield curve operates differently. The 30-year Treasury yield is determined by market forces: inflation expectations, the volume of bond supply generated by fiscal deficits, and global demand for U.S. government debt.
This distinction matters because many investors conflate Fed rate decisions with all bond market movements. A Fed rate cut does not automatically bring long-end yields down. If inflation expectations are rising and the Treasury is issuing record volumes of new debt, the long end can move higher even as the short end falls. This is yield curve steepening, and it can signal both growth optimism and fiscal stress simultaneously.
A 30-year yield approaching 5% while short-end rates sit lower means investors are demanding extra compensation for holding long-duration risk. That premium itself signals unease about the fiscal trajectory.
Three forces drive long-end yield movement, distinct from the Fed’s direct policy tool:
53 consecutive weeks of bond fund inflows, according to the most recent BofA Flow Show data, suggest institutional demand has remained resilient even as the yield approaches the threshold. That persistence sits in tension with the warning narrative, raising the question of whether demand can absorb supply indefinitely.
The macro thesis translates into a specific positioning framework. Hartnett’s preferred exposures, referred to as “the Cs,” reflect the asset classes that benefit from the boom loop environment of strong nominal GDP and fiscal expansion:
Bonds and the dollar, by contrast, face structural headwinds in this framework. The same fiscal expansion that lifts nominal GDP simultaneously pressures fixed income returns and erodes dollar purchasing power.
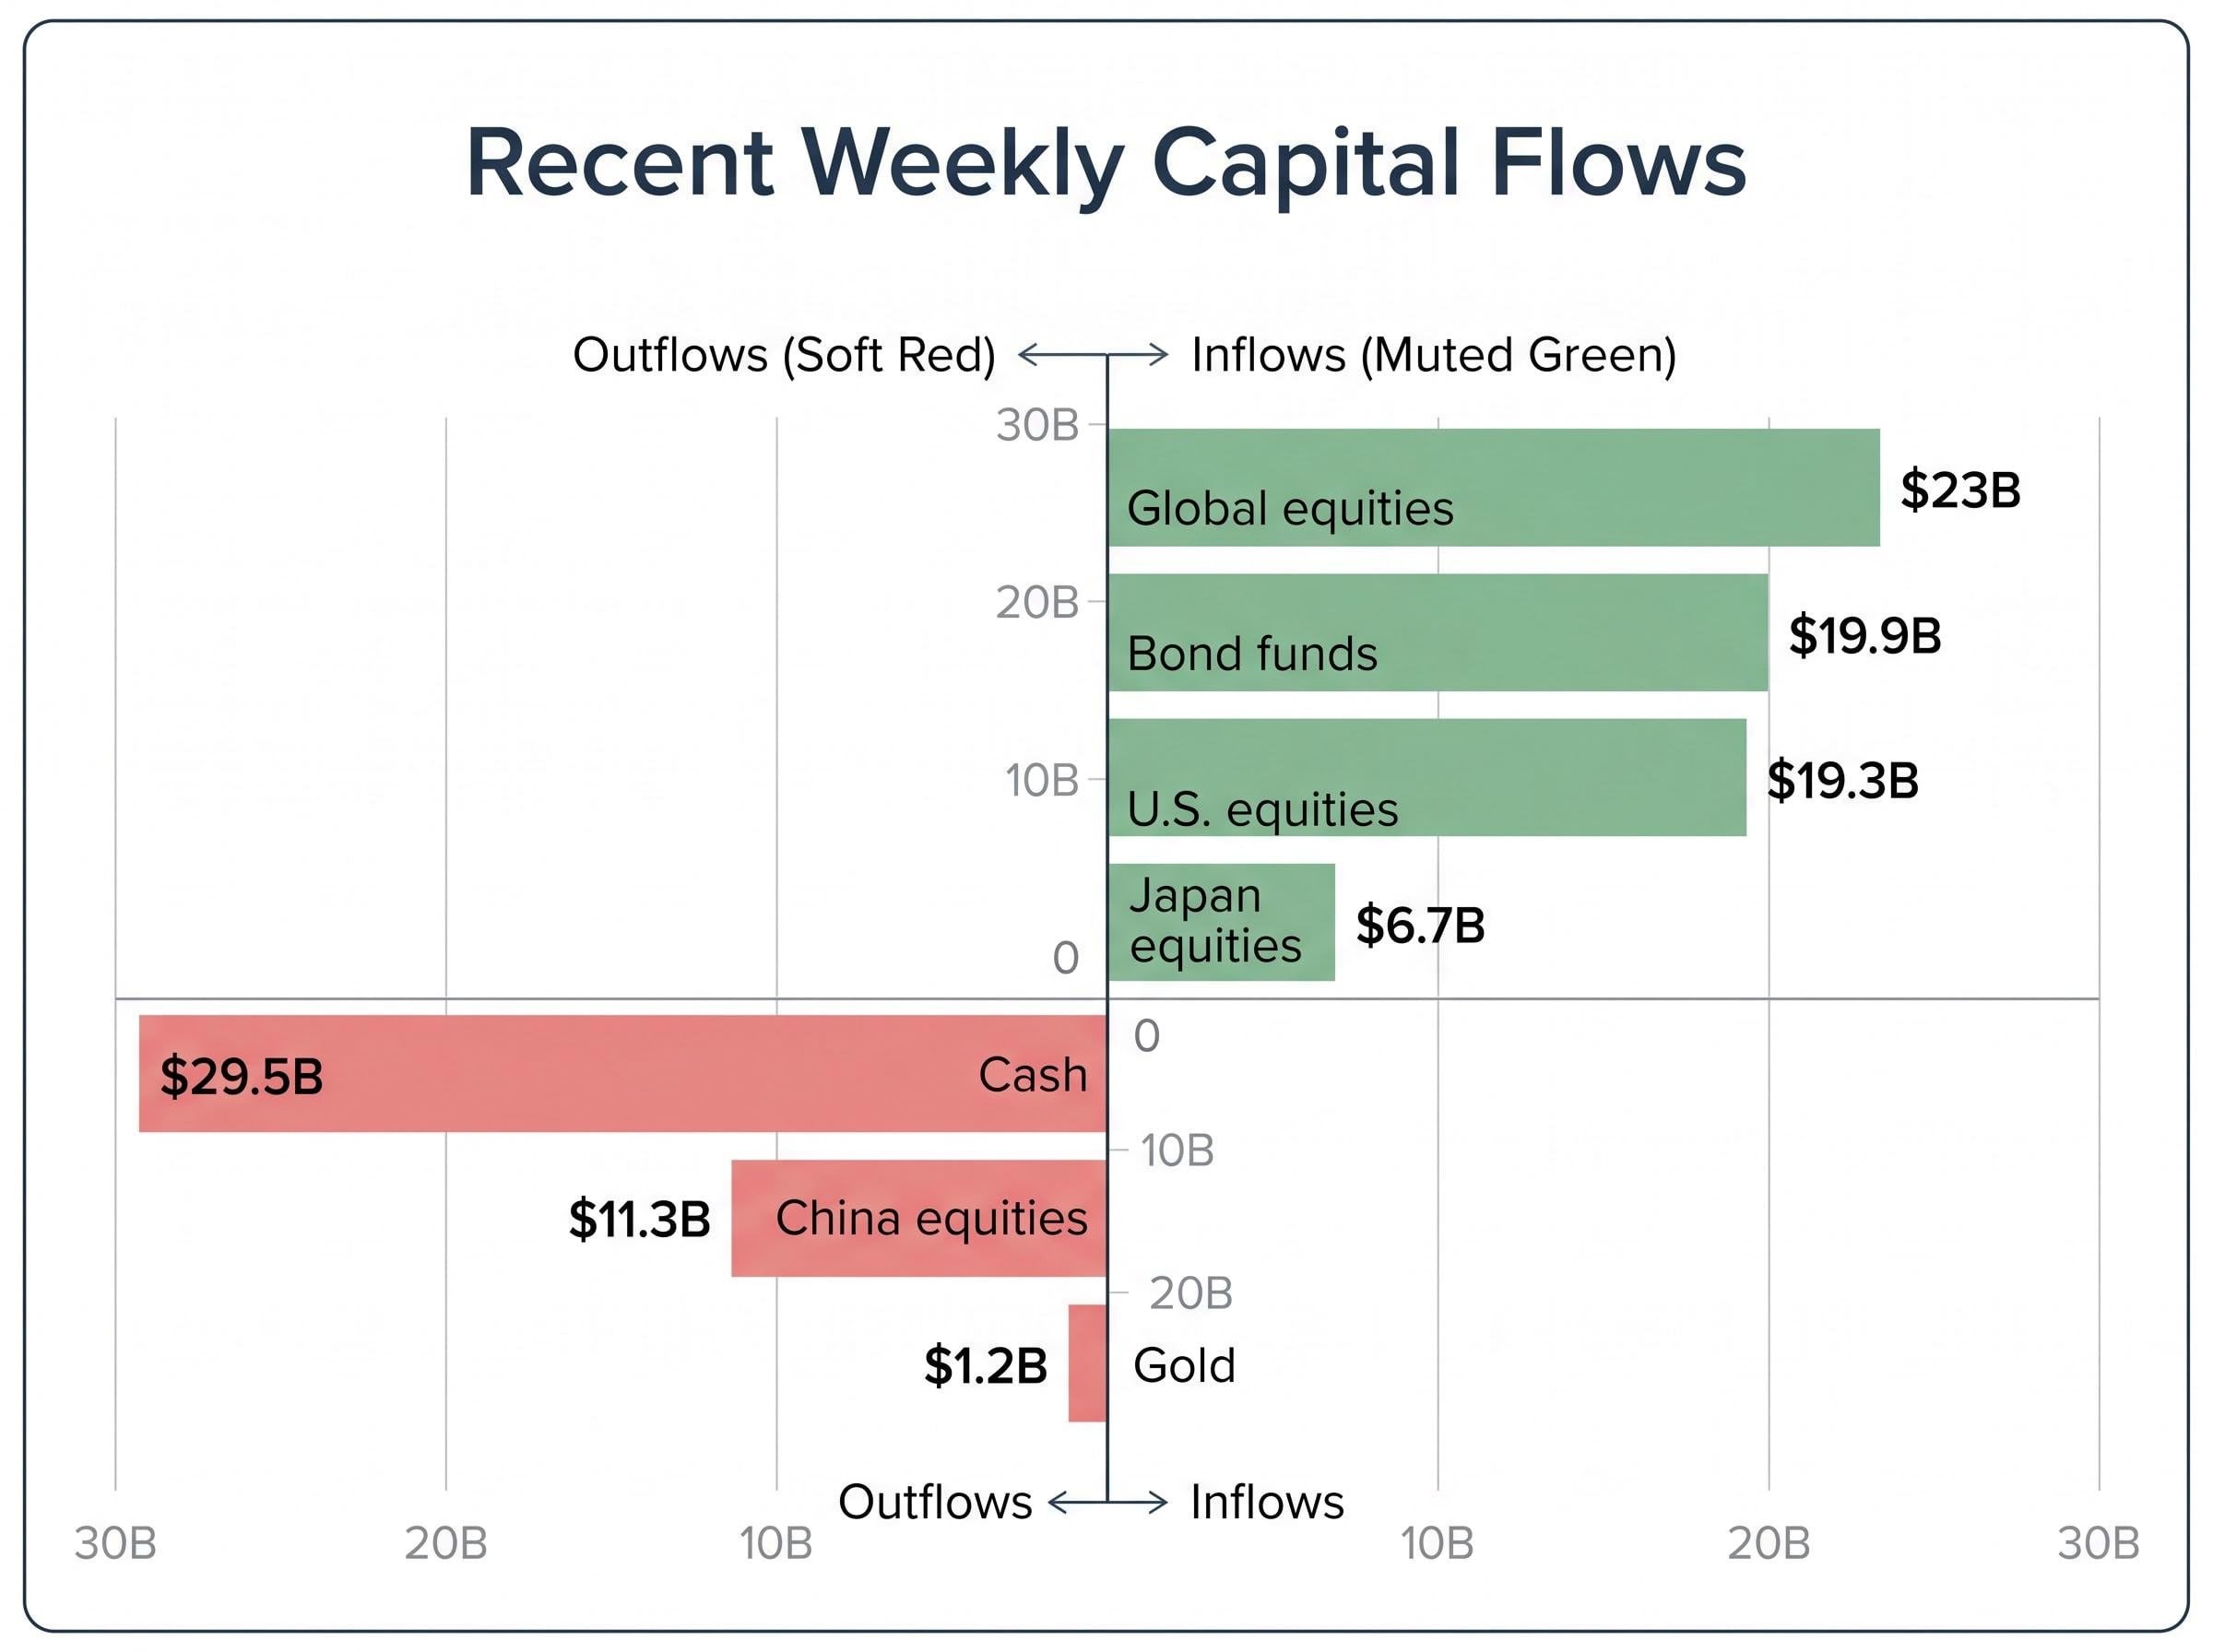
The most recent weekly capital flow data provides a mixed picture when set against Hartnett’s positioning thesis.
| Asset class | Weekly flow | Signal direction |
|---|---|---|
| Global equities | $23B inflows | Risk-on |
| U.S. equities | $19.3B inflows (5th consecutive week) | Risk-on |
| Bond funds | $19.9B inflows (53rd consecutive week) | Demand resilient |
| Japan equities | $6.7B inflows (largest since May 2013) | Rotation signal |
| Cash | $29.5B outflows | Risk-on |
| Gold | $1.2B outflows (first in six weeks) | Safe-haven fade |
| China equities | $11.3B outflows (largest since January 2026) | Friction with Hartnett’s China thesis |
The $11.3 billion China equity outflow, the largest single-week withdrawal since January 2026, stands in direct friction with Hartnett’s inclusion of China among his preferred exposures. Whether that divergence reflects short-term positioning noise or a structural disagreement with the thesis is a question the flow data alone cannot resolve. The BofA Bull and Bear Indicator rose to 6.6 from 6.3, remaining in neutral territory.
The 30-year yield closed at approximately 4.98% on 30 April 2026. Its intraday high reached approximately 4.989%.
The 4.989% intraday high on 30 April marks the closest confirmed approach to the 5% threshold in 2026.
No confirmed breach above 5% has occurred. The combination of fiscal deficit pressure at 7.2% of GDP, ongoing Treasury bond supply, and nominal GDP running at an annualised rate of +2.0% (per the Q1 2026 advance estimate) keeps the threshold in active play. March 2026 headline CPI came in at +3.3% year-over-year, with the April 2026 CPI report due 12 May 2026.
Three near-term data points and catalysts warrant close attention:
Oil shock rate repricing adds a second pressure vector on top of the fiscal deficit dynamic: Brent crude above $110 per barrel since late April 2026 has already stripped 50 basis points of expected Fed cuts from market pricing, meaning the long-end yield faces upward pressure from both the Treasury supply channel and a reassessment of the inflation path the Fed can credibly accommodate.
The question facing investors is whether the administration’s reported interest in sustaining Treasury demand can hold the line, or whether fiscal dynamics ultimately force a breach that resets the macro environment.
This article is for informational purposes only and should not be considered financial advice. Investors should conduct their own research and consult with financial professionals before making investment decisions.
Hartnett’s warning is grounded in both the current fiscal arithmetic and historical precedent. The 5% level on the 30-year Treasury yield is not an arbitrary round number; it is a point where mortgage affordability, corporate borrowing costs, and government debt service pressures converge into a materially different economic environment.
The elements that bring the threshold into focus are clear: a boom loop mechanism driven by sustained fiscal expansion, three historical precedents where bond yield spikes marked the end of major economic cycles, a specific positioning framework built around commodities, semiconductors, consumers, and China, and a set of near-term catalysts led by the 12 May CPI release.
Whether 5% holds or breaks remains unresolved. The data arriving over the coming weeks, particularly on inflation and Treasury issuance, will determine which side of the line the bond market settles on. That makes it a threshold worth watching, not with alarm, but with the attention it warrants.
For investors ready to build a specific response to a persistent high-yield environment, our full explainer on inflation-era portfolio tactics covers the case for Treasury Inflation-Protected Securities, the rationale for avoiding long-duration bonds at current yield levels, and how a 10-15% cash buffer can be deployed systematically into market dislocations if the 5% threshold triggers broader repricing.
Past performance does not guarantee future results. Financial projections are subject to market conditions and various risk factors.
The 30-year Treasury yield is the interest rate the U.S. government pays on its longest-duration bonds, and it serves as the benchmark rate underpinning 30-year fixed mortgages, long-duration corporate debt pricing, and government debt service costs. When it rises, borrowing costs across the entire economy follow.
Bank of America strategist Michael Hartnett identifies 5% as a tripwire where mortgage rates would exceed 8%, corporate borrowing costs would sharply increase, and the government's fiscal debt service burden would compound significantly, creating a materially different economic environment for all asset classes.
Three major historical episodes show bond yield spikes preceding the end of economic boom cycles: a 230 basis point surge in Japanese Government Bond yields marked the 1989 asset bubble peak, a 260 basis point rise in U.S. Treasury yields preceded the dot-com bust in 1999, and a 150 basis point increase in Chinese bond yields coincided with the 2007 global financial crisis onset.
The most immediate catalyst is the 12 May 2026 CPI release, where a hotter-than-expected inflation reading could push yields through the 5% level. Ongoing Treasury debt auctions and any shift in fiscal policy signals are also identified as near-term factors to watch.
Michael Hartnett favours commodities, semiconductors, consumer-facing assets, and China as preferred exposures in a high-nominal-GDP environment, while treating bonds and the dollar as facing structural headwinds. Separately, inflation-era portfolio tactics including Treasury Inflation-Protected Securities and reduced long-duration bond exposure are highlighted as practical responses.


