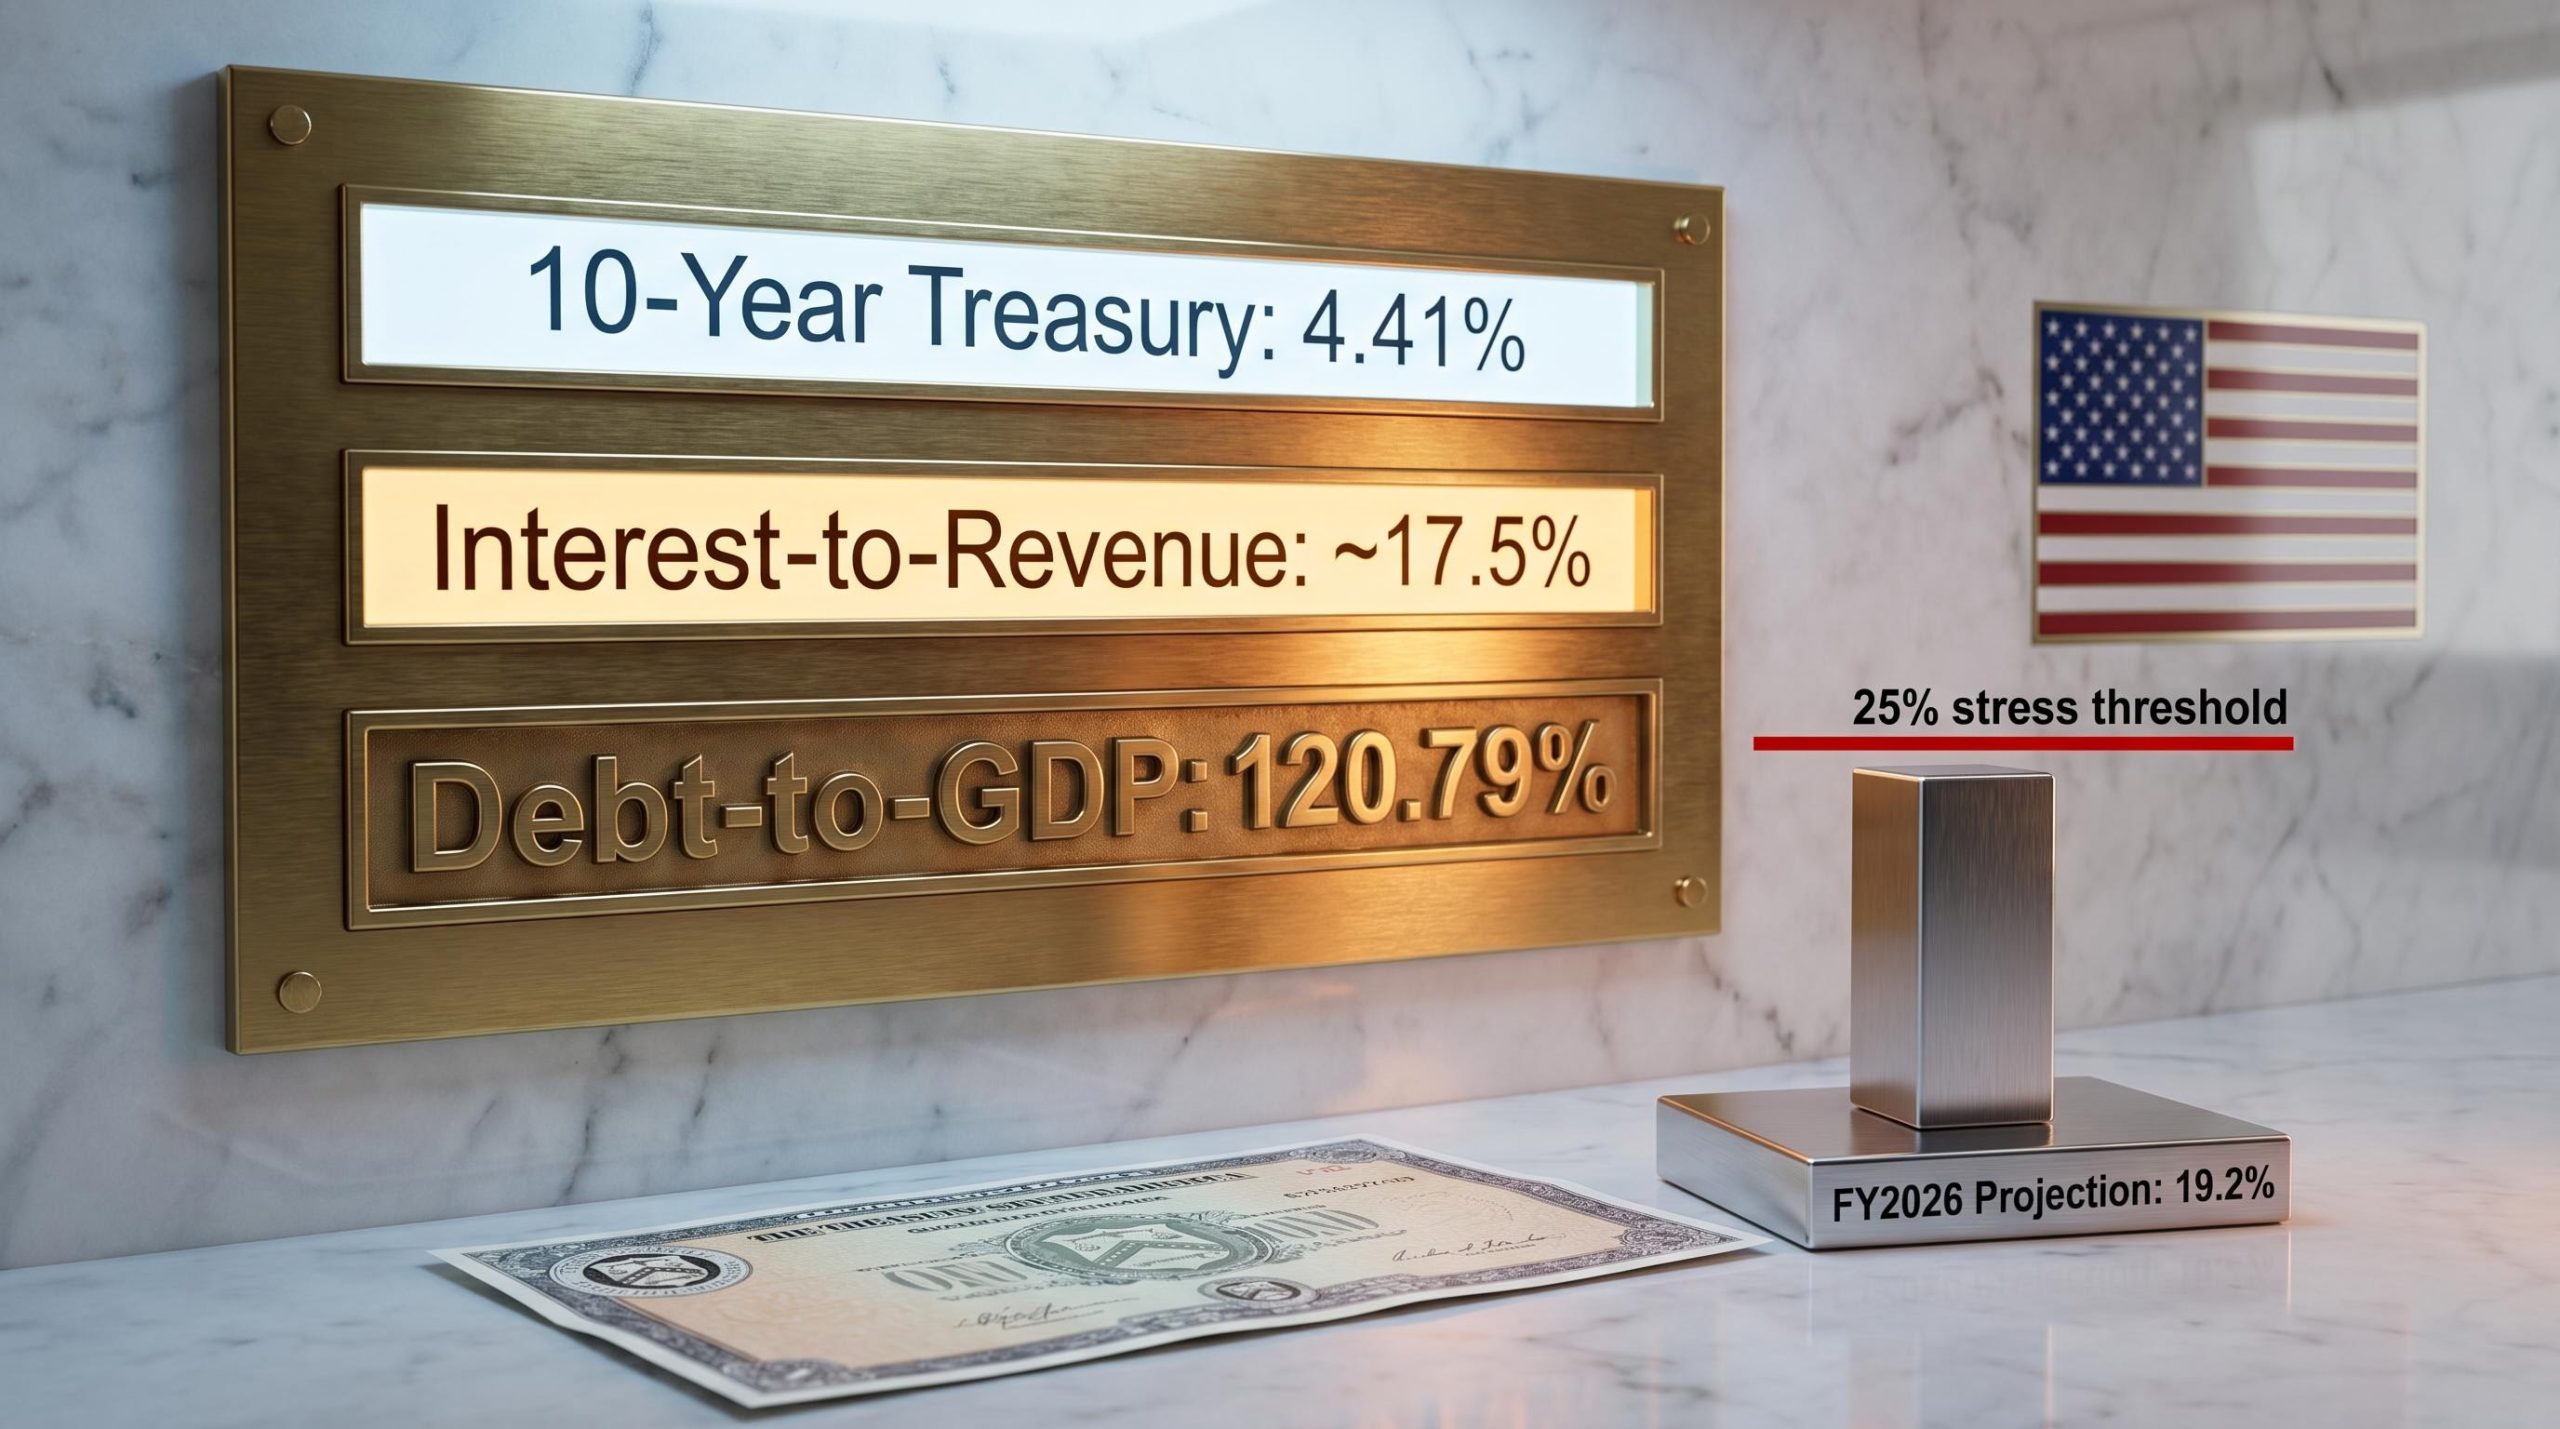
Why Debt-to-GDP Tells Investors Little About US Fiscal Health
1 min ago

Australian investors in NDQ pay 0.48% per year in management fees. SCHG, which holds many of the same companies, charges 0.04%. On a $100,000 portfolio, that gap costs roughly $440 every year before compounding even begins to compound the damage.
The comparison between these two funds has become a recurring debate among cost-conscious Australian investors. The fee difference appears negligible in percentage terms, yet it can erode tens of thousands of dollars in long-term wealth. With US-listed ETFs now accessible through mainstream Australian brokers, the question is no longer whether switching is possible but whether it is actually worth it once the full picture is accounted for.
This analysis cuts through the headline fee gap to examine what Australian investors actually gain and give up when choosing between NDQ and SCHG, covering performance data, compounding cost drag, foreign exchange and tax friction, and the practical conditions under which each fund makes sense.
The arithmetic is straightforward. NDQ charges a management expense ratio (MER) of 0.48% per annum. SCHG charges 0.04%. That is a 12x difference in annual fees, and it translates into real money at every portfolio size.
| Portfolio Size | NDQ Annual Fee | SCHG Annual Fee | Annual Gap |
|---|---|---|---|
| $10,000 | $48 | $4 | $44 |
| $50,000 | $240 | $20 | $220 |
| $100,000 | $480 | $40 | $440 |
At $44 a year on a small portfolio, few investors would bother switching platforms. At $440 a year on $100,000, the number sharpens. But the real weight lands over time.
Over 20 years, a 0.44% annual cost difference on a $100,000 starting portfolio (assuming a 10% gross return) compounds to approximately $30,000-$35,000 in foregone wealth.
Vanguard’s expense ratio research confirms that even a seemingly modest annual fee difference compounds into a material drag on terminal wealth over multi-decade holding periods, because each dollar paid in fees is a dollar that cannot generate future returns.
That figure is the catalyst for the entire NDQ versus SCHG debate. Whether it survives scrutiny once real-world costs are added is the subject of every section that follows.
The compounding cost of ETF fees is well-documented in Morningstar research, which identifies annual expense ratios as a more reliable predictor of long-term relative returns than past performance, fund size, or star ratings; a fee difference of less than 1% per annum can compound into a terminal wealth divergence of approximately $575,972 over a 30-year horizon.
Before treating NDQ and SCHG as interchangeable fee alternatives, it is worth understanding what each fund actually tracks. They are not the same index wrapped in different fee structures.
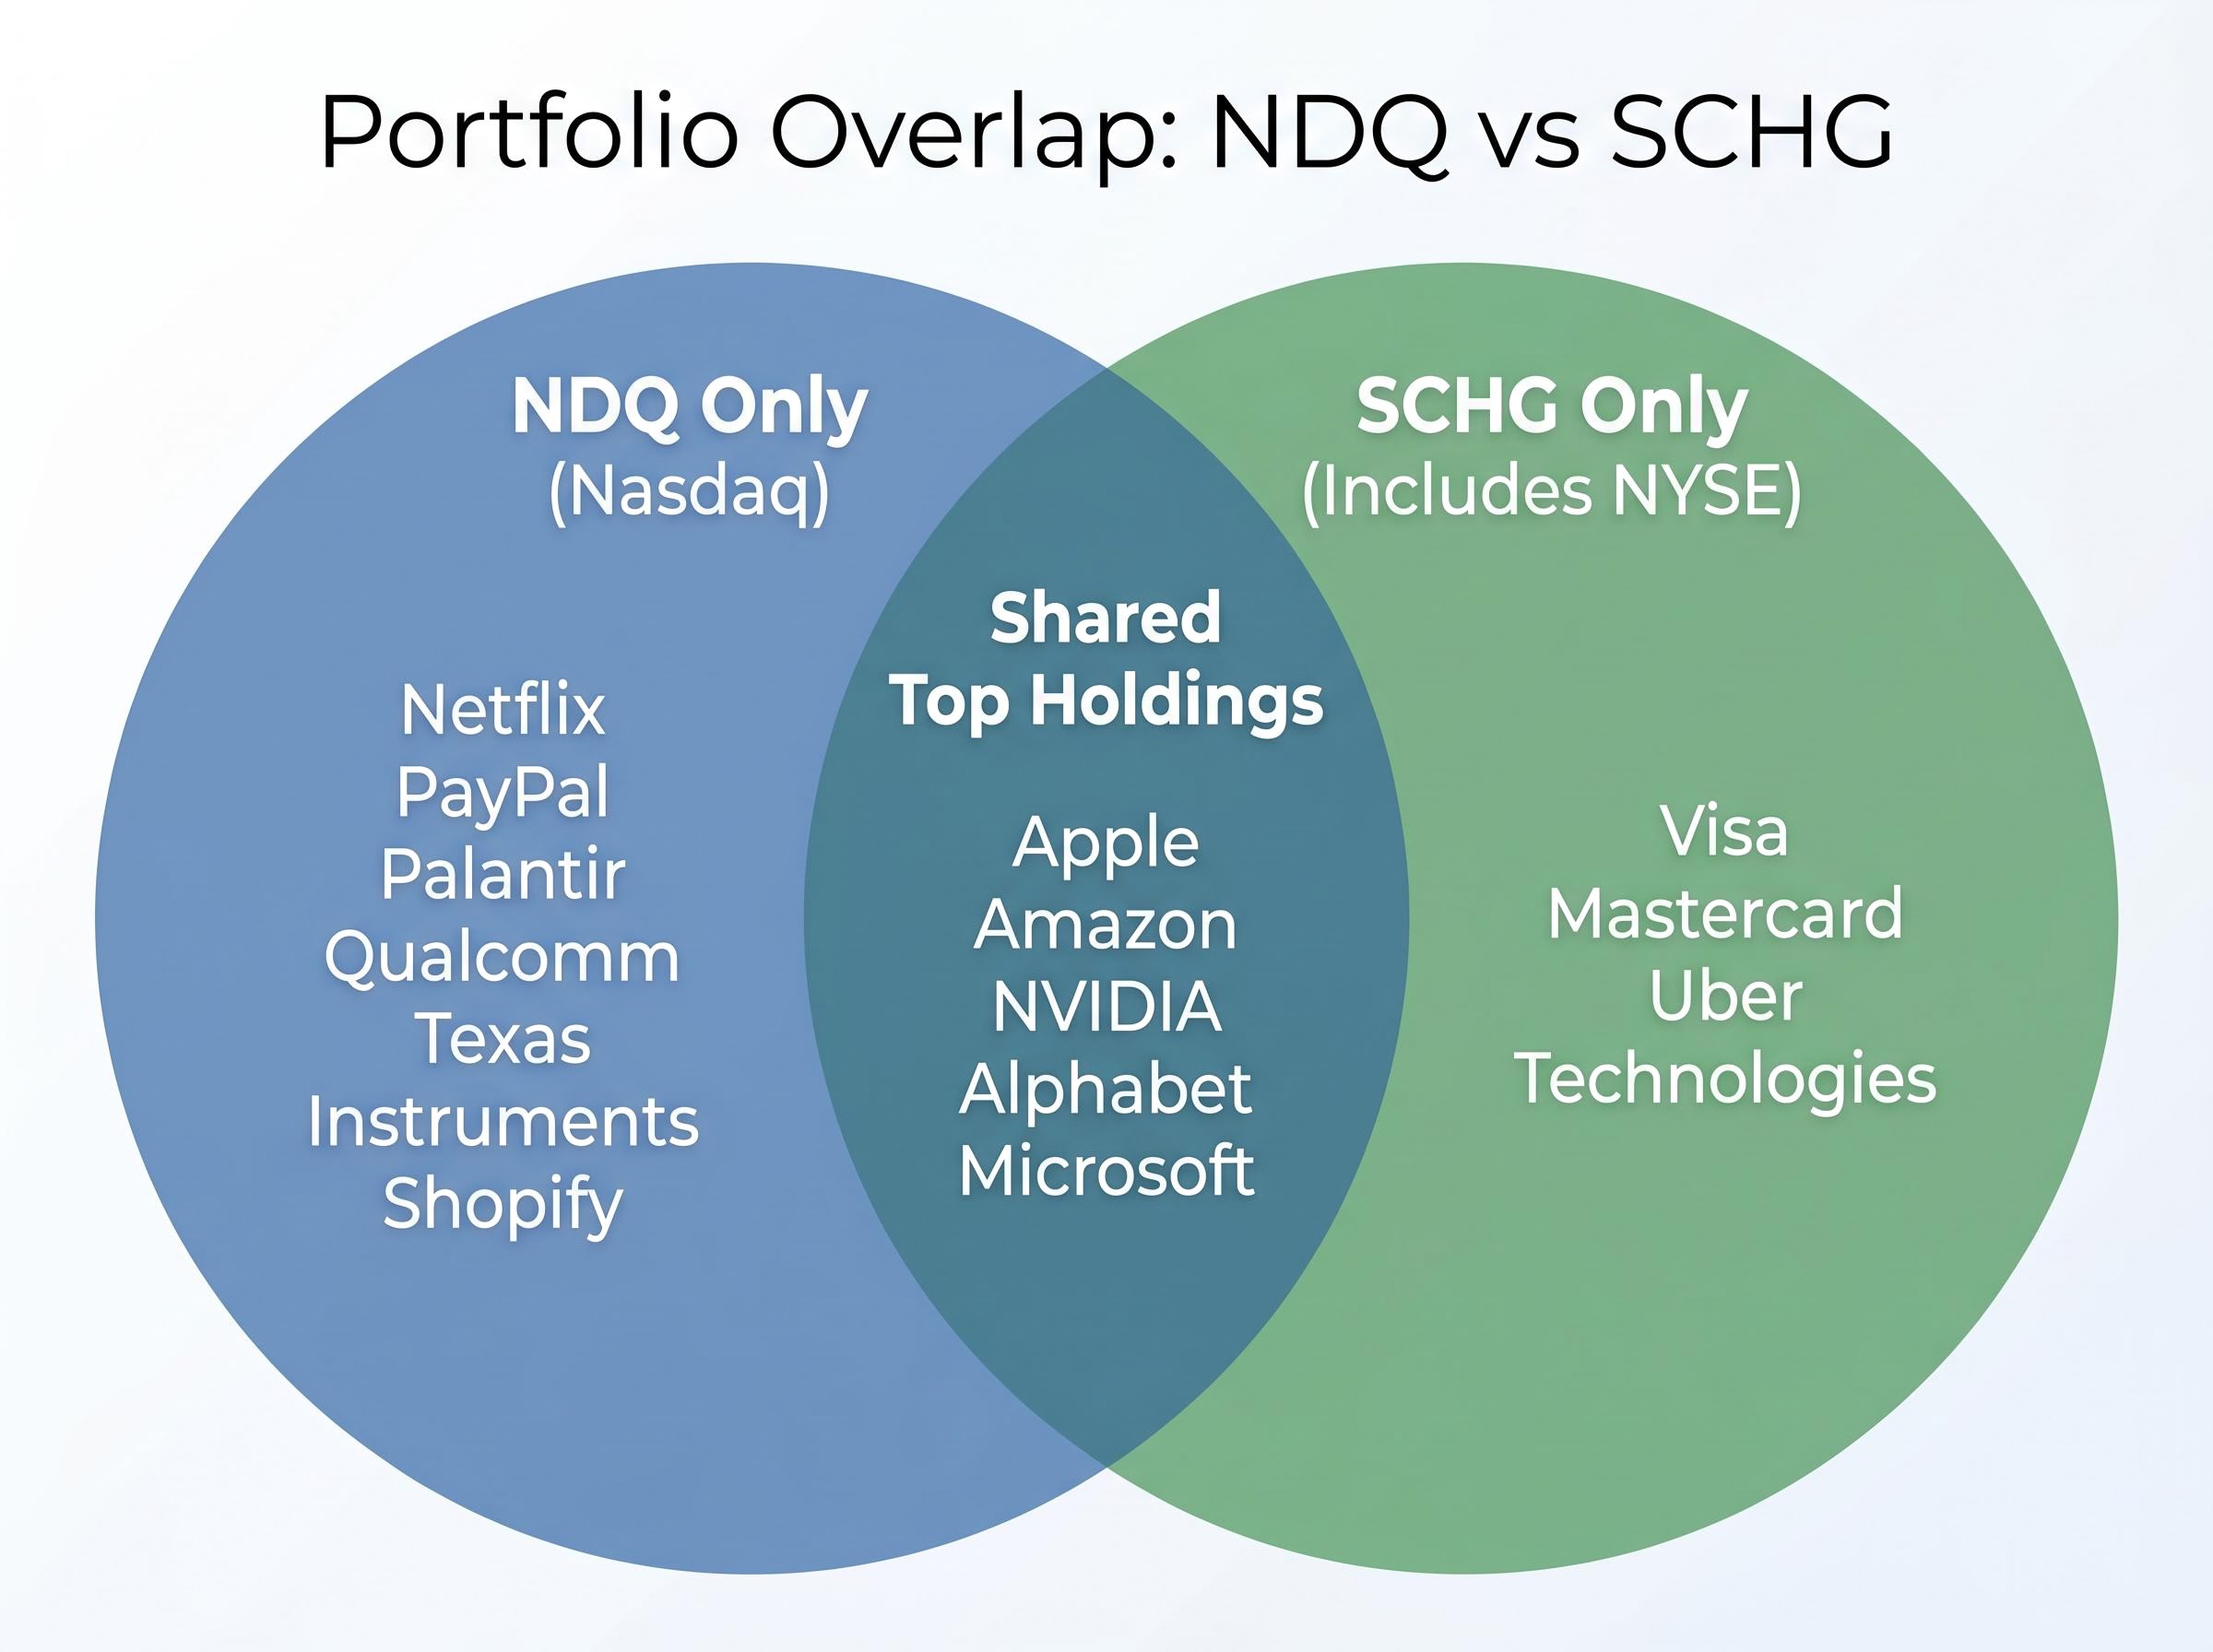
NDQ tracks the Nasdaq-100 Index, which comprises the 100 largest non-financial companies listed on the Nasdaq exchange. SCHG tracks the Dow Jones U.S. Large-Cap Growth Total Stock Market Index, a broader growth universe that includes companies listed on both the Nasdaq and the NYSE.
The distinction matters. SCHG’s mandate is wider. NDQ’s is exchange-specific.
The overlap between the two funds is substantial at the top of the portfolio. The largest positions in both include:
These five names represent a significant portion of both funds by weight. Investors holding either fund have heavy exposure to the same US mega-cap growth companies.
Because SCHG draws from the NYSE as well as the Nasdaq, it includes several large growth names that NDQ cannot hold:
These companies are excluded from NDQ solely because of their NYSE listing, not because of their growth profile. NDQ also holds names like Netflix, PayPal, Palantir, Qualcomm, Texas Instruments, and Shopify that reflect the Nasdaq-100’s specific composition. Investors considering a fee-driven switch should recognise they are also switching index methodology.
The fee case for SCHG is clean on paper. The performance data complicates it considerably.
Over 10 years (as at 30 April 2026), NDQ delivered an annualised return of 21.33%, according to BetaShares official data. SCHG delivered 18.53% over the same period, per PortfoliosLab. That is a 2.8 percentage point annual outperformance gap, more than six times the 0.44% fee difference.
10-year annualised returns: NDQ 21.33% versus SCHG 18.53%
| Metric | NDQ | SCHG |
|---|---|---|
| MER | 0.48% | 0.04% |
| YTD 2026 Return | ~+4.3% | ~+3.3% |
| 10-Year Annualised | 21.33% | 18.53% |
| Sharpe Ratio | 0.67 | 0.58 |
| Volatility | 4.56% | 5.26% |
| TTM Dividend Yield | 1.01% | 0.43% |
The risk-adjusted picture reinforces the point. NDQ’s Sharpe ratio of 0.67 versus SCHG’s 0.58 indicates NDQ has delivered more return per unit of risk taken. NDQ has also exhibited lower volatility (4.56% versus 5.26%), which runs counter to the assumption that higher returns require higher risk.
Shorter-period data narrows the gap. SCHG’s 3-year annualised return sits at 26.39%, and its 5-year annualised return at approximately 18.1%. Year-to-date in 2026, NDQ leads by roughly one percentage point. The 10-year figure reflects different index compositions and market conditions that may or may not persist, but it has been consistent enough to weaken any purely fee-driven case for switching.
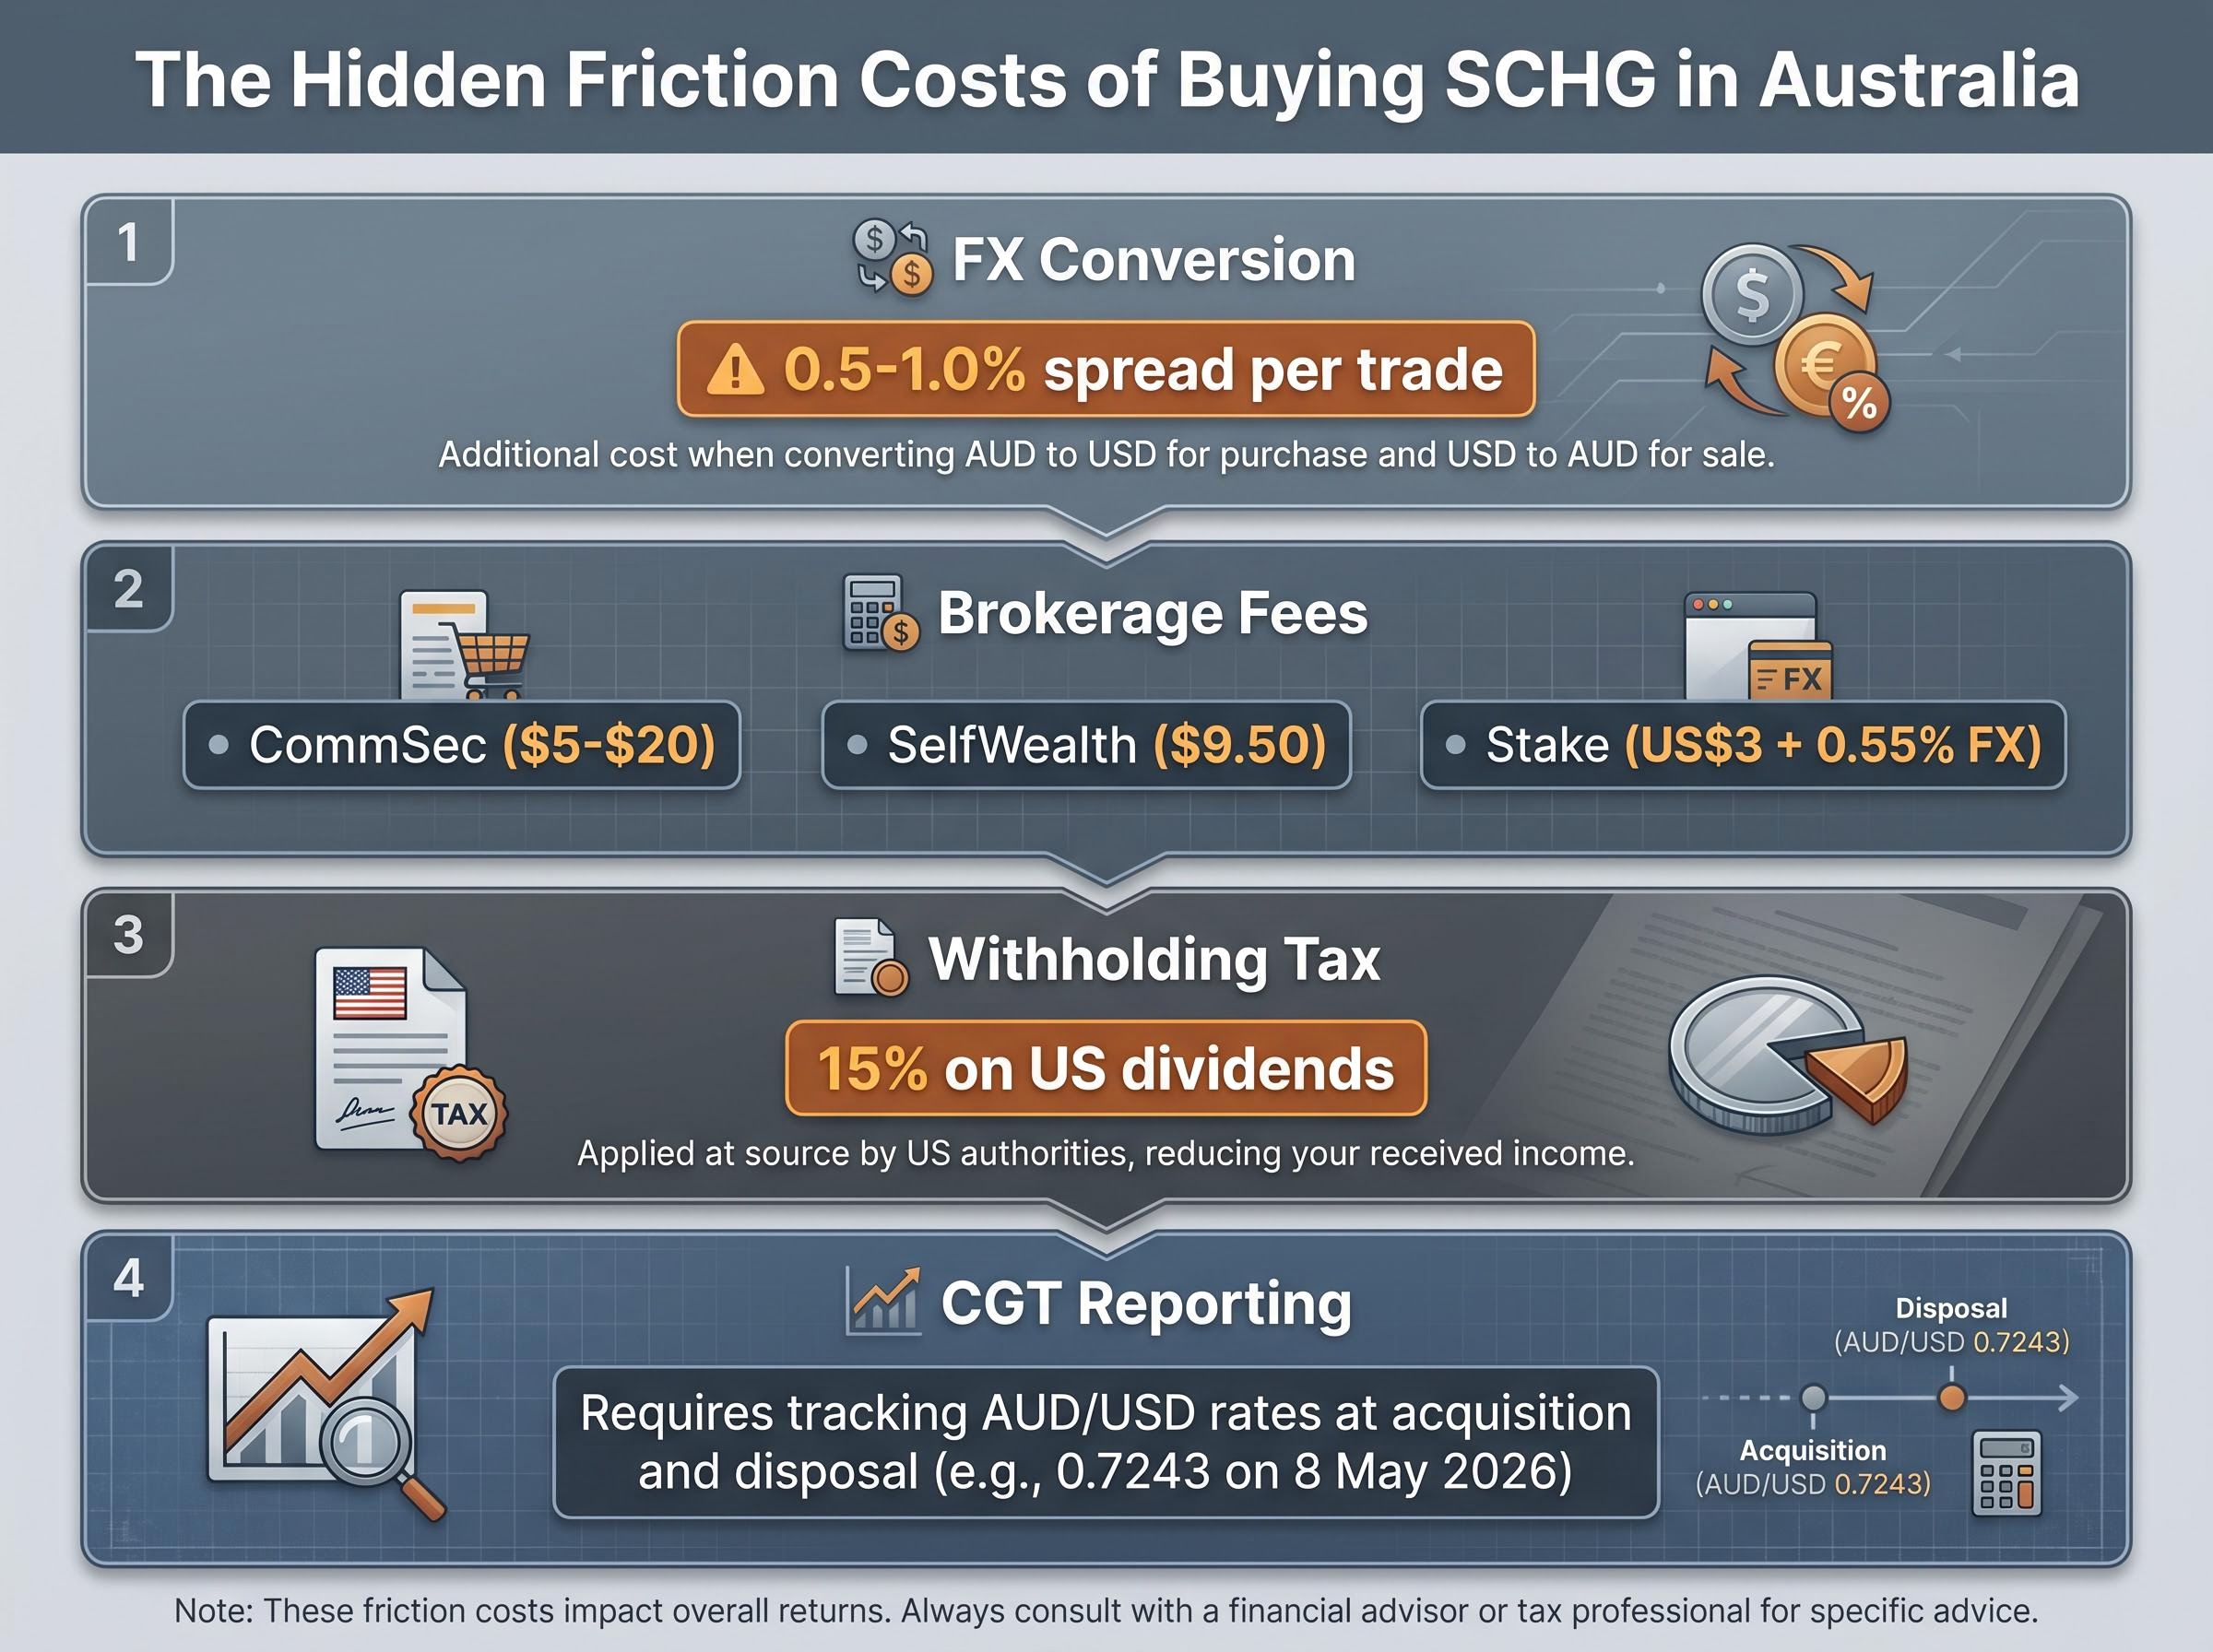
The headline fee comparison omits several friction costs that apply specifically to Australian investors buying a US-listed ETF. Each one chips away at SCHG’s apparent advantage.
The most immediate cost is foreign exchange conversion. Australian brokers typically charge a 0.5-1.0% spread on AUD/USD conversion. On a single $100,000 trade, that spread costs $500-$1,000, a figure that can equal or exceed the entire first year’s MER saving.
Brokerage fees vary by platform. CommSec charges approximately $5-$20 per US trade plus FX conversion. SelfWealth charges a $9.50 flat fee plus FX. Stake charges US$3 per trade plus a 0.55% FX fee. Interactive Brokers offers a tiered structure with competitive FX rates.
The FX cost is a one-time drag per trade rather than an annual charge. For buy-and-hold investors with large positions, it diminishes relative to the ongoing MER saving over time. For investors making smaller, more frequent purchases, the friction compounds.
US withholding tax (WHT) applies at 15% on SCHG dividends, though SCHG’s trailing twelve-month yield of just 0.43% means the absolute dollar impact is modest. Australian investors can claim a foreign tax credit through their tax return to offset this liability, but the administrative step is real.
The ATO guidance on foreign ETF tax obligations specifies that Australian investors must convert all USD-denominated gains to Australian dollars at the exchange rate applicable on both the acquisition and disposal dates, and must lodge a foreign income tax offset claim to recover withholding tax already deducted at the US source.
Capital gains tax reporting adds a further layer. Gains on SCHG are denominated in USD. The ATO requires investors to record the AUD/USD exchange rate at both acquisition and disposal (approximately 0.7243 as of 8 May 2026), then calculate gains in Australian dollars. NDQ, by contrast, trades on the ASX in AUD with no foreign income disclosure requirements.
CGT reporting for ASX ETFs is considerably simpler than the equivalent process for US-listed holdings; because ASX-listed funds like NDQ settle in AUD and are classified as Australian unit trusts, investors do not need to record foreign exchange rates at acquisition and disposal or lodge foreign income disclosures.
NDQ avoids all four of these friction costs entirely.
The right fund depends on the investor, not on a universal fee ranking. Three distinct profiles emerge from the analysis.
On a buy-and-hold basis, the break-even is straightforward: at a 0.7% FX conversion cost on $100,000, the investor pays $700 once. The annual MER saving of $440 recovers that cost within two years. For frequent small trades, the FX friction resets with each purchase and the break-even extends significantly.
The core tension in the NDQ versus SCHG comparison is that both sides of the argument are legitimate. SCHG’s fee advantage is structural and permanent: 0.04% will always be less than 0.48%. NDQ’s performance advantage is historical and may not persist, but it has been consistent: 21.33% annualised over 10 years versus 18.53%, a 2.8 percentage point gap that dwarfs the 0.44% fee difference.
For most Australian retail investors with standard brokerage access and smaller portfolios, NDQ’s simplicity, AUD settlement, and outperformance record make it a defensible choice. NDQ trades approximately 274,000 units daily on the ASX (as of 7 May 2026), confirming deep liquidity. For cost-optimising investors with larger portfolios and low-friction US market access, SCHG deserves serious consideration.
Fee competition among ASX ETF providers continues to intensify. BetaShares has not announced fee reductions or new competing low-cost Nasdaq products as of mid-2026, but investors should monitor product announcements alongside their portfolio reviews. The 0.48% NDQ fee may face downward pressure over time.
International ETF demand from Australian investors has accelerated to the point where international funds overtook domestic equities as the most purchased category on Selfwealth by Syfe in Q1 2026, a structural shift that directly explains why the question of US-listed ETF access and cost has moved from niche to mainstream.
The decision comes down to four variables:
This article is for informational purposes only and should not be considered financial advice. Investors should conduct their own research and consult with financial professionals before making investment decisions. Past performance does not guarantee future results. Financial projections are subject to market conditions and various risk factors.
NDQ is an ASX-listed ETF tracking the Nasdaq-100 Index with a 0.48% management fee, while SCHG is a US-listed ETF tracking the Dow Jones U.S. Large-Cap Growth Total Stock Market Index with a 0.04% fee. Beyond fees, they track different indexes and carry different tax and foreign exchange implications for Australian investors.
On a $100,000 portfolio, the 0.44% annual fee gap costs roughly $440 per year, and over 20 years assuming a 10% gross return, the compounding effect can result in approximately $30,000-$35,000 in foregone wealth.
Australian investors buying SCHG must account for a 0.5-1.0% AUD/USD foreign exchange conversion spread per trade, US brokerage fees, 15% withholding tax on dividends, and more complex CGT reporting requiring AUD conversion of USD-denominated gains at both acquisition and disposal dates.
Over 10 years to 30 April 2026, NDQ delivered an annualised return of 21.33% compared to SCHG's 18.53%, a 2.8 percentage point gap that is more than six times larger than the 0.44% annual fee difference between the two funds.
Investors with portfolios of $100,000 or more who already have USD cash or use a low-FX-cost platform like Interactive Brokers are best placed to benefit from SCHG, as the annual MER saving of $440 per $100,000 can exceed the one-time FX conversion cost on a buy-and-hold basis.