How HBM’s Coming Price Surge Will Cascade Through AI Supply Chains
1 hr ago

On 7 May 2026, the 10-year Treasury yield sits at 4.34%, down from a 4.44% peak on 27 March but still roughly 25 basis points above where it traded before Iran shut the Strait of Hormuz. Peace deal optimism has moved the needle. The question is how much further it can go.
Wolfe Research has published a decomposition of exactly which forces drove the 40-basis-point surge in 10-year yields since the conflict began, and the breakdown carries a pointed implication: most of what pushed yields higher will not reverse when a deal is signed. Markets are pricing nearly a 44% probability of a rate hike in 2026. Wolfe considers that excessive, but only partially. This analysis breaks down the yield decomposition, explains the mechanical distinction between a geopolitical risk premium and a growth repricing, maps the divergent TD Economics and Wolfe scenarios for where yields settle under a peace deal, and identifies what the elevated rate hike probability actually signals about Fed optionality heading into the second half of 2026.
Wolfe Research applied a sign-restriction model to daily yield movements since the Iran conflict began, isolating three discrete drivers of the total 40-basis-point rise in the 10-year yield. The decomposition does not produce a single headline. It produces a forensic account of three forces pulling in related but distinct directions.
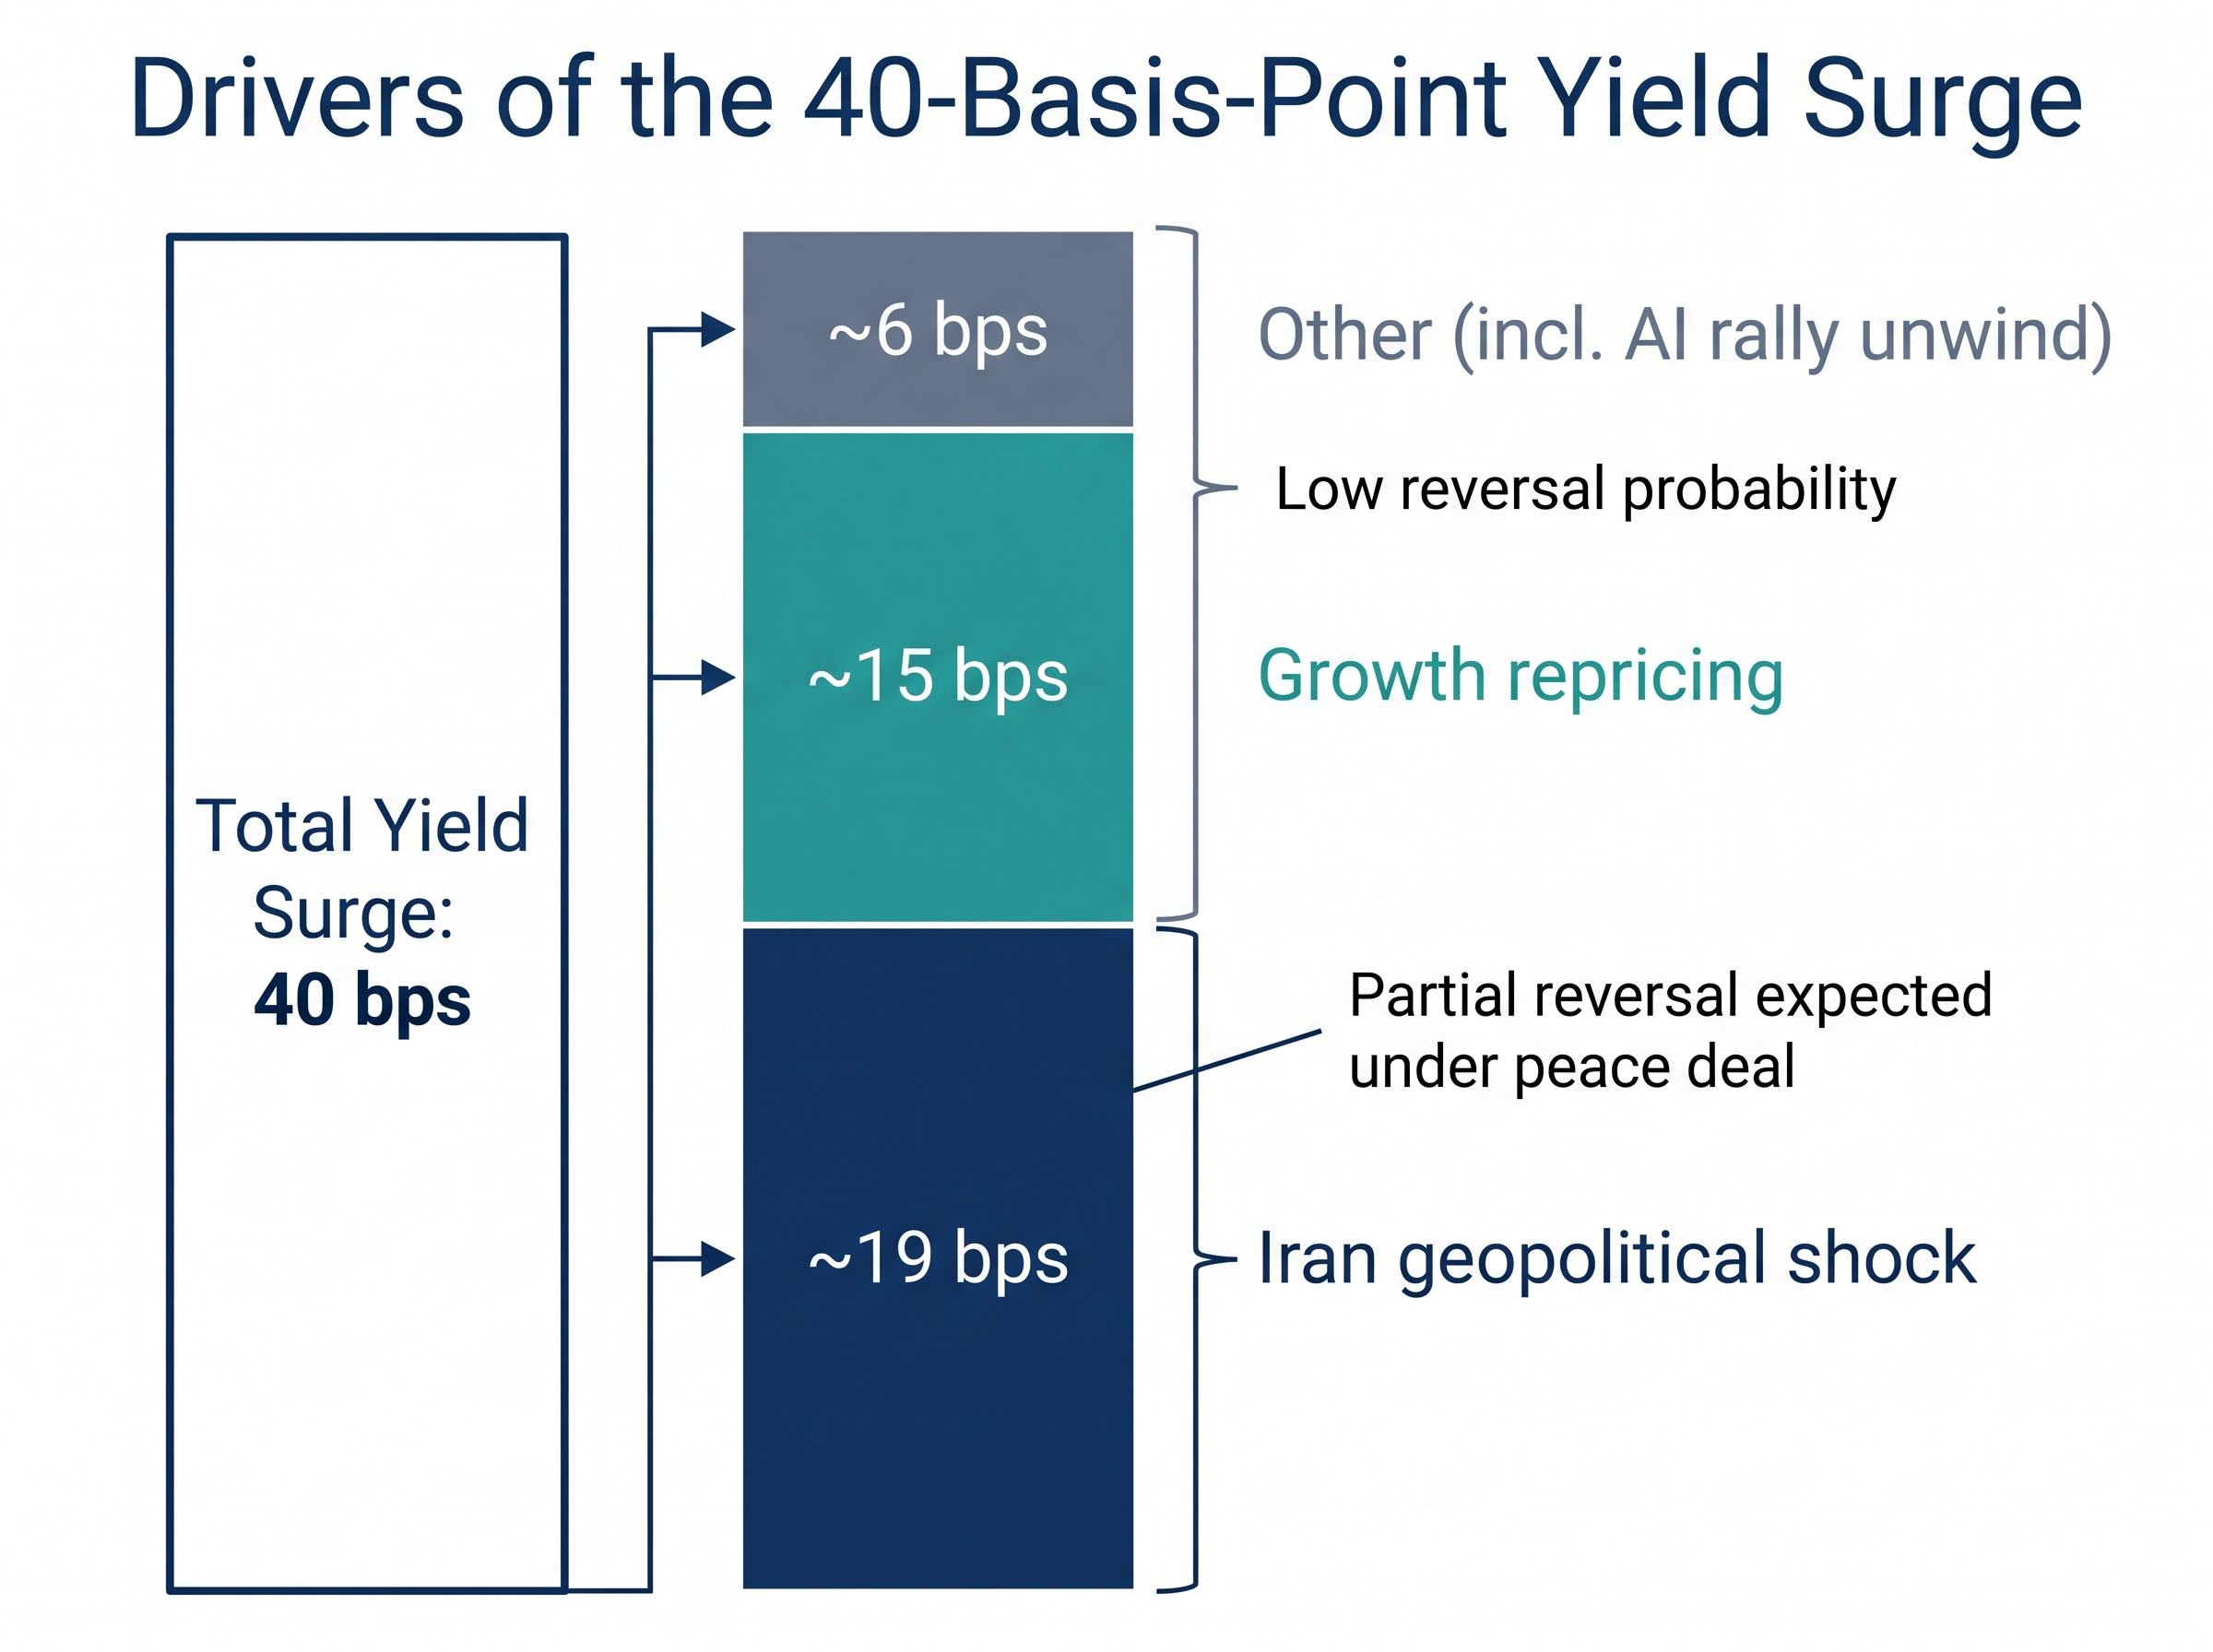
The first and most visible component: roughly 19 basis points attributed directly to the Iran geopolitical shock. This is the risk premium that markets layered onto Treasuries as the Strait of Hormuz closed in early March and oil surged past $120 per barrel.
Wolfe Research’s sign-restriction model attributes approximately 19 basis points of the total 40-basis-point yield increase to the Iran geopolitical shock, the only component with a clear reversal mechanism under a peace deal.
The second component: approximately 15 basis points driven by growth repricing. Economic data released during the conflict period came in above expectations, and bond markets responded by demanding higher compensation. This slice of the yield move has nothing to do with Iran.
The remainder falls into an “other” category that includes the unwind of February’s AI-driven rally in equities, which had briefly suppressed yields before the conflict began. This component, too, operates independently of geopolitical resolution.
The three-part split matters because each component carries an entirely different reversal probability under a peace deal.
| Driver | Basis Points Attributed | Reversal Probability Under Peace Deal |
|---|---|---|
| Iran geopolitical shock | ~19 bps | Partial (dependent on oil normalisation) |
| Growth repricing | ~15 bps | Low (stronger data does not reverse with a deal) |
| Other (incl. AI rally unwind) | ~6 bps | Low (independent of geopolitics) |
The instinct is straightforward: peace deal gets signed, risk premium unwinds, yields fall. Wolfe’s decomposition complicates that trade considerably.
Wolfe Research projects only 10-15 basis points of the conflict-driven yield increase would unwind upon a peace agreement, leaving yields in an elevated range of approximately 4.15%-4.40%. That is not a return to pre-crisis levels. It is a partial retracement with a hard ceiling.
The geopolitical risk premium’s reversal mechanism runs through oil. A peace deal eases supply fears, oil prices normalise, headline inflation expectations fall, and the inflation compensation embedded in Treasury yields compresses. The problem is that this channel is only partially transmitting as of 7 May 2026.
WTI crude settled at $95.08 per barrel on 6 May, and Brent at $106.52 per barrel. Both remain well above the pre-crisis WTI range of $72-$88. Full normalisation of the oil channel would require WTI retreating toward $80-$85, which in turn requires the Strait of Hormuz fully reopening and sustained supply certainty, neither of which is confirmed.
The growth repricing component is the structural ceiling. Stronger economic data released during the conflict period pushed 15 basis points of the yield move higher, and that data does not disappear when a peace deal is signed. GDP prints, employment figures, and consumer spending readings are not geopolitical artefacts.
Three factors prevent full yield reversion even under an optimistic peace scenario:
The Iran oil shock offers a live case study in how geopolitical events transmit into sovereign bond yields, a mechanism that operates through inflation expectations rather than credit risk.
The United States is not at default risk because of a Middle Eastern conflict. But when a supply disruption removes a significant share of global oil from the market, the resulting price spike feeds directly into headline inflation. Bond markets respond by demanding higher yields to compensate for holding fixed-rate instruments whose real purchasing power is being eroded. This is the inflation risk premium, and it is the specific channel through which geopolitics enters the Treasury market.
The Strait of Hormuz supply disruption removed approximately 13 million barrels per day from global markets at its peak, a scale that the IEA characterised as without modern parallel, which is why the inflation risk premium it injected into Treasury yields proved far stickier than a typical geopolitical flare-up would produce.
The causal chain, from resolution to yield compression, follows a specific sequence:
The 10-year yield peaked at 4.44% on 27 March 2026, nine days after the European Central Bank postponed its own rate cuts on 19 March in response to the same oil-driven inflation shock.
The ECB’s decision illustrates the global reach of the transmission mechanism. The same supply disruption, characterised as the largest oil supply disruption in modern history by several economic impact assessments, simultaneously repriced inflation expectations across sovereign bond markets in the United States and Europe. Grasping this mechanism allows investors to independently assess future geopolitical supply shocks for their yield impact, rather than waiting for sell-side analysis each time.
Market-implied probability of a Fed rate hike in 2026 has risen to approximately 44%, a level Wolfe Research characterises as elevated relative to its own base case. The number sounds alarming. What it actually reflects is more specific.
The 44% is not a modal forecast that the Fed will hike. It reflects tail-risk hedging by market participants who cannot rule out inflation re-acceleration if oil prices spike again or if core inflation proves stickier than the headline numbers suggest. Swap markets and broader consensus sources indicate near-zero probability of rate cuts in 2026, with a hold as the base case. The hike probability sits on the other tail of the same distribution.
The FOMC’s March 2026 projections show the Fed’s own median federal funds rate forecast holding steady through the year, providing the baseline against which the 44% market-implied hike probability represents a meaningful deviation rather than a consensus view.
Wolfe’s view is that this probability is excessive and that a durable peace deal could serve as the catalyst for some of it to unwind. TD Economics takes a more expansive position: under a sustained peace scenario with WTI retreating below $100 per barrel, rate cuts become possible in Q4 2026.
The Wall Street rate cut consensus hardened sharply in early May 2026, with Barclays, Goldman Sachs, JPMorgan, Morgan Stanley, and Deutsche Bank independently converging on no 2026 cuts within a two-week window, a rare simultaneous revision that reinforces why the swap market’s hold assumption looks durable.
| Scenario | 10Y Yield Year-End Target | Fed Path | Key Assumption |
|---|---|---|---|
| TD Economics (peace) | ~4.10% | Rate cuts possible Q4 2026 | WTI below $100; durable peace |
| Wolfe Research | 4.15%-4.40% | Hold; hike probability fades | Partial oil normalisation; inflation persistence |
| Swap market consensus | ~4.30%+ | Hold through 2026 | No cuts priced; status quo |
The 44% functions as a sentiment indicator as much as a forecast. If it fades toward 20%-25% on peace deal confirmation, that compression itself becomes a tradeable signal that the risk premium is unwinding.
The disagreement between TD Economics and Wolfe Research is not a contradiction to resolve. It is a map of the outcome distribution under different assumptions about deal durability.
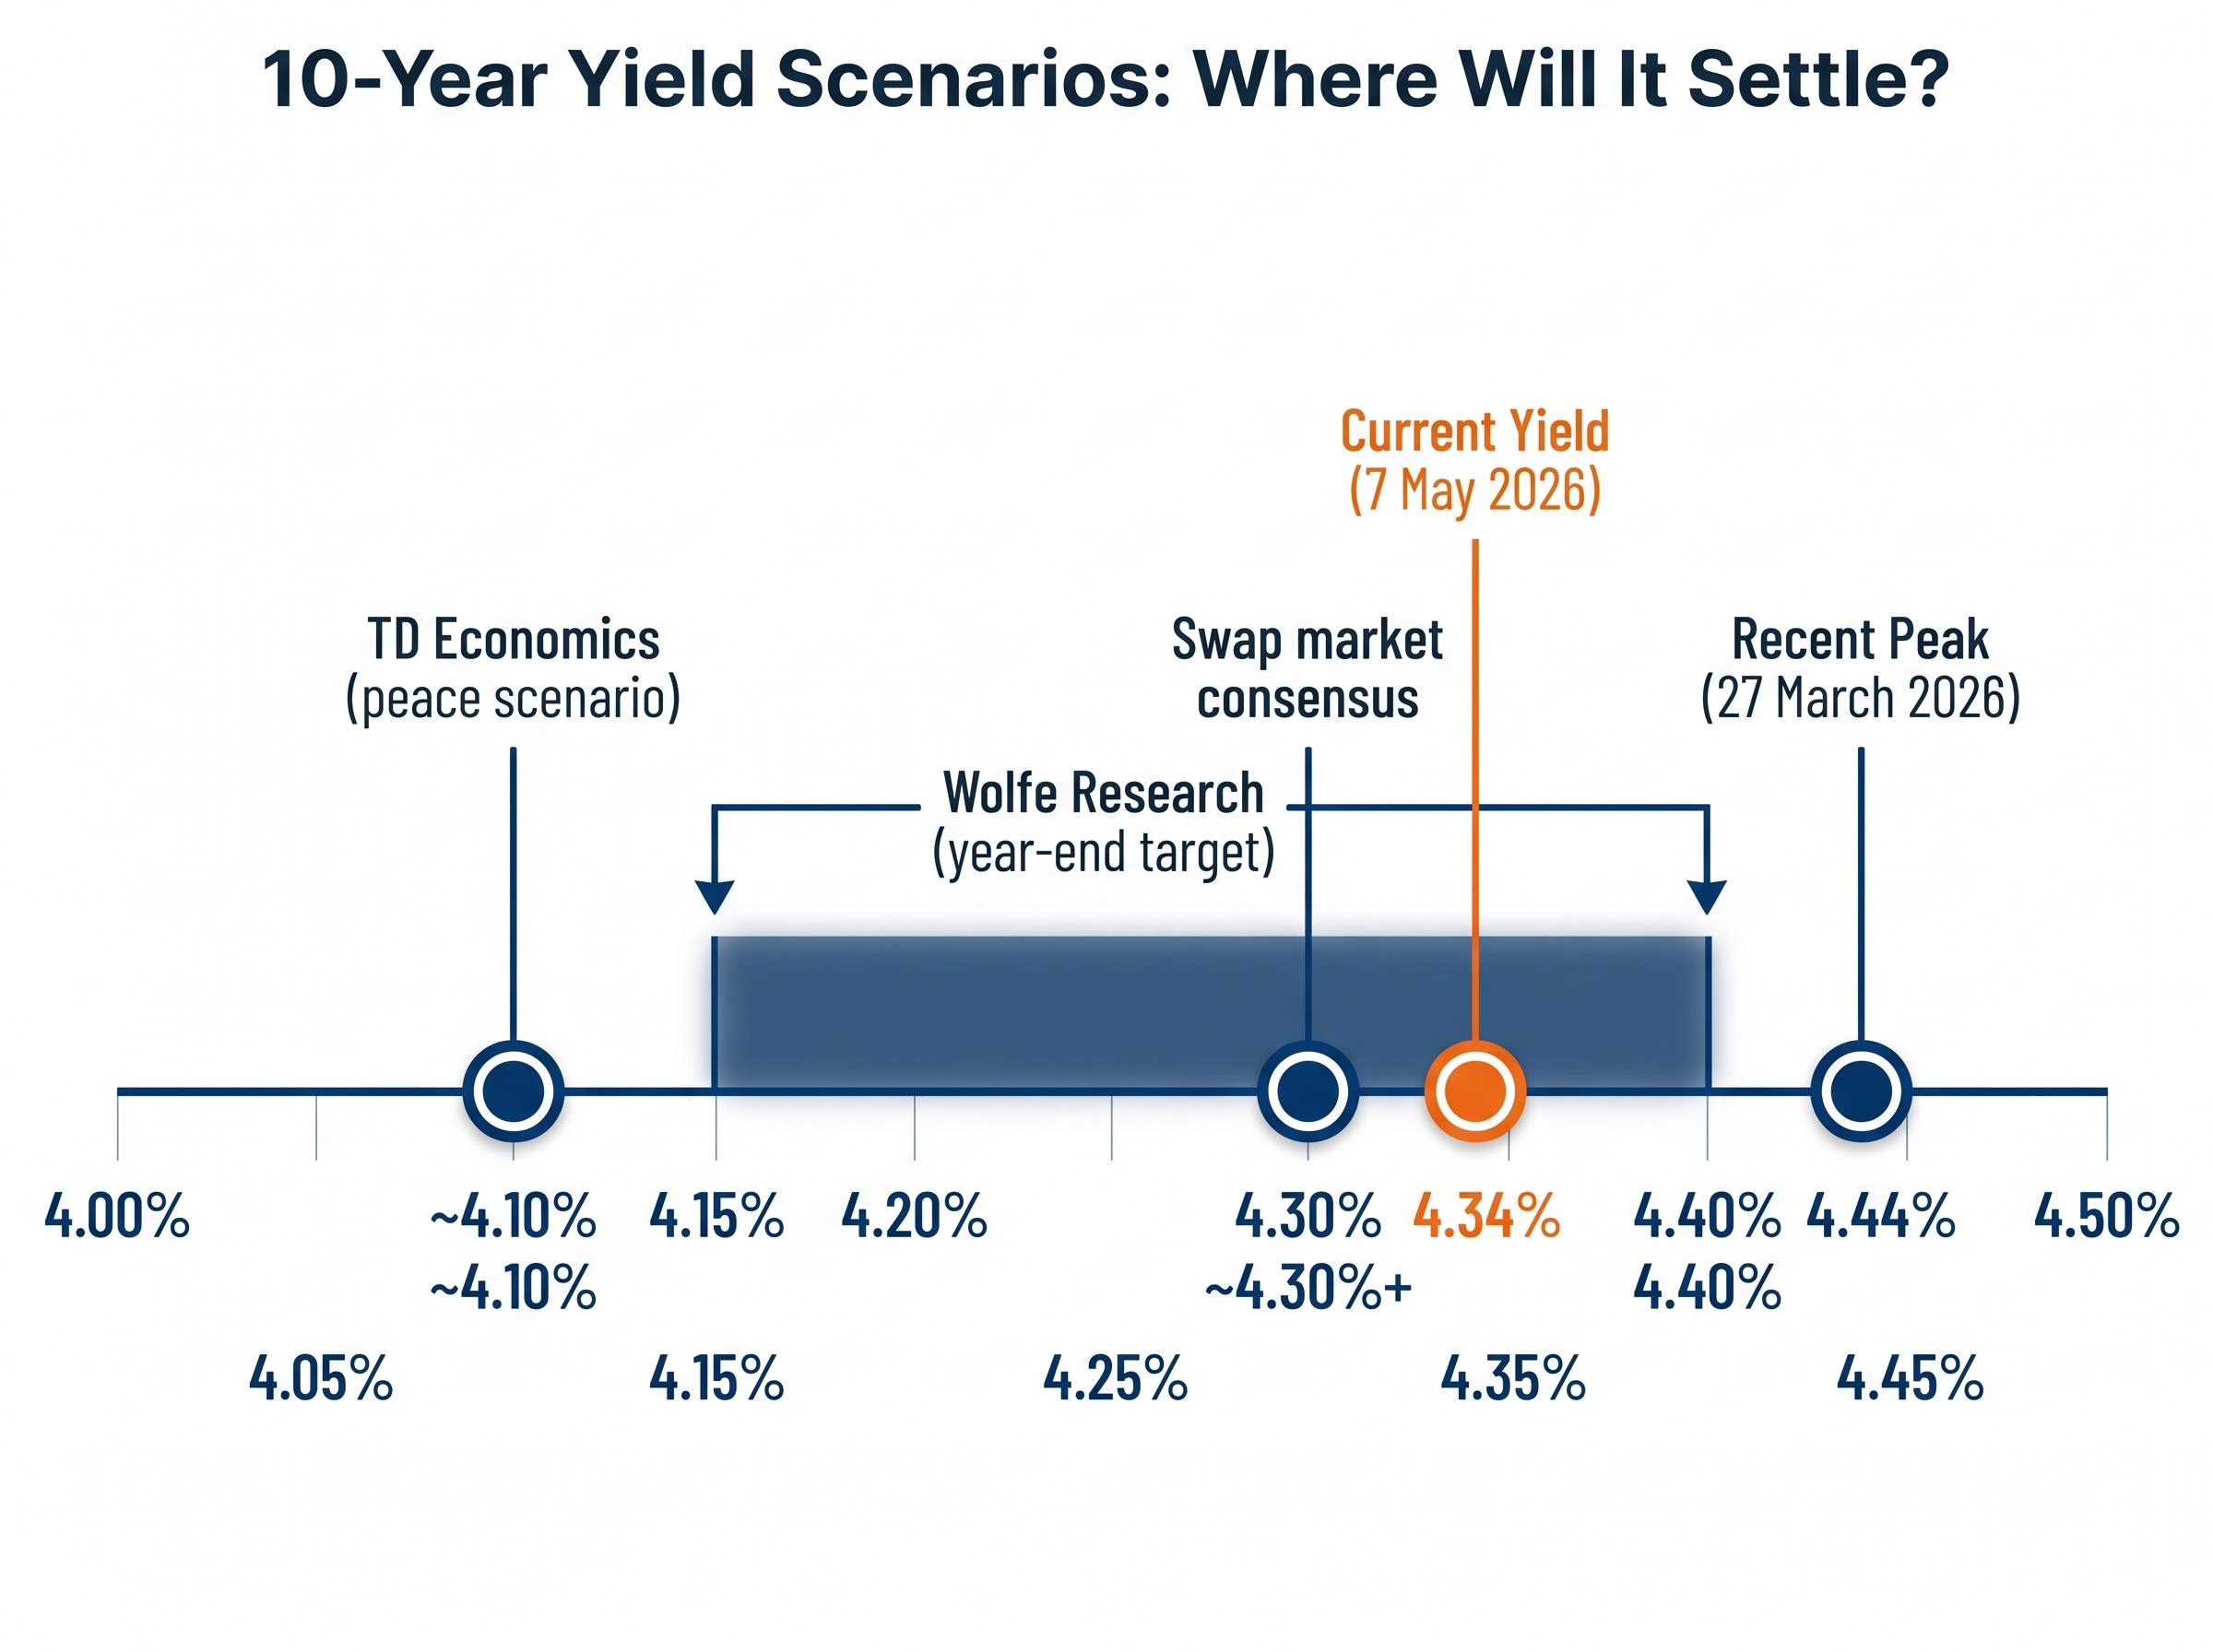
TD Economics, in its 16 April 2026 report on the central bank calculus of the Iran oil shock, projects that under a durable peace deal, 10-year yields drift toward approximately 4.10% by year-end 2026. The mechanism is the full unwinding of the inflation premium over two to three quarters as oil normalises and the Fed gains flexibility to cut rates in Q4.
TD Economics frames a durable peace deal as opening a narrow window for Q4 2026 rate cuts, contingent on oil normalisation below $100 per barrel.
Markets have interpreted Kevin Warsh’s candidacy for Fed Chair, with Senate confirmation proceedings ongoing as of May 2026, as mildly dovish in the current environment. If confirmed, his leadership could reinforce the TD cut scenario, though this characterisation is not a consensus view.
Wolfe’s counterargument rests on forces that operate independently of any peace deal. Structural fiscal pressures on Treasury supply, including elevated deficit financing and the repricing of term premium that has been underway since 2024, persist regardless of whether the Strait of Hormuz reopens. Core inflation persistence, even if headline CPI responds to falling oil, further supports Wolfe’s view that yields are unlikely to fall as aggressively as TD projects.
Wolfe’s year-end range of 4.15%-4.40% implies only modest downside from the current 4.34%. TD’s 4.10% target implies roughly 25 basis points of potential compression. Both views can be simultaneously correct: TD’s scenario requires a fully durable peace deal with complete oil normalisation, while Wolfe’s reflects the stickier structural realities that sit beneath the geopolitical layer.
Morningstar’s fixed income scenario analysis of the oil shock identifies the duration of the Strait of Hormuz supply disruption as the single variable determining bond portfolio outcomes across all three scenarios, a framing that maps directly onto the TD-Wolfe divergence: TD’s cut path requires a short disruption, Wolfe’s sticky floor assumes a prolonged one.
Under TD’s escalation scenario, where peace talks collapse and WTI returns toward $128 per barrel, yields remain elevated at 4.30%+ through mid-2027.
The analytical framework built across this analysis converts into a specific monitoring checklist. Three observable signals will confirm or deny whether the peace-deal yield trade has further to run:
The current 4.34% level (down from 4.45% on 4 May) reflects partial peace deal optimism but not a completed transmission through oil normalisation and inflation expectations. It is a holding pattern.
Three independent risk channels could prevent further yield compression, each operating on a different timeline. Ceasefire collapse is event-driven and fast; a second Strait of Hormuz incident would reprice yields within sessions. Core inflation persistence, even with oil normalisation, plays out over quarters and would become visible in CPI data through the second half of 2026. Fiscal and supply dynamics in the Treasury market are structural and slow-moving, but they represent the floor beneath which yields are unlikely to fall regardless of geopolitical outcomes.
The Wolfe decomposition delivers a specific, quantified finding: of the 40 basis points the 10-year yield gained during the Iran conflict, only 10-15 basis points are plausibly reversible under a peace deal. The growth repricing and structural components are sticky.
The TD-Wolfe range defines the practical outcome band investors should be modelling: roughly 4.10%-4.40% for year-end 2026, with the exact landing point determined by oil normalisation speed, inflation trajectory, and the fiscal dynamics that predate the conflict entirely. That is a narrower range than peace-deal headlines imply.
The live signal is the 44% rate hike probability. If it fades toward 20%-25% on deal confirmation, the risk premium unwind Wolfe anticipates is underway. If it holds, the market is telling investors that the inflation tail risk has not been resolved. The CME FedWatch Tool, WTI price, and the next CPI release are the three instruments that will confirm or deny whether this trade has further to run.
Investors who find themselves tempted to reposition ahead of each peace deal headline will find our comprehensive walkthrough of geopolitical risk investing useful: it draws on behavioural research showing that retail investors who trade most actively around conflict events consistently underperform buy-and-hold strategies, and maps the Goldman Sachs, Morgan Stanley, and Schwab consensus on what disciplined positioning actually looks like.
This article is for informational purposes only and should not be considered financial advice. Investors should conduct their own research and consult with financial professionals before making investment decisions. Financial projections referenced are subject to market conditions and various risk factors, and past performance does not guarantee future results.
The 10-year Treasury yield is the annualised return investors earn on US government bonds maturing in ten years, and it serves as a global benchmark for borrowing costs, mortgage rates, and equity valuations, making it one of the most closely watched indicators in financial markets.
Wolfe Research's decomposition attributes the 40-basis-point surge to three forces: roughly 19 basis points from the Iran geopolitical shock and its oil price impact, approximately 15 basis points from stronger-than-expected economic data, and around 6 basis points from the unwind of a prior AI-driven equity rally that had briefly suppressed yields.
Wolfe Research projects only 10-15 basis points of the conflict-driven yield increase would unwind under a peace agreement, leaving yields in a range of approximately 4.15%-4.40%, because the growth repricing and structural components of the yield move are not geopolitical in origin and will not reverse with a deal.
The 44% market-implied rate hike probability reflects tail-risk hedging by investors who cannot rule out inflation re-acceleration if oil prices spike again or core inflation proves sticky, rather than a consensus forecast that the Fed will actually hike; the base case across swap markets and major banks remains a hold through 2026.
The three key signals are the WTI crude price trajectory toward the $80-$85 range needed for full oil normalisation, headline CPI prints confirming that energy cost declines are feeding through to lower inflation readings, and the CME FedWatch rate hike probability declining from 44% toward the 20%-25% range that would indicate the risk premium is genuinely unwinding.