
Delivery Hero Shareholders Reject Uber’s €33 Bid, Demand €40+
2 hrs ago
Analysts forecast $150 to $200 per barrel. The Strait of Hormuz has been closed since 28 February 2026, eliminating more than 15% of global oil supply in a single stroke. Yet Brent crude, after peaking at $126.41 on 30 April, is trading near $108 today. The gap between forecast and reality is not a modelling failure. It reflects a specific set of cushioning mechanisms operating simultaneously, mechanisms that are capacity-constrained, partially temporary, and poorly understood even by professional market participants. What follows is an analysis of why the worst supply disruption in oil market history has not produced the price catastrophe the models predicted, what the futures curve reveals about how traders are pricing the disruption’s duration, and where the fragility points sit for investors pricing commodity risk in 2026.
The scale of the Hormuz closure defies easy comparison. No prior supply shock, not the 1973 Arab oil embargo, not the 1990 Iraqi invasion of Kuwait, not the 2019 Abqaiq attack, removed this volume from the market in a single event.
“The Strait of Hormuz closure constitutes the largest supply disruption the oil market has ever experienced.” — Yardeni Research
Analyst forecasts of $150-$200 per barrel were not reckless. They were reasonable extrapolations from historical supply-shock models applied to a disruption of unprecedented magnitude. The actual trajectory told a different story. Brent peaked at $126.41 on 30 April, then pulled back to approximately $108 by 4 May. That is a severe price elevation by any normal standard, yet it sits $42-$92 below the extreme scenarios. The puzzle is real: something is absorbing the shock.
Yardeni Research identified six mitigation factors that, taken together, form a layered insulation system against the full force of the supply loss. None of them is sufficient alone. Their combined effect explains the price ceiling the market has observed so far.
| Factor | Mechanism | Current limitation |
|---|---|---|
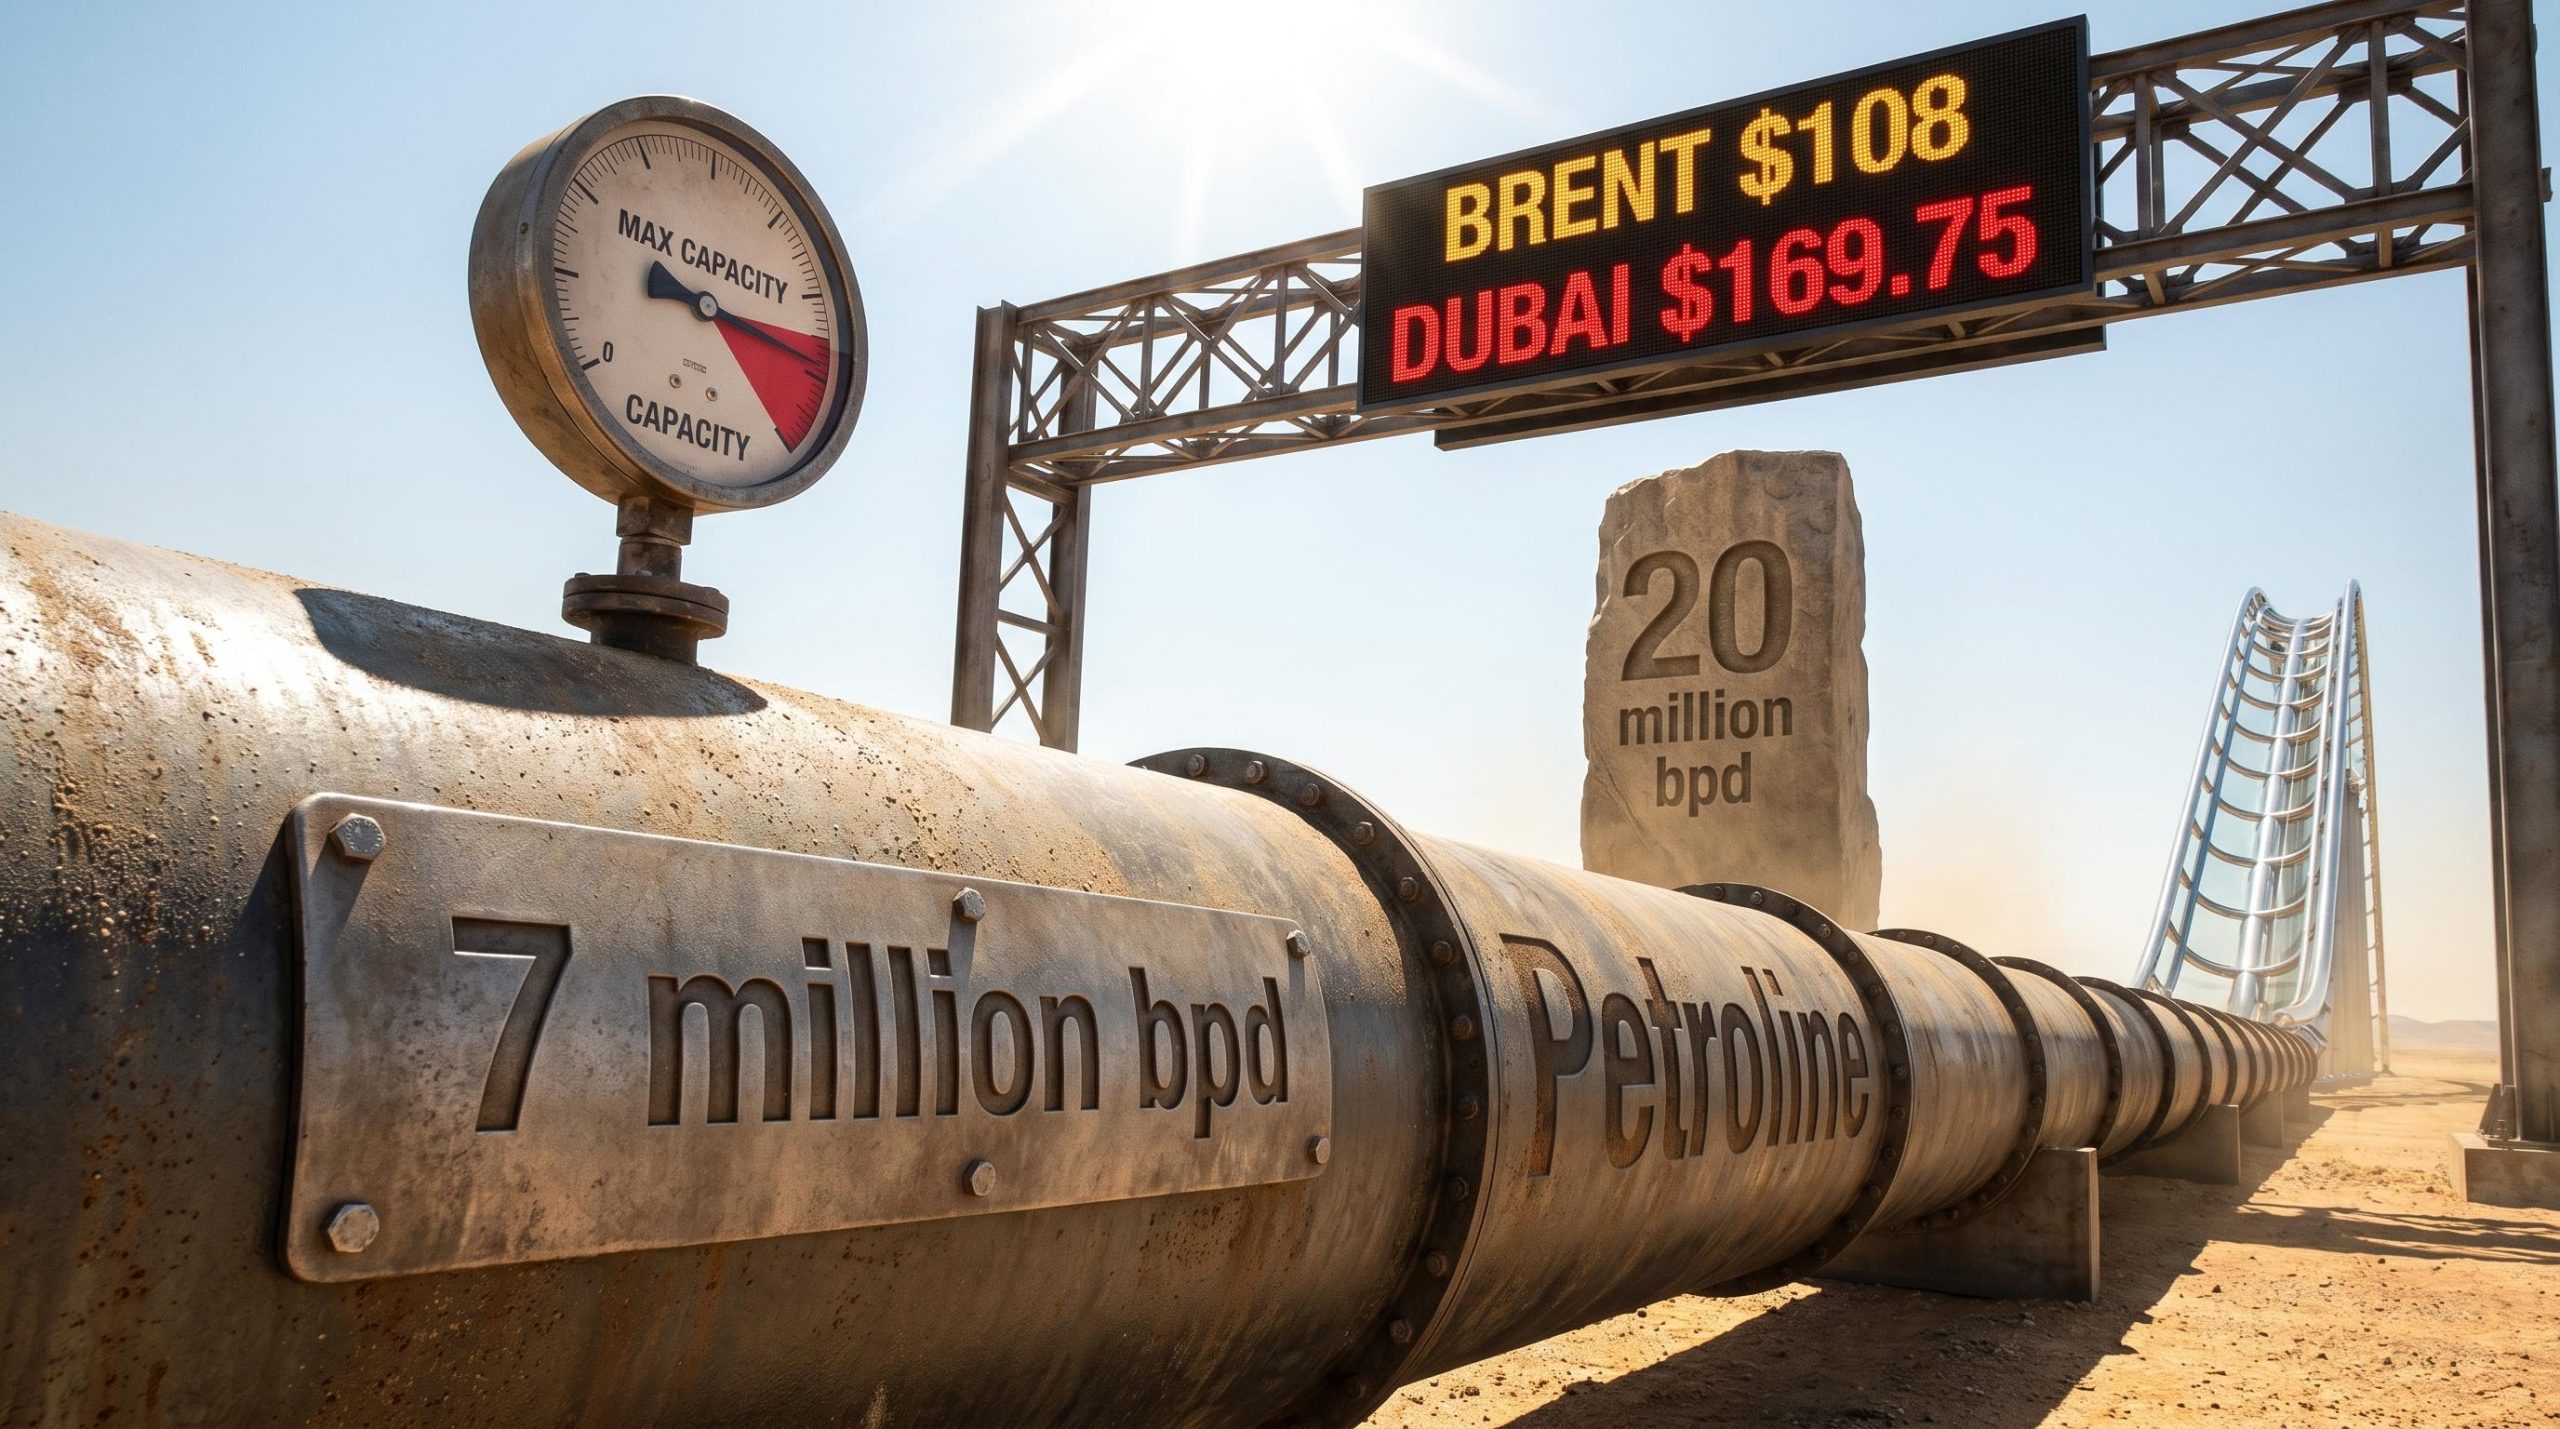
| Pipeline rerouting (Petroline) | Saudi East-West Pipeline bypasses the strait entirely | Maxed out at 7 million bpd; no further headroom |
| UAE pipeline (ADCOP) | Supplementary bypass route for UAE crude | Limited capacity; combined rerouting far short of 20 million bpd |
| IEA strategic reserve releases | Coordinated drawdowns from member-nation stockpiles | Finite reserves; drawdown pace unsustainable beyond months |
| Iranian and Russian supply waivers | Sanctions relief enabling additional barrels to market | Politically contingent; can be reversed |
| Chinese stockpile resales | China releasing strategic petroleum reserves into Asian markets | One-time inventory release; depletes over time |
| Demand destruction | High prices reduce consumption, providing a self-correcting mechanism | IEA projects global oil consumption shrinking by 80,000 bpd in 2026 |
The Petroline is running at its full operational capacity of 7 million bpd. The UAE’s Abu Dhabi Crude Oil Pipeline (ADCOP) provides supplementary throughput. Combined, the two pipelines absorb a fraction of the 20 million bpd the strait previously carried. The gap, 13 million bpd or more, must be addressed by the remaining four factors.
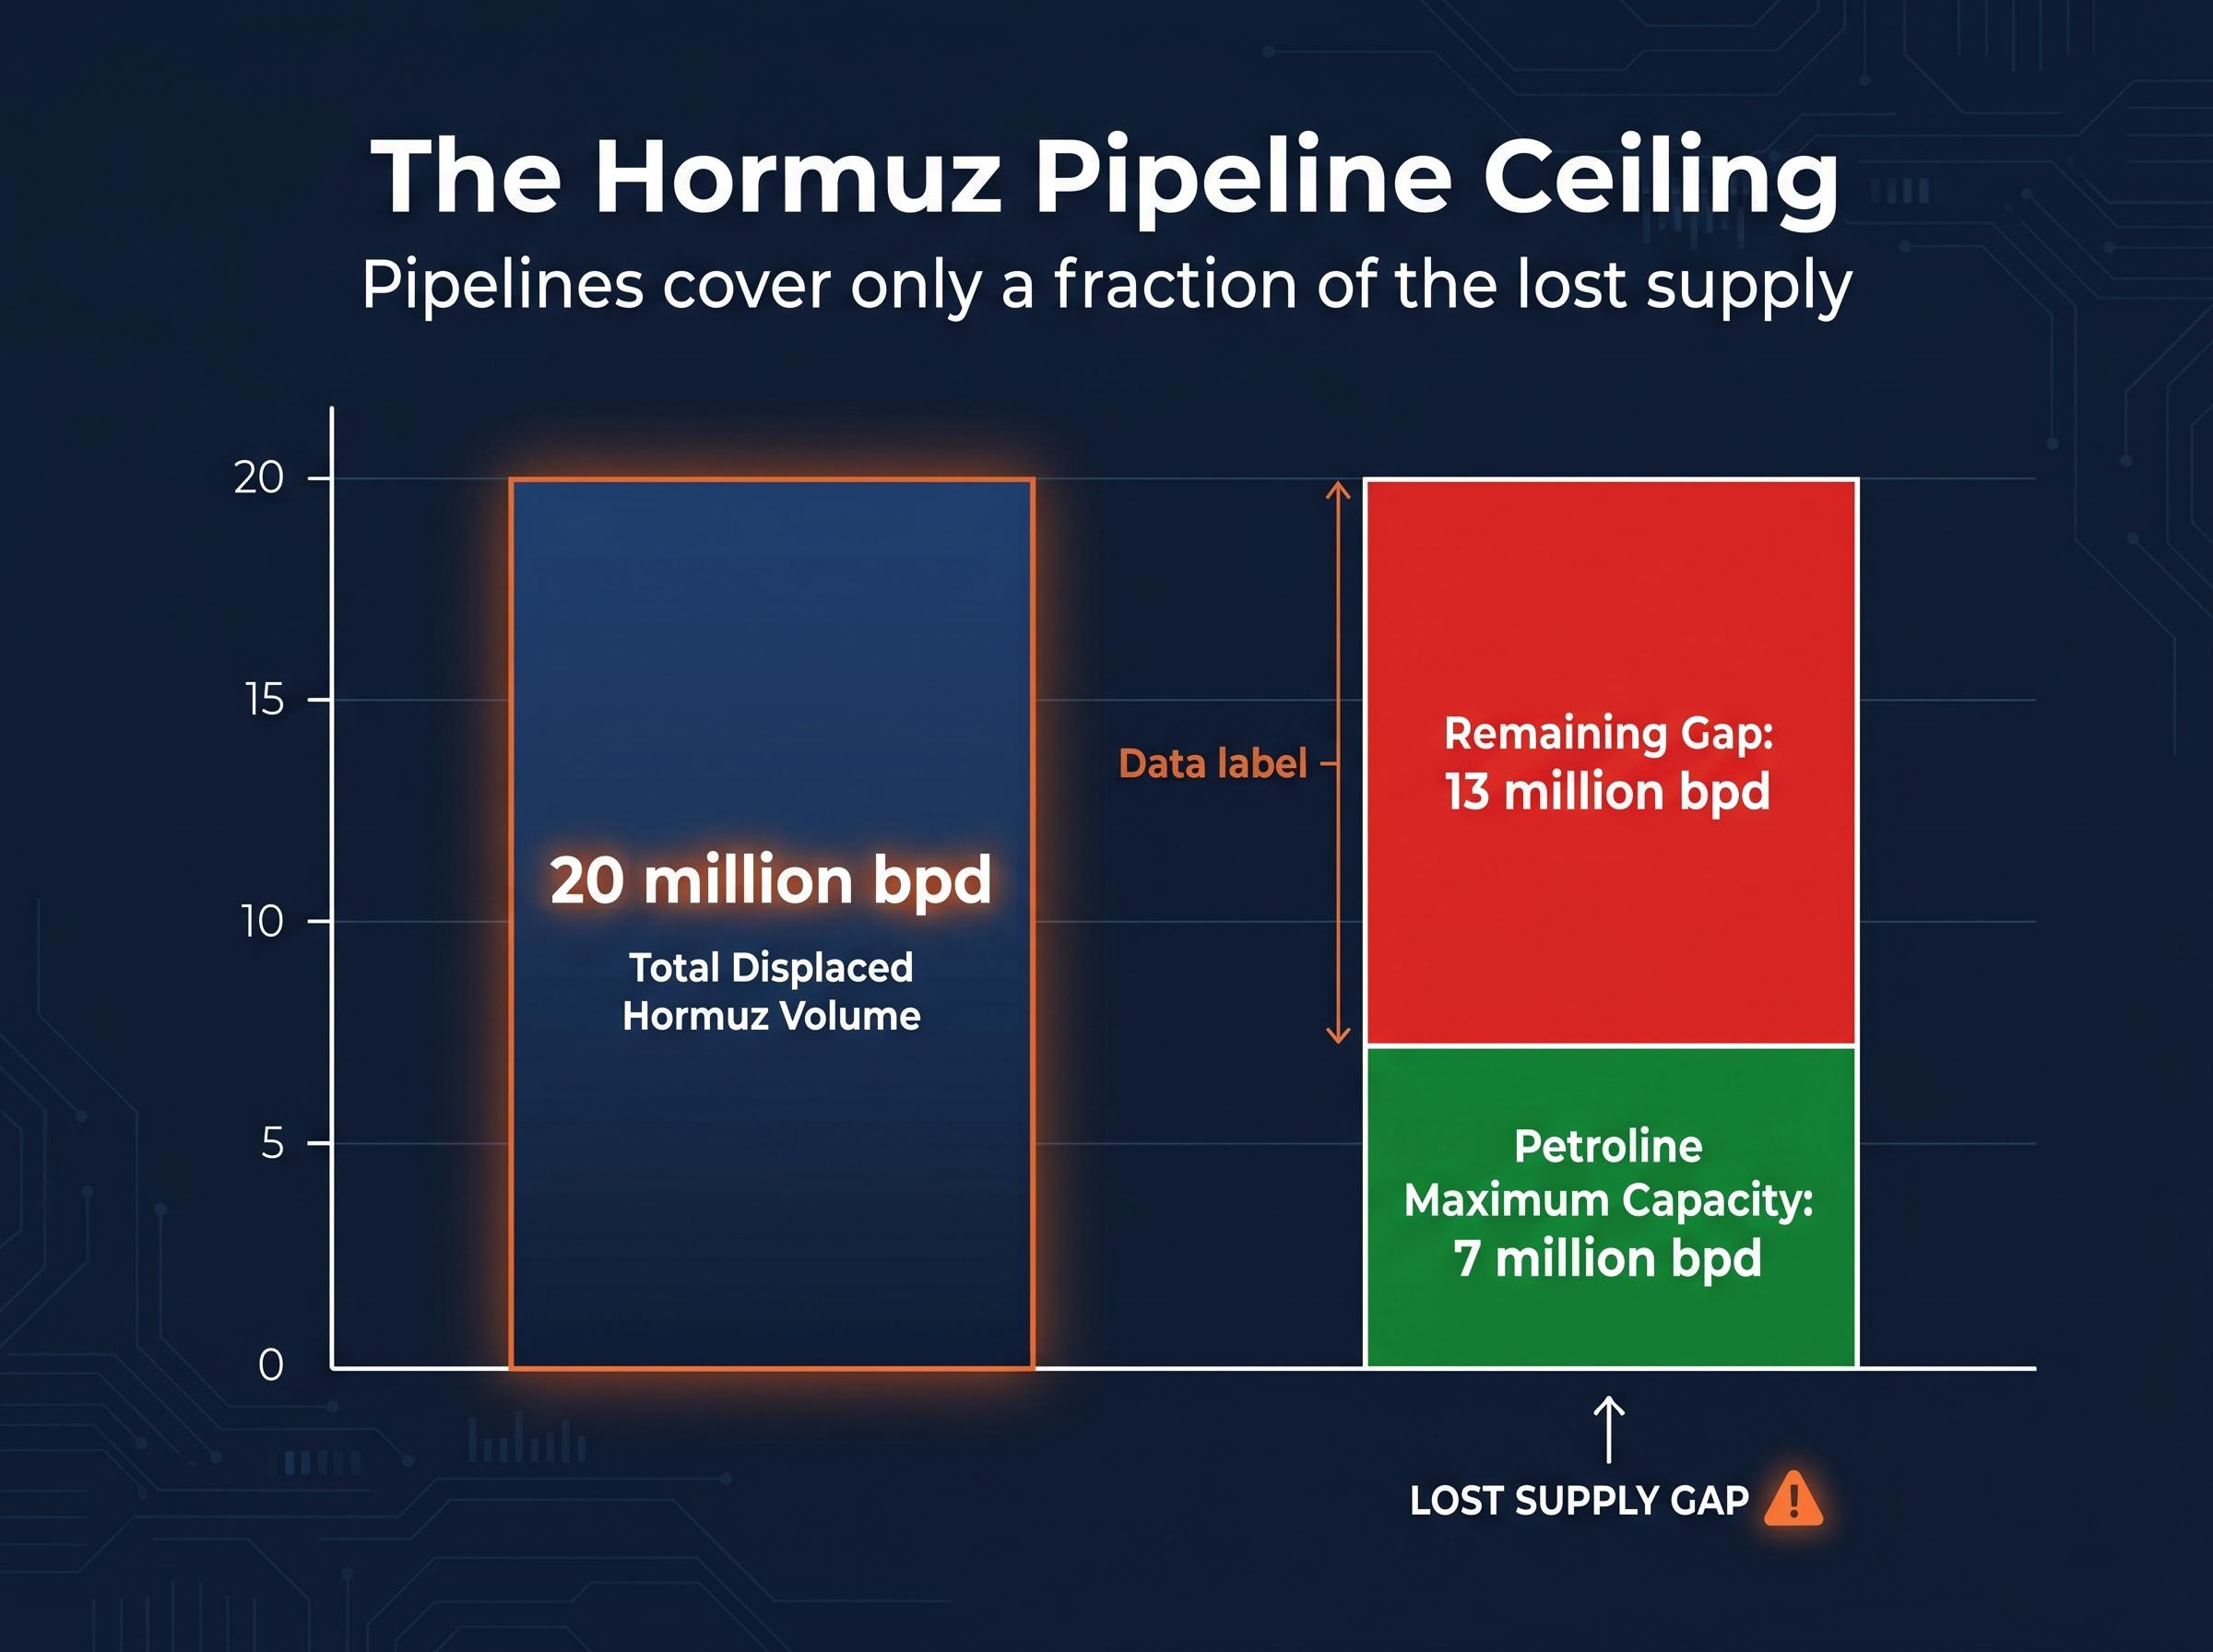
There is no additional pipeline headroom. This ceiling is physical, not political.
The physical rerouting constraint is compounded by a parallel mechanism that receives less coverage: the near-total withdrawal of commercial war risk insurance from Hormuz-transiting vessels, a maritime insurance collapse that prevents commercial operators from resuming transit even in the absence of a formal military blockade.
The IEA’s coordinated reserve releases, Iranian and Russian supply waivers, and Chinese stockpile resales collectively fill a portion of the non-pipeline gap. Each is finite or politically contingent.
The demand destruction channel operates differently. At sustained prices above $100, consumption contracts as transport costs rise, industrial users defer discretionary energy purchases, and fuel switching accelerates where infrastructure permits. The IEA projects this effect will shrink global oil consumption by 80,000 bpd in 2026. Energy intensity per unit of GDP has also declined structurally since the 1970s oil shocks, meaning each dollar of economic output requires less oil than it did during prior disruptions.
That structural decline is durable. The reserve releases are not.
For investors assessing commodity exposure, the shape of the oil futures curve communicates more about collective market judgment than the spot price headline. Oil futures are currently trading in steep backwardation, according to Yardeni Research. Understanding what that shape signals requires a three-step reading:
The ceasefire announced on 7-8 April reduced escalation risk but did not restore supply flows. Brent continued rising after the ceasefire, reaching $126.41 on 30 April before pulling back to approximately $108 by 4 May. The futures curve’s shape reflects this distinction: traders are pricing the disruption as severe but bounded in duration, not as a permanent structural shift.
Goldman Sachs’ base case projects Brent at approximately $90 per barrel if normalisation occurs by end-June or end-July 2026.
The institutional forecast divergence between Goldman Sachs and JPMorgan, separated by approximately $30 per barrel on their year-end Brent projections, reflects a fundamental disagreement about whether the current disruption is a temporary dislocation or a multi-quarter structural feature, a distinction that carries materially different implications for hedging duration and commodity fund positioning.
The Energy Information Administration (EIA) raised its 2026 Brent forecast to an average of $103 per barrel, a figure that sits between the current spot level and the Goldman normalisation scenario. The gap between these forecasts and current spot prices is the backwardation made visible.
The EIA Short-Term Energy Outlook raised its 2026 Brent forecast to an average of $103 per barrel, a projection that sits between current spot levels and the Goldman normalisation scenario and reflects the agency’s base-case assumption that some supply restoration occurs within the forecast window.
The supply-side mechanics explain why prices are where they are. The macroeconomic modelling explains why those prices matter beyond the commodity itself.
Wood Mackenzie’s tiered impact analysis quantifies the stakes at each sustained price level:
| Sustained Brent price level | Macro impact |
|---|---|
| Above $90/bbl | Global GDP growth slows to 1.7% (from 2.5% pre-disruption baseline) |
| Sustained $100/bbl | Risks tipping the U.S. and EU into recession |
| $200/bbl | Global economic contraction of approximately -0.5% |
At current levels near $108, the world economy sits in the zone between growth deceleration and recession risk. The IEA reported that crude oil stocks in Asia dropped by 31 million barrels, with further declines projected. Yardeni Research forecasts Brent in the range of $85-$100 per barrel for the remainder of 2026, a level that implies persistent growth headwinds without full recession.
Oil price recession transmission operates through four simultaneous channels — reduced consumer disposable income, rising business input costs, Federal Reserve rate pressure, and an investment and hiring pullback — with Moody’s Analytics placing the 12-month US recession probability at 48.6% as of late April, a figure that contextualises Wood Mackenzie’s tiered GDP impact modelling.
Demand destruction, the self-correcting mechanism that moderates prices, simultaneously operates as a growth headwind. The very process that prevents Brent from reaching $150 is the process that slows economic output.
The traditional policy response to an energy-driven inflation spike is monetary tightening. Yardeni Research identifies why that response is absent from the current consensus: long-term inflation expectations remain anchored and wage-price spiral risk is low. The conditions that forced aggressive rate hikes during the 1970s oil shocks, when inflation expectations became unmoored and wages chased prices upward, have not materialised. Rate hikes into a supply-driven shock risk deepening a recession without addressing the underlying cause.
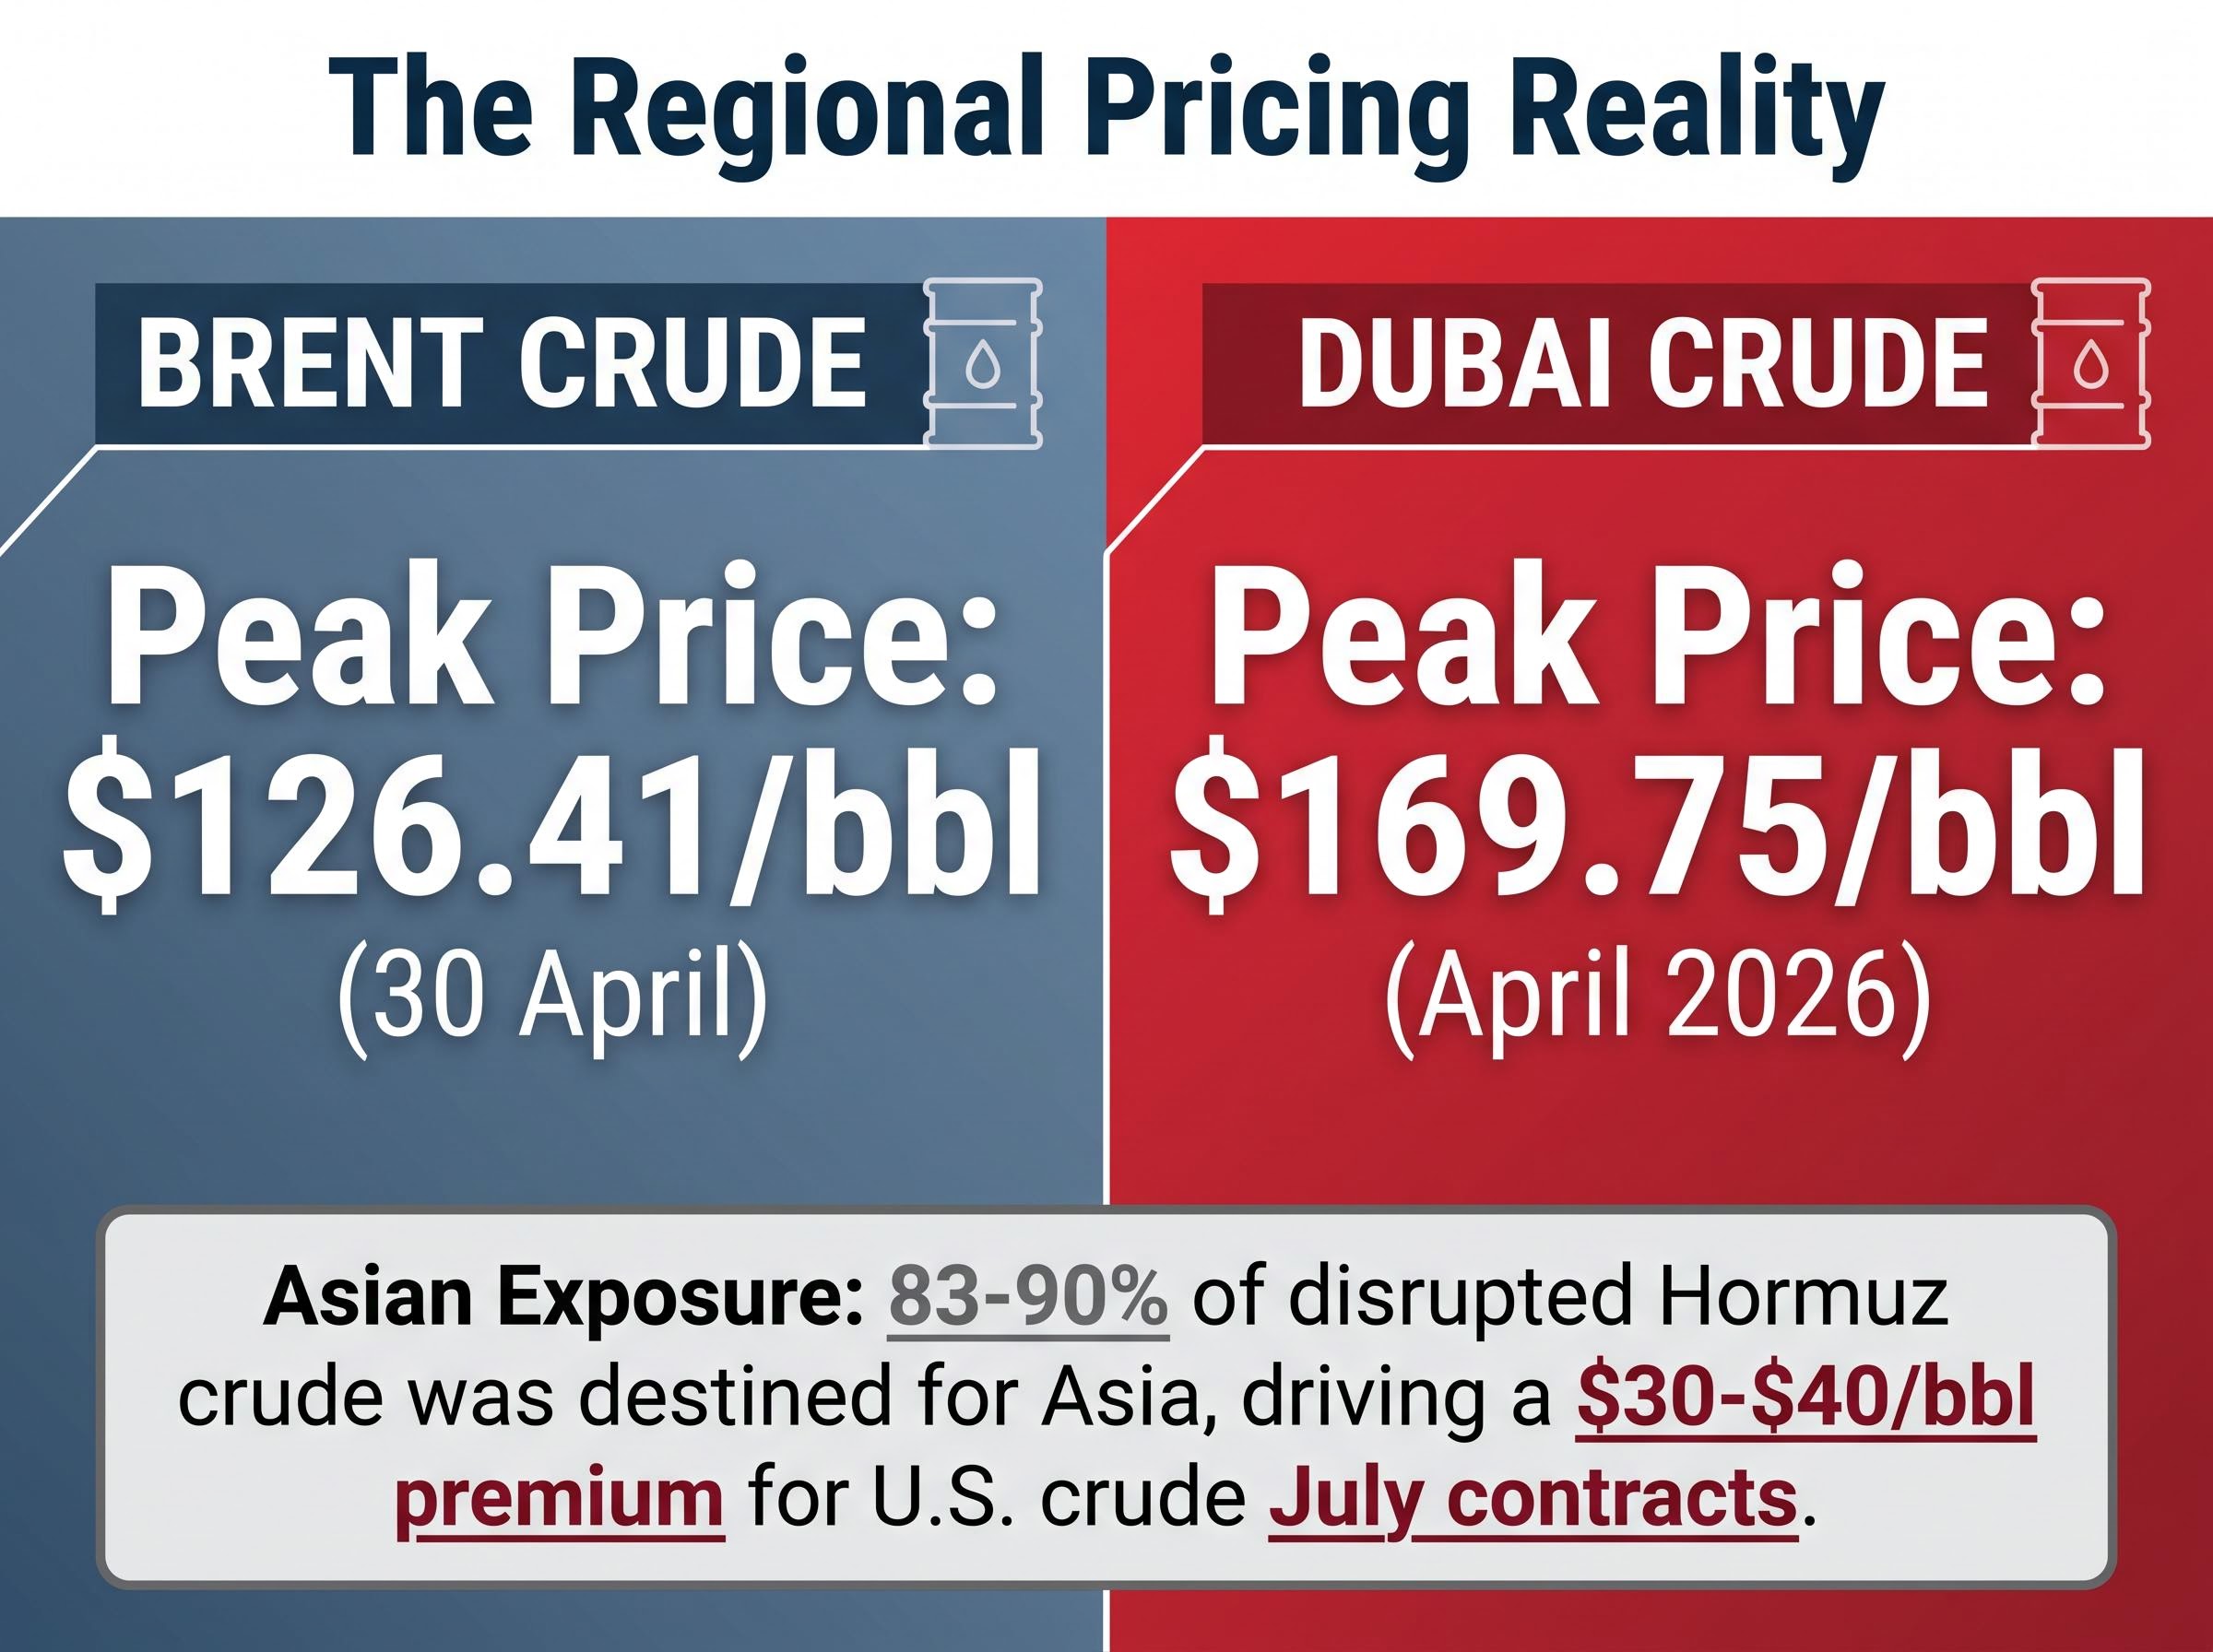
The $108 headline is a North Sea benchmark. It reflects the price of oil delivered from fields and routes that were never directly dependent on the Strait of Hormuz. For the buyers who were dependent on those routes, the crisis looks far more severe.
Approximately 83-90% of crude previously transiting the Hormuz strait was destined for Asian buyers. When that volume disappeared, Asian spot markets bore the concentrated impact.
| Benchmark / reference | Peak price during disruption | Implication for Asian buyers |
|---|---|---|
| Brent crude | $126.41/bbl (30 April) | Understates Asian procurement cost |
| Dubai crude | $169.75/bbl (April 2026) | Reflects actual Asian supply dislocation severity |
| U.S. crude (Asian delivery) | $30-$40/bbl premium for July contracts | Competitive bidding for non-Hormuz barrels |
Dubai crude peaked at $169.75 per barrel in April 2026, according to Yardeni Research, a price point that reframes the apparent moderation of the Brent benchmark.
Asian crude spot liquidity has largely evaporated. Buyers in Japan, South Korea, India, and China are competing aggressively for every available non-Hormuz cargo, driving premiums to levels that the Brent headline systematically obscures. For investors and corporates with Asian supply chain exposure, the gap between benchmark and delivered price represents a material financial risk that the $108 figure does not capture.
The cushioning mechanisms are real, but they are operating at or near capacity. Identifying the conditions under which they fail is as important as understanding why they have held so far.
Goldman Sachs’ prolonged disruption scenario projects Brent averaging over $100 through end-2026 if normalisation is delayed beyond end-July. The adverse scenario reaches up to $120 per barrel. ING raised its forecasts substantially on 28 April 2026 for prolonged disruption conditions.
Goldman Sachs’ adverse scenario projects Brent at up to $120 per barrel, a level at which the macro consequences shift from growth deceleration to recession probability.
Full supply recovery is expected to take several months even after a reopening, meaning the market will not snap back to pre-disruption conditions on the day the strait reopens.
Investors wanting to model the resolution timeline in more detail will find our full explainer on Iran conflict oil price mechanics, which covers the pre-conflict $72-74 baseline, Federal Reserve rate-hold divisions, and the specific inventory depletion thresholds Barclays flagged as triggers for a secondary price spike above the April highs.
The gap between forecast extremes and actual Brent levels reflects a specific set of cushioning mechanisms, not a general resilience to supply shocks. Some of those mechanisms are structural and durable: energy intensity has declined over decades and will not reverse. Others are temporary: strategic reserve drawdowns deplete, Chinese stockpile resales are a one-time inventory release, and the Petroline is already at its physical ceiling with no further capacity to absorb additional displacement.
The single most important variable to watch is whether the IRGC-managed supervised pause transitions to genuine commercial lane restoration. Supply recovery timing is the fulcrum on which every institutional price forecast balances, from Goldman’s $90 base case to its $120 adverse scenario.
Investors tracking commodity exposure would benefit from distinguishing between the Brent headline and Asian delivered prices when assessing actual supply cost impact. The depth of backwardation in the futures curve remains the most actionable real-time signal for monitoring how the market’s disruption-duration assumptions are shifting.
This article is for informational purposes only and should not be considered financial advice. Investors should conduct their own research and consult with financial professionals before making investment decisions. Past performance does not guarantee future results. Financial projections referenced in this article are subject to market conditions and various risk factors.
Six simultaneous cushioning mechanisms have absorbed much of the shock: Saudi pipeline rerouting, UAE pipeline capacity, IEA strategic reserve releases, Iranian and Russian supply waivers, Chinese stockpile resales, and demand destruction. None is sufficient alone, but their combined effect has kept Brent near $108 rather than the forecast $150-$200 range.
Steep backwardation means near-month Brent contracts are priced significantly higher than contracts six or twelve months out, signalling that traders view the current supply scarcity as severe but temporary. This rewards physical oil holders and penalises long-dated futures positions, making the curve shape directly relevant to hedging strategy and commodity fund returns.
Brent peaked at $126.41 per barrel on 30 April 2026, while Dubai crude peaked at $169.75 per barrel in April 2026, reflecting the far more severe supply dislocation experienced by Asian buyers who relied on Hormuz-transiting crude. Investors with Asian supply chain exposure face a material gap between the Brent headline and actual delivered prices.
Goldman Sachs projects Brent at approximately $90 per barrel if normalisation occurs by end-June or end-July 2026, with an adverse scenario reaching $120 if the disruption persists beyond end-July. The EIA raised its 2026 Brent average forecast to $103 per barrel, reflecting a base case of partial supply restoration within the forecast window.
According to Wood Mackenzie's tiered impact analysis, Brent above $90 slows global GDP growth to 1.7% from a 2.5% pre-disruption baseline, while sustained $100 per barrel prices risk tipping the US and EU into recession. At the current level near $108, the global economy sits in the zone between growth deceleration and recession risk.